
The saga continues!
CTL’s Q1 results and their decision to look at strategic options for their consumer business has generated much discussion. The Q1 revenues were lighter (actual QonQ decline of -2.3%) than I had projected in either of my scenarios (base projected -0.7% and pessimistic -1.1%) whilst EBITDA was in line with my base scenario when the lease accounting change was included. The EBITDA margin figure of 40.1% was particularly impressive, given the revenue drop and lease accounting hit. However, as has been the way for several quarters now, revenue declined more than expected and that was the focus for the market. One bright spot was that management indicated a stabilization of quarterly revenue movements in the enterprise and global units in H2, with a possible stabilization in SMB by the end of the year or early next year. They also maintained their 2019 guidance. Showing progress on revenues and maintaining the EBITDA and free cash-flow guidance will be a key test of the market regaining confidence in management as the year progresses.
The new disclosures on revenue splits are very welcome and I have updated my strategy versus legacy revenue projections using voice and other non-core revenue (e.g. IT and managed services, other consumer) as the legacy business. As per my previous post, I estimated revenues independently using three splits (by business unit, by product type, by legacy and strategy for consumer and enterprise) and averaged each to get my new base and pessimistic projections, as below. It is getting tiresome having to change these projections each quarter and I suspect I will lose my patience with CTL if I have to change them again (downwards, that is) after the next quarterly results.
click to enlarge
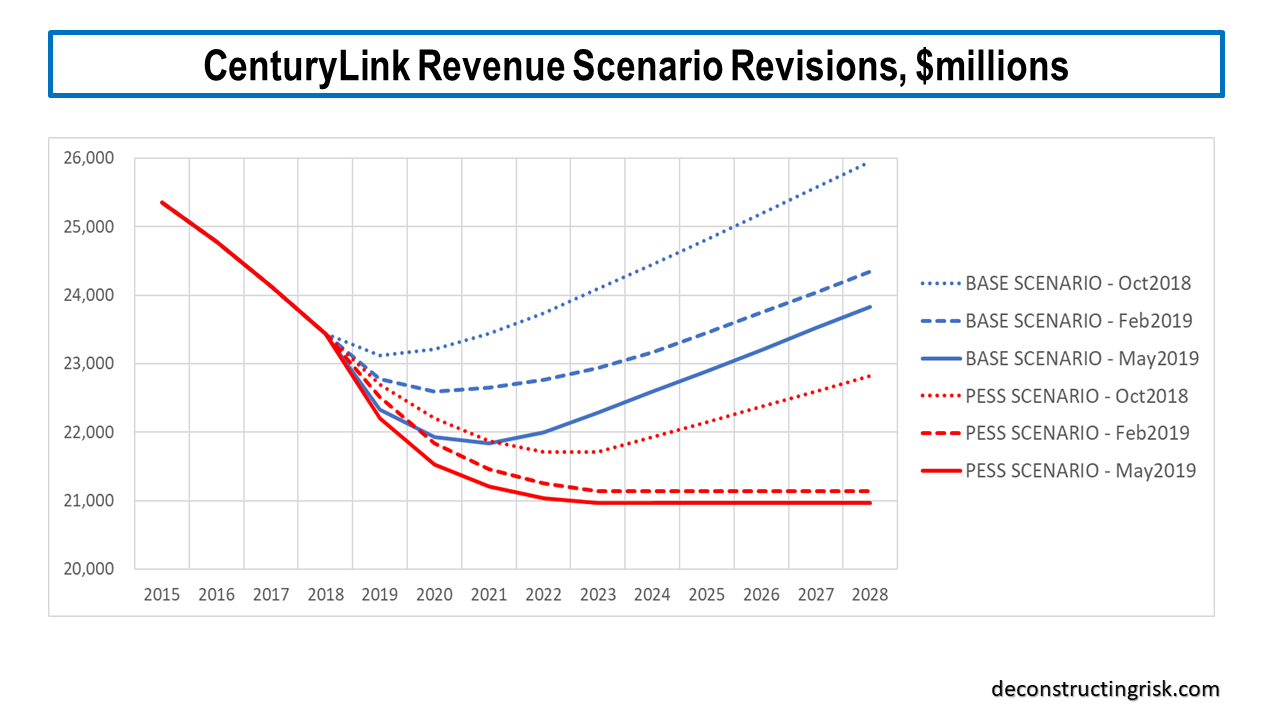
My latest base scenario assumes revenue declines bottom out a year later than before in 2021 at $21.8 billion representing an approximate 12% fall from the 2016 total, growing modestly thereafter at an average annual growth rate of 125 basis points for the following 7 years. My latest pessimistic scenario assumes revenue declines bottom out in 2023 at $20.97 billion representing an approximate 15% fall from the 2016 total, and flatlines thereafter.
The breakout of Q1 2019 and Q1 2018 EBITDA (on pages 27 and 28 of the 10Q) by business unit and product type also provides some interesting detail on the margin breakdown. It enabled me to rebuild my model on the margin erosion due to future changes in the business and product split. It also allowed me to look at splitting group “overhead” (both COGS and SG&A) to ensure that margin changes due to business mix sufficiently captured potential future restrictions from fixed overhead. This is a critical issue, as we’ll see later in the post, as at some stage CTL will hit a wall on cost cutting as revenues decline further.
For my base scenario, I have assumed approximately 60% of the group overhead or just over $1 billion is fixed expense which does not vary with revenue. For my pessimistic scenario, its 75% or $1.3 billion. My assumptions on achieving the $1 billion of transformation savings (including off-net to on-net gross margin improvements) with $650 million of one-off expenses over 3 years remain as per my last post. My revenue and EBITDA model outputs are compared to the current analyst figures below (I am not too sure on how many analysts have updated their figures based upon the Q1 results).
click to enlarge

The first item to highlight is that analysts are assuming ongoing decline in the top-line, obviously skeptical that strategic business, facing headwinds from the large cloud players and other technologically driven factors, will grow fast enough to overcome legacy declines in the medium term. The analyst figures also assume the highest EBITDA margin CTL can achieve is 40.9% by 2021 (I don’t have access to estimates beyond that), I am guessing due to the fixed “overhead” factor discussed above.
My base scenario on the other hand projects that EBITDA margins can reach a peek of 42.9% in 2022 before dropping to 42.7% in 2023 and thereafter. These figures assume the $1 billion of cost transformation savings are achieved by the end of 2021 and factor in the “overhead” restrictions discussed above. These restrictions become more pronounced in the pessimistic scenario where EBITDA margins peek in 2021 at 41.1% before dropping off to 40.3% by 2023 and thereafter. The differences in EBITDA margins between these scenarios and my previous estimates are more pronounced due to the changes I made to my model on fixed and variable “overhead”.
Taking these changes into account with other minor tweaks such as the interest rate expectations (with all of the other major assumptions such as the 16% capex spend as per my previous post), my model shows CTL can reach a net debt multiple of 3.1, within their target range, by the end of 2021 and a multiple of 2.76 by the end of 2022 whilst maintaining the $1 per share dividend. My DCF valuation for CTL in the base scenario is $28 per share. In the pessimistic scenario, they can reach a net debt multiple of 3.2 and 2.8 by the end of 2021 and 2022 respectively if the dividend is scrapped at the beginning of 2020. My DCF valuation for CTL in the pessimistic scenario is $10 per share. These valuations are down from $30 per share and $18 per share in my previous post for the base and pessimistic scenarios. The fixed cost restrictions are having a particularly hard impact on the pessimistic scenarios illustrating how important it is that CTL can show they are approaching the end of the revenue decline road.
On the announcement about looking at strategic options for the consumer business, I think it really is a move to placate Southeastern, the newly activist shareholder. As CTL management have stressed, where you draw the line on what the consumer business is really dictates the outcome. Still, as a means of getting Wall Street analysts to play nice in the hope of getting some business or simply as an exercise in looking at how to value the pieces of CTL, it should be worthwhile. The vast amount of money in the private equity (PE) sector looking at infrastructure deals may pay attention to the potential to buy all of CTL and break it up into its cash-flow constituents. It’s interesting that the new PE owners of ZAYO were able to raise $9 billion in debt when ZAYO only has about $6 billion of net debt (see this recent post on PE leverage)!
Notwithstanding the difficulties in valuing the consumer business, I had a go at it anyway assuming the existing classification of the consumer business applies! As the CFO recently highlighted, there would be a significant amount of dis-synergies in separating the consumer business from shared services and networks in the group. I have pro-rated the “overhead” costs and then applied a 33% uplift to account for a separate business needing their own back office facilities.
Before the uplift, I estimate that consumer with 25% of the total revenue generates approximately 33% of the EBITDA. After the uplift, I estimate (in my base scenario) that the consumer business will stabilize at $5.2 billion in revenue from 2021 onwards and generate a stand-alone EBITDA margin of 45.5%, around $2.4 billion. To enable the remaining CTL business to get a meaningful reduction in its net debt multiple, which I have assumed is a minimum reduction from the current 3.9 to 3.5 (using EBITDA net of the consumer business), I estimate that the consumer business would have to get a valuation of at least 6 times the $2.4 billion EBITDA figure or a price tag of at least $14.4 billion.
Even though fiber infrastructure businesses are going for much higher multiples, I can’t see anybody pay 6 times EBITDA for a consumer business with a significant rural footprint and a mix of fiber and copper networks. The recent comments from Windstream on reducing the lease payments to Uniti due to the “significant decline in the value of copper facilities” highlights one of the issues. Still, as I said previously, the process may throw up some interesting prospects.
