The speed dating jamboree that is the annual Monte Carlo Reinsurance Rendezvous kicks off on the 6th September where buyers and sellers (i.e. underwriters and brokers, with those clients that can afford the hotel rates) of speciality insurance and reinsurance kick off their discussions ahead of drawn-out negotiations for the January 2026 renewal season. Each side will earnestly set out their stall, with the US hurricane season as the backdrop (with the extent of any insured catastrophe losses playing a part in how actual negotiations progress towards the year-end), on the degree of rate, term, and condition changes for each client and/or client group.
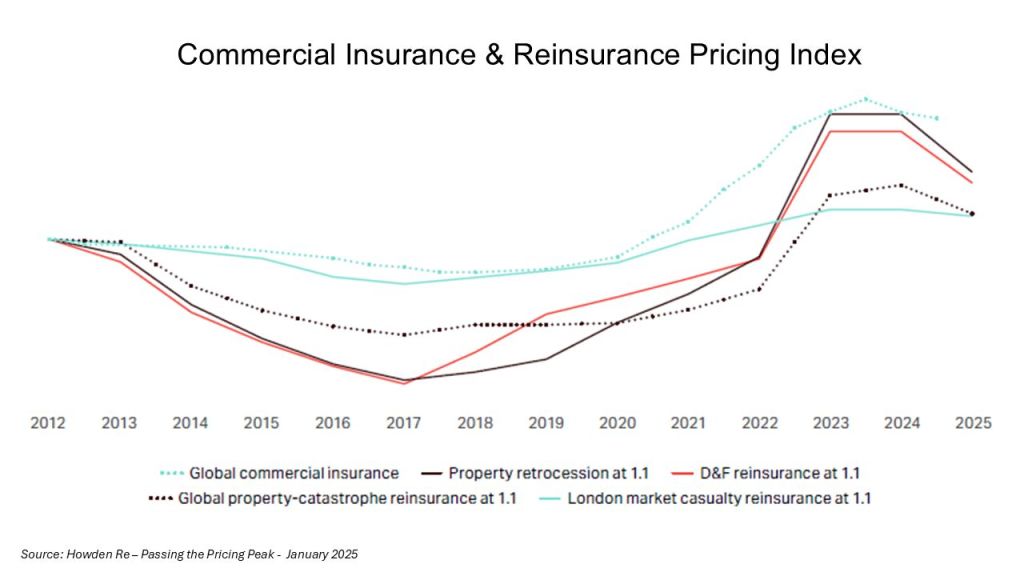
The fact that rates have peaked is now beyond doubt with even the losses from the California wildfires failing to shift the downward trend in rates. In January, David Flandro of reinsurance broker Howden Re stated “if it wasn’t obvious already, we are now firmly in the hard market softening phase of the rating cycle” with the exhibit below in a report entitled “Passing the Pricing Peak” illustrating the point.
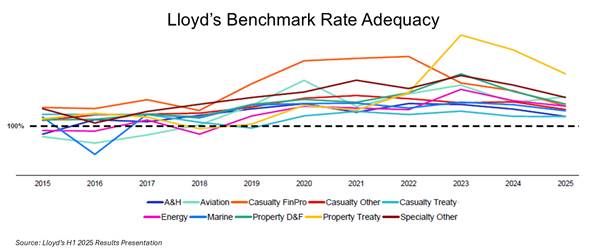
Metrics from Lloyd’s H1 presentation by new CEO Patrick Tiernan focus on the adequacy of rates in the context of the recent decline in rates, as per the exhibit below.
(Re)insurers and other commentators such as rating agencies are voraciously stressing the need for market discipline. A common defence from (re)insurers, as articulated by Flandro, is that “if you look at all lines, or most lines, we are still harder in terms of pricing than we were five years ago”. AM Best stated that “the lessons of past cycles suggest caution, but reinsurer sentiment has ensured tighter exposure management and market disciple in the current cycle” and asked, “the question now facing the industry is whether the improvements in terms and conditions represent a durable shift”. Fitch adjusted its outlook for the reinsurance sector to “deteriorating” stating that “softer pricing conditions and rising claims costs will pressure underwriting margins, though profitability remains strong by historical standards.” Munich Re CEO dismissed any talk of any meaningful softening in rates, stating “there is no soft market”. On the buyer side, Gallagher Re CEO highlighted that for property CAT business supply is now “materially outpacing demand”. There will be many such perspectives aired in articles and interviews over the coming week laying out the battle lines in these pre-negotiations.
A pickup in M&A is another sign that firms understand growth will not come from rates. Within the past few weeks, Sompo announced a deal to purchase Aspen at 1.3 times the tangible book and Skyward announced a deal for the Apollo Managing Agent in Lloyd’s at approx 8.5 times EBITDA, both sensible prices.
On my part, I will offer some of my thoughts on the subject in the remainder of this post through the lens of results and data over past decades, whilst updating some of the previous thinking detailed on this site (which are several years old now).
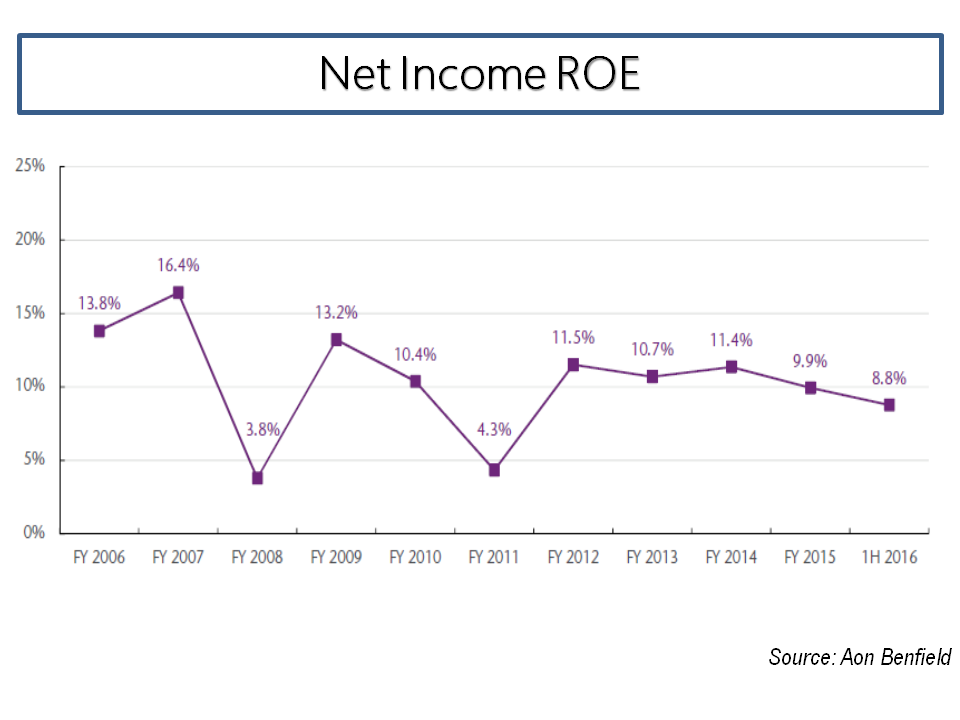
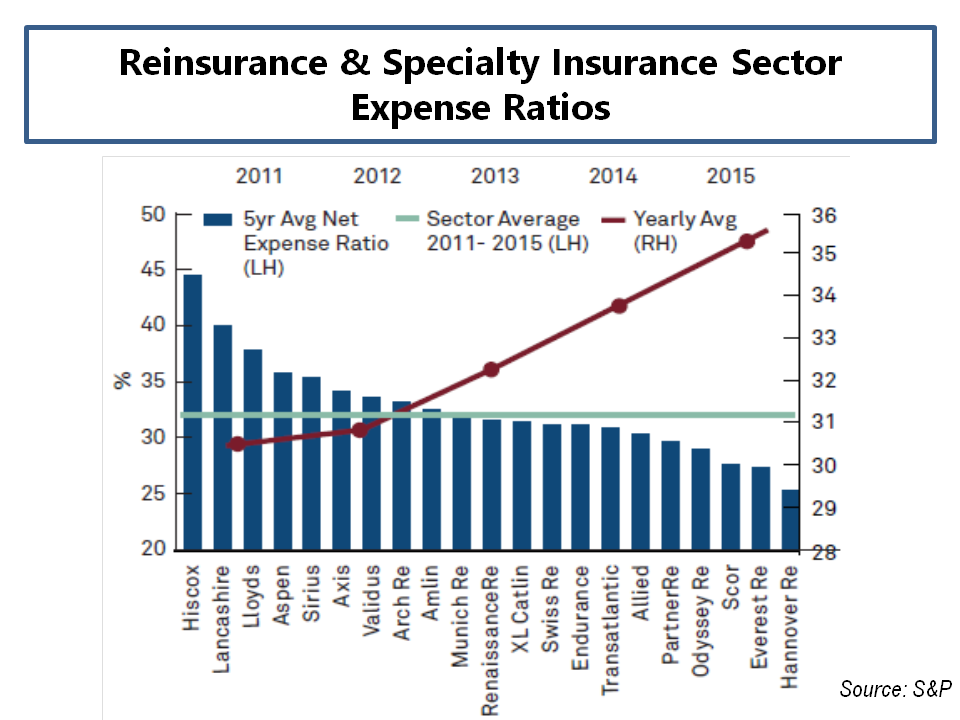
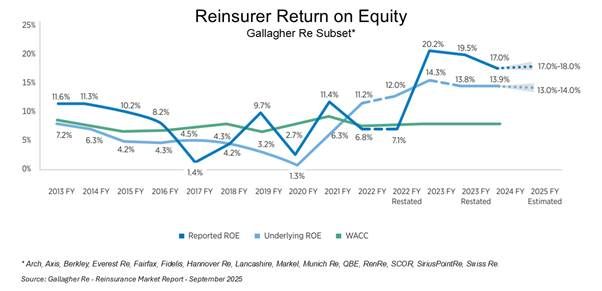
The first issue is to highlight the level of profitability the specialty insurance and reinsurance sector has enjoyed over the past few years. The exhibit below illustrates the heightened levels of ROE achieved by reinsurers over the cost of capital in recent years, according to a recent Gallagher Re mid-year report. Many would argue that such returns of 12-10% above the cost of capital are justified to compensate for the heightened risk environment of today given the climate, geopolitical, and macroeconomic issues at play.
By way of further illustrating the level of recent profits in the sector, Lloyd’s of London has just announced their H1 2025 results and the pre-tax profits of Lloyd’s from 2023, 2024 and H1 2025 equal the aggregate profit and losses from the previous 15 years (from 2007 to 2022). Lloyd’s has not had the two back-to-back return on capital years of 20%+ it had in 2023 and 2024 since 2006 and 2007.
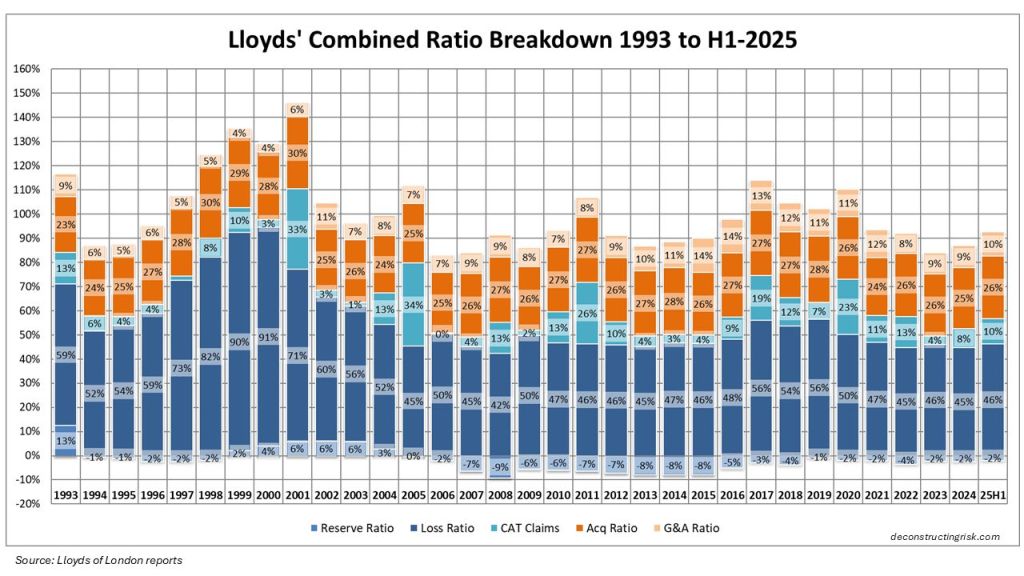
The introduction of IFRS 17 reporting for many specialty insurers and reinsurers has complicated comparative, historical and aggregate analysis in the sector so I will revert to Lloyd’s historical results as a benchmark for the sector’s history. Obviously, Lloyd’s results carry a significant degree of caution when used as a proxy for the whole sector and I would caveat their use by referring to a (now 10-year-old) post called “Lessons from Lloyds”. An updated breakdown of the Lloyd’s combined ratio from 1993 to H1 2025 is below.
To illustrate the specialty underwriting cycle, I have discounted these combined ratios to adjust for the time value of money applicable for each year (i.e. a discount factor equal to the average annual 1 year T-Bill rate for each year over a duration of 24 months). The next metric I used to represent changes in market rates is the Guy Carpenter ROL index for property CAT reinsurance. Although this is clearly not representative of all specialty lines (see pricing and rate exhibits above) it gives a directional sense of rates for the overall sector, and it is measured on a consistent basis over an applicable long-term period. Combining these metrics with the inflated historical CAT insured losses for the post preceding this one gives the following graphic.
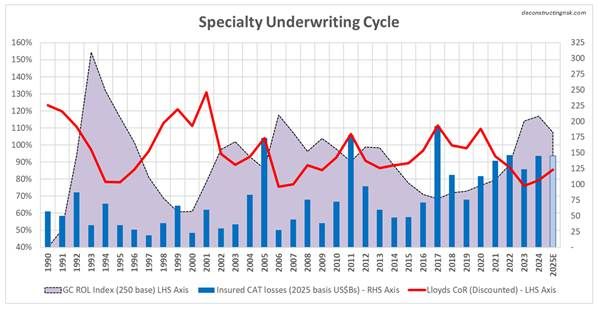
In a highly unscientific way, I judgementally selected an ROL index base of 250 for the graphic as representing a level of adequacy akin to an 85% discounted combined ratio (as per 1996, 2003, 2009, and 2013). A 250 base indicates that the current 2025 index level has a further 7% to fall before becoming “inadequate”. This selection does assume that the sector has historically been able to adjust T&Cs, specifically attachment levels, to stay ahead of trend changes in insured CAT losses (at approx. 6-9% per year recently) due to factors such as loss inflation and climate change (an obviously BIG assumption!).
So, what does the above graphic illustrate? Accepting the (vast) limitations of my simplistic analysis, it indicates that the market today is at a similar stage in the rate cycle as we were in 2007 and 2014 (I would discount the 1990’s as the wild west in terms of London market underwriting behaviour). However, as highlighted by Beazley CEO Adrian Cox “in contrast to the previous softer cycle, there is a fundamental difference in today’s environment; the claims environment is active in respect to both frequency and severity, and uncertainty is elevated”. In the 2007 and 2013 years and the years that followed each, insured CAT losses were relatively low which fed the subsequent declines in rates. The CAT losses of 2011 and 2017 represented the bottom of each of the soft cycles albeit that the peak of 2012 and 2013 were short lived and it took a full 5 years over 2018 to 2022 for rates to get to an “adequate” level again.
Most (re)insurers would agree wholeheartedly in public with Cox when he says, “rate discipline is essential”. However, I suspect brokers and clients in Monte Carlo will be pushing hard to reduce rates further given the level of recent profits from the sector. Discipline but not yet will be the mantra and the level of insured losses (CAT or otherwise) over the remainder of 2025 will, I suspect, dictate how much softening of the current hard market will actually result in the January 2026 renewals and through 2026.
As a postscript, I also updated the graphic on underwriting and credit cycles to see if there were any further insights to be had, as below.
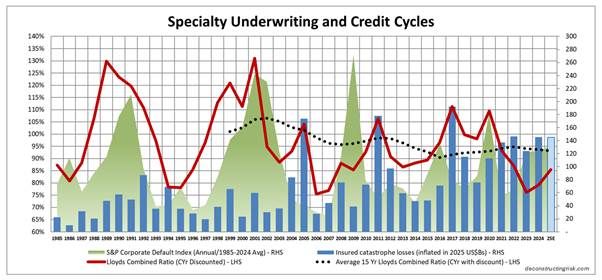
The first thing to note is that credit and insurance cycles can be driven from the same event – 9/11 and COVID are obvious applicable cases. The graphic shows that the credit cycles over the past 20 years do not obviously influence the underwriting cycles with insured CAT losses being a much more relevant factor in the underwriting cycle.
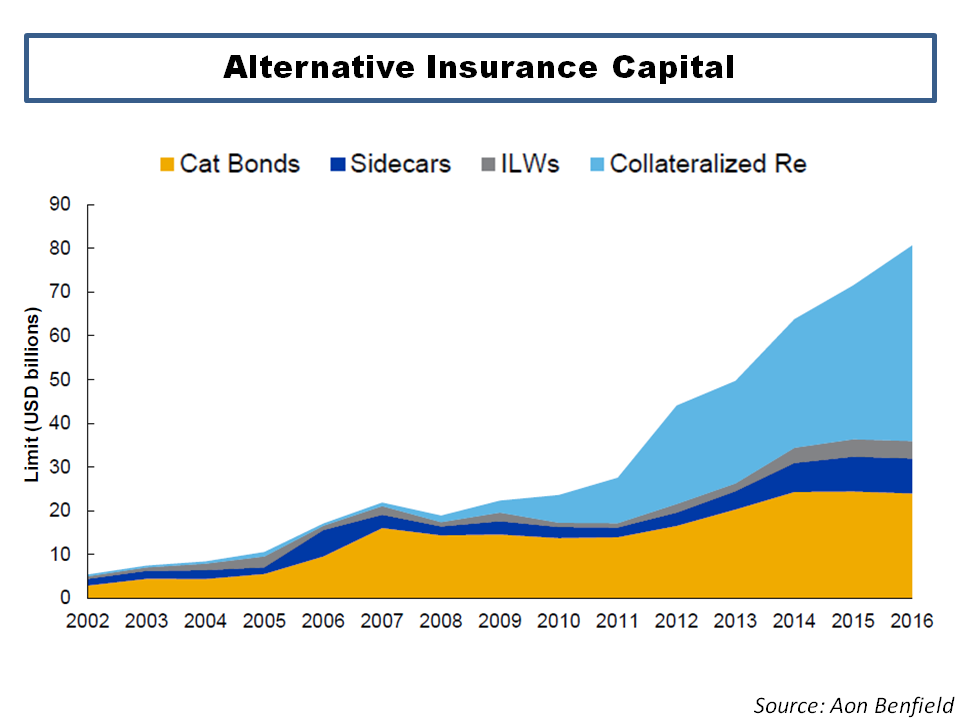
The lack of a rush of new capital into the sector following major loss years have been an important factor over the past 20 years in shaping the character of underwriting cycles although economic and interest rate cycles do influence the level of capital which comes into the ILS market. It is interesting to note that with interest rates on a downward track currently, the appetite for CAT related returns from investors is again playing a part in the current availability of reinsurance, particularly retro, capacity. Memories can be short and it looks like it may take more CAT losses to reinforce to current ILS investors the risk they are taking on and the curse of “uncorrelated” tail exposure.
Finally, the impact of the policies of the mad Orange King and his sycophants, whom a wise commentator recently generously called “economic morons”, may just result in a return of a big beautiful credit crash akin to those of the past in the coming months and years which, were it to occur, would undoubtedly negatively impact everybody including (re)insurers.
It will be intriguing to see exactly how the 2026 renewal negotiations play out over the coming weeks and months.