Tag Archives: BetFair

Befuddled Lloyd’s

Lloyd’s of London always provides a fascinating insight into the London insurance market and beyond into the global specialty insurance market, as this previous post shows. It’s Chairman, Bruce Carnegie-Brown, commented in their 2017 annual report that he expects “2018 to be another challenging year for Lloyd’s and the Corporation continues to refine its strategy to address evolving market conditions”. Given the bulking up of many of its competitors through M&A, Willis recently called it a reinvigoration of the “big balance sheet” reinsurance model, Lloyd’s needs to get busy sharpening its competitive edge. In a blunter message Brown stressed that “the market’s 2017 results are proof, if any were needed, that business as usual is not sustainable”.

A looked at the past 15 years of underwriting results gives an indicator of current market trends since the underwriting quality control unit, called the Franchise Board, was introduced at the end of 2002 after the disastrous 1990’s for the 330-year-old institution.

click to enlarge

The trend of increasing non-CAT loss ratios after years of soft pricing coupled with declining prior year reserve releases is clear to see. That increases the pressure on the insurance sector to control expenses. To that end, Inga Beale, Lloyd’s CEO, is pushing modernisation via the London Market Target Operating Model programme hard, stating that electronic placement will be mandated, on a phased basis, “to speed up the adoption of the market’s modernisation programme, which will digitise processes, reduce unsustainable expense ratios, and make Lloyd’s more attractive to do business with”.

The need to reduce expenses in Lloyd’s is acute given its expense ratio is around 40% compared to around 30% for most of its competitors. Management at Lloyd’s promised to “make it cheaper and easier to write business at Lloyd’s, enabling profitable growth”. Although Lloyd’s has doubled its gross premium volumes over the past 15 years, the results over varying timeframes below, particularly the reducing underwriting margins, show the importance of stressing profitable growth and expense efficiencies for the future.

click to enlarge

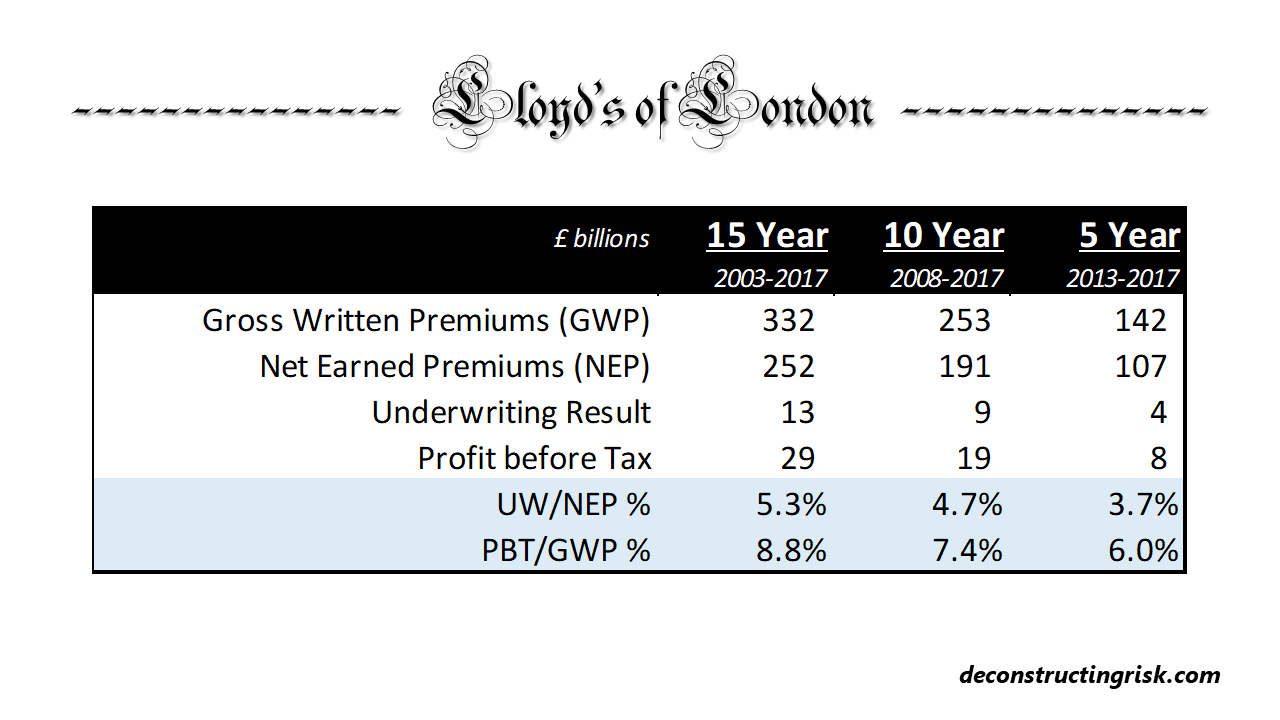
A peer comparison of Lloyd’s results over the past 15 years illustrates further the need for the market to modernise, as below. Although the 2017 combined ratio for some of the peer groupings have yet to finalised and published (I will update the graph when they do so), the comparison indicates that Lloyd’s has been doing worse than its reinsurance and Bermudian peers in recent years. It is suspicious to see, along with the big reinsurers and Bermudians, Lloyd’s included Allianz, CNA, and Zurich (and excluded Mapfe) in their competitor group from 2017. If you can’t meet your target, just change the metric behind the target!

click to enlarge

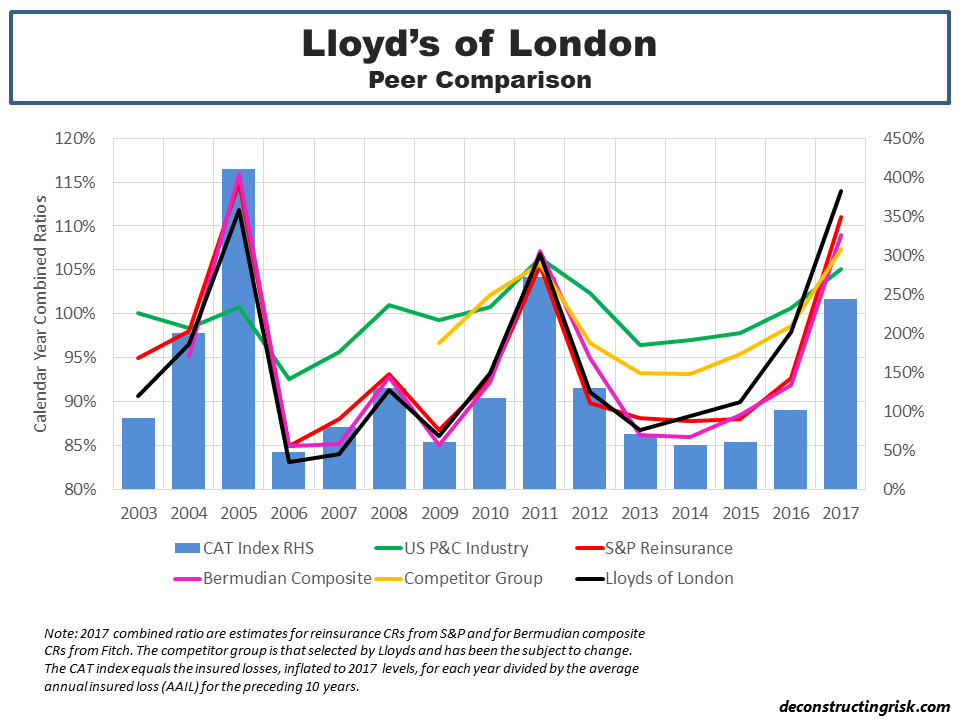
A recent report from Aon Benfield shows the breakdown of the combined ratio for their peer portfolio of specialist insurers and reinsurers from 2006 to 2017, as below.

click to enlargeAon Benfield Aggregate Combined Ratio 2006 to 2017

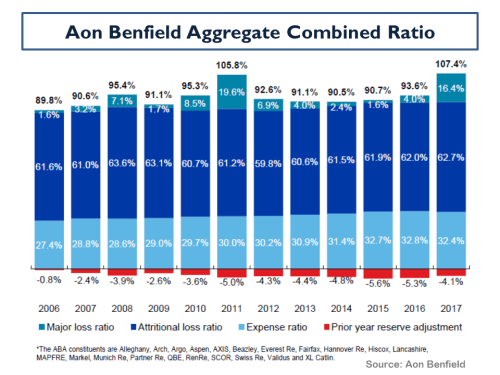
So, besides strong competitors, increasing loss ratios and heavy expense loads, what does Lloyd’s have to worry about? Well, in common with many, Lloyd’s must contend with structural changes across the industry as a result of, in what Willis calls in their latest report, “the oversupply of capital” from investors in insurance linked securities (ILS) with a lower cost of capital, whereby the 2017 insured losses appears to have had “no impact upon appetite”, according to Willis.

I have posted many times, most recently here, on the impact ILS has had on property catastrophe pricing. The graph of the average multiple of coupon to expected loss on deals monitored by sector expert Artemis again illustrates the pricing trend. I have come up with another angle to tell the story, as per the graph below. I compared the Guy Carpenter rate on line (ROL) index for each year against an index of the annual change in the rolling 10-year average global catastrophe insured loss (which now stands at $66 billion for 2008-2017). Although it is somewhat unfair to compare a relative measure (the GC ROL index) against an absolute measure (change in average insured loss), it makes a point about the downward trend in property catastrophe reinsurance pricing in recent years, particularly when compared to the trend in catastrophic losses. To add potentially to the unfairness, I also included the rising volumes in the ILS sector, in an unsubtle finger point.

click to enlarge

Hilary Weaver, Lloyd’s CRO, recognises the danger and recently commented that “the new UK ILS regulation will, if anything, increase the already abundant supply of insurance capital” and “this is likely to mean that prices remain low for many risks, so we need to remain vigilant to ensure that the prices charged for them are proportionate to the risk”.

The impact extends beyond soft pricing and could impact Lloyd’s risk profile. The loss of high margin (albeit not as high as it once was) and low frequency/high severity business means that Lloyd’s will have to fish in an already crowded pond for less profitable and less volatile business. The combined ratios of Lloyd’s main business lines are shown below illustrating that all, except casualty, have had a rough 2017 amid competitive pressures and large losses.

As reinsurance business is commoditised further by ILS, in a prelude to an increase in machine/algorithm underwriting, Lloyd’s business will become less volatile and as a result less profitable. To illustrate, the lower graph below shows Lloyd’s historical weighted average combined ratio, using the 2017 business mix, versus the weighted average combined ratio excluding the reinsurance line. For 2003 to 2017, the result would be an increase in average combined ratio, from 95.8% to 96.5%, and a reduction in volatility, the standard deviation from 9.7% to 7%.

click to enlarge

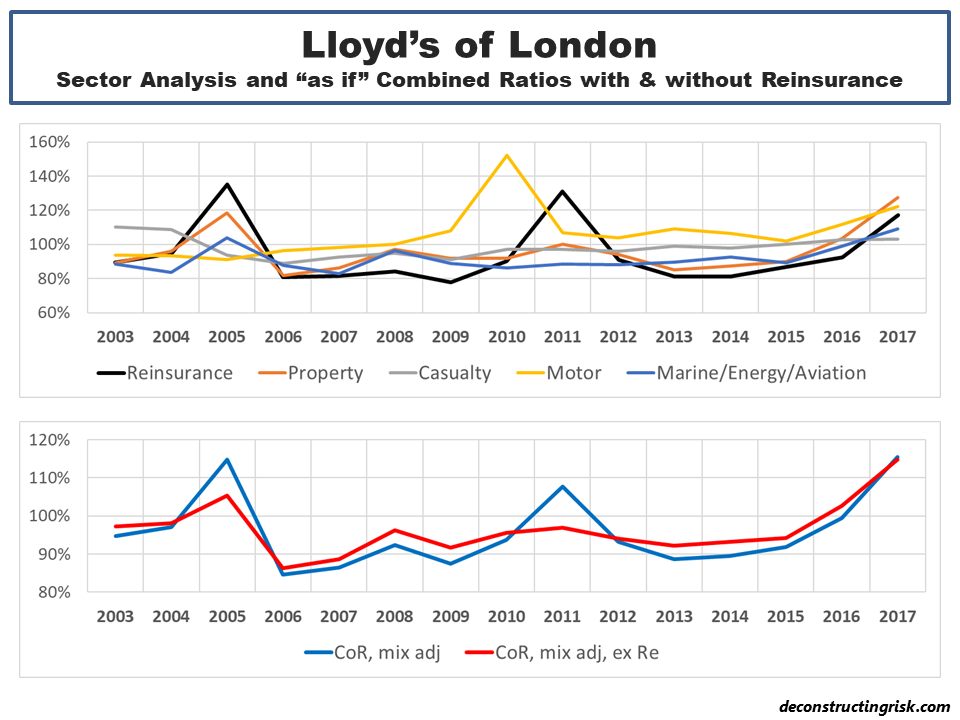
To write off Lloyd’s however would be a big mistake. In my view, there remains an important role for a specialist marketplace for heterogeneous risks, where diverse underwriting expertise cannot be easily replicated by machines. Lloyd’s has shown its ability in the past to evolve and adapt, unfortunately however usually when it doesn’t have any choice. Hopefully, this legendary 330-year-old institution will get ahead of the game and dictate its own future. It will be interesting to watch.


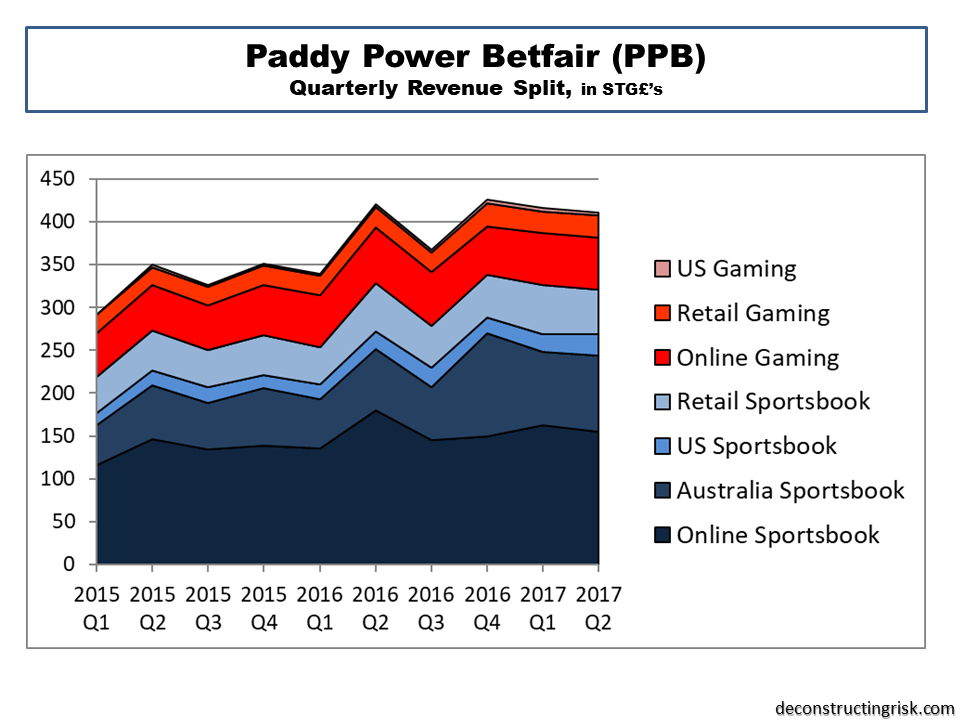
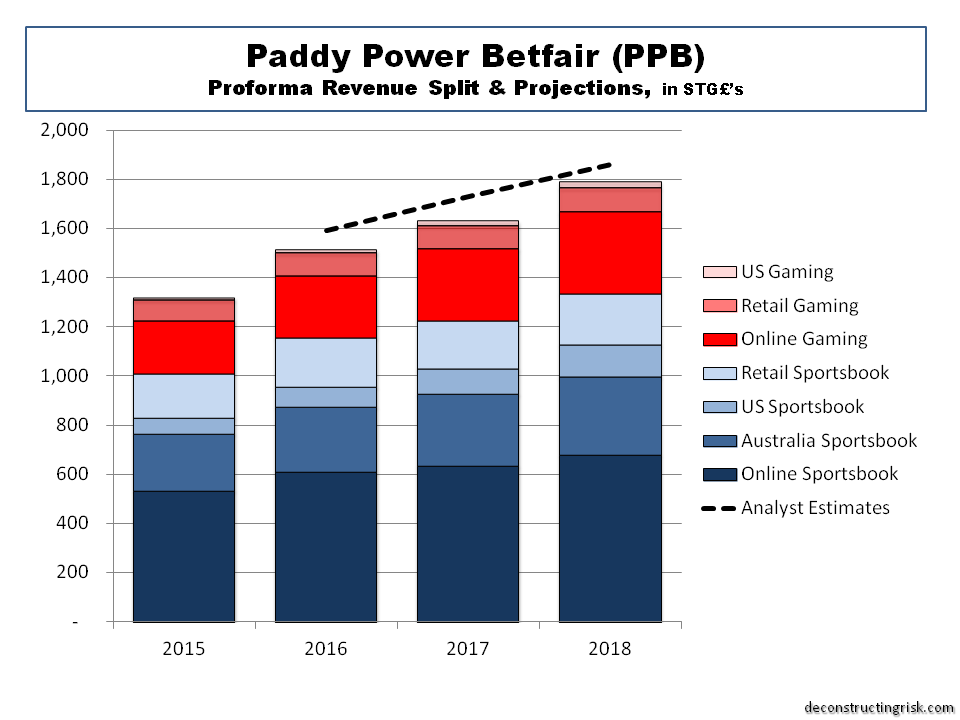
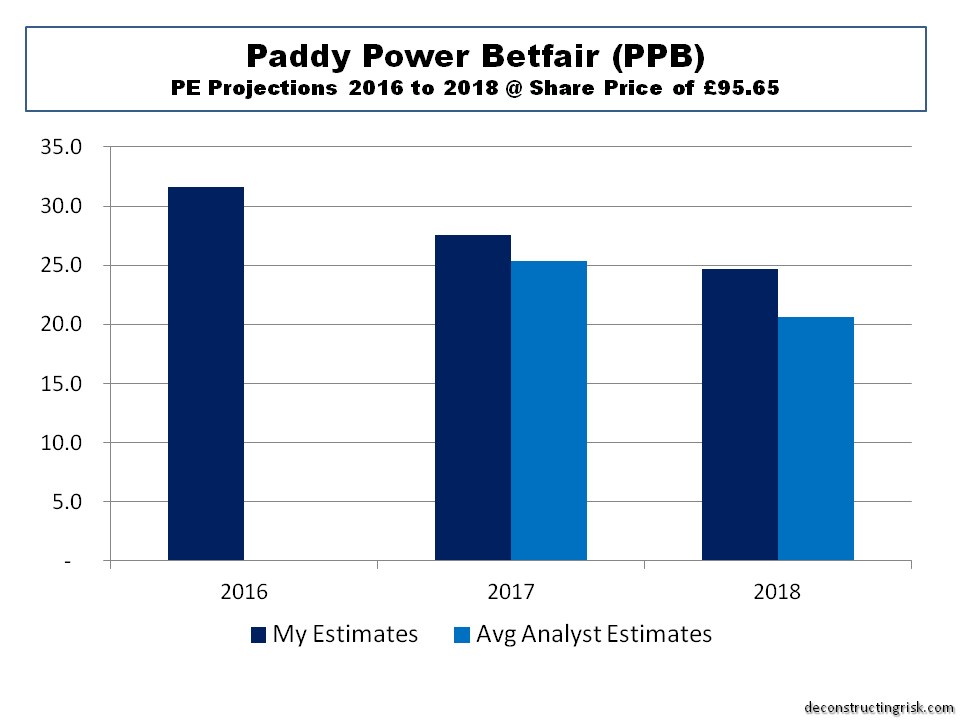
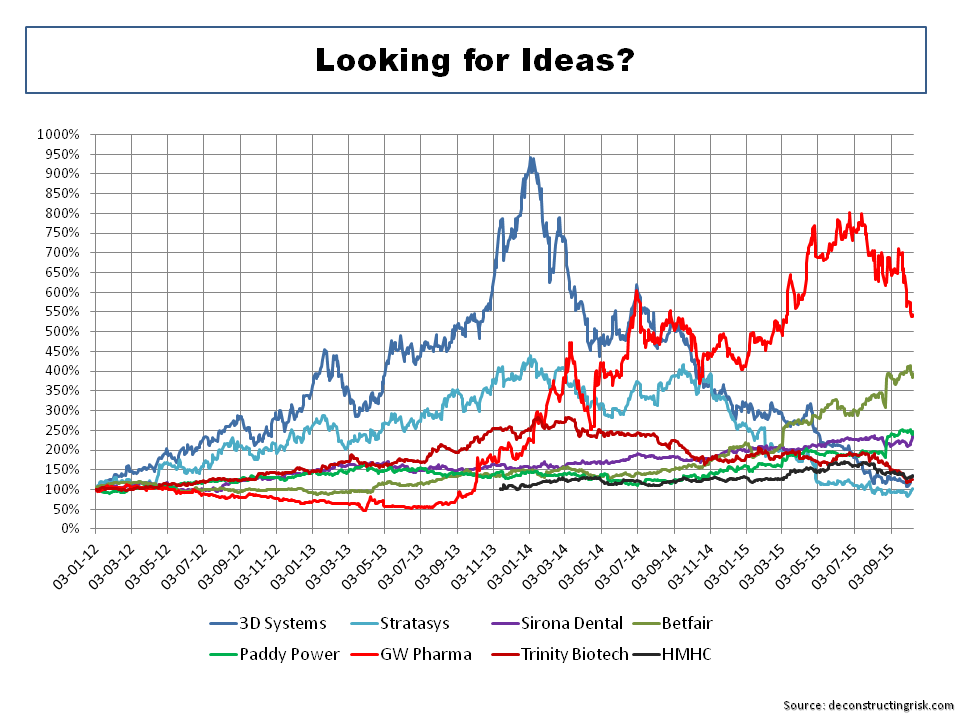
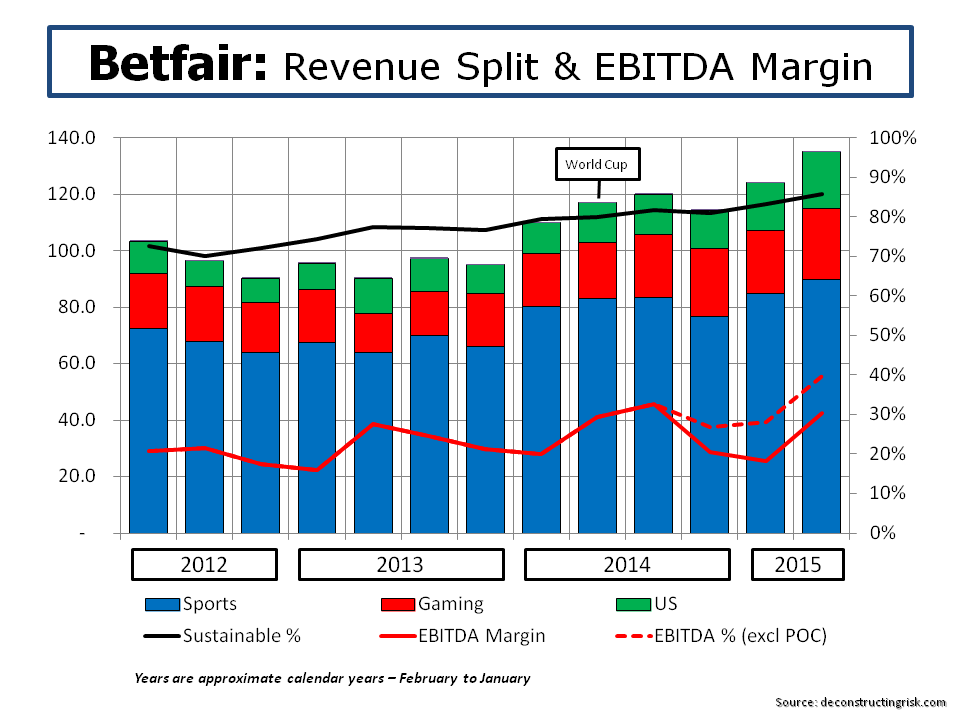
Epilogue – Although this analogy has limitations, it occurs to me that the insurance sector is at a stage of evolution that the betting sector was at about a decade ago (my latest post on the sector is here). Traditional insurers, with over-sized expenses, operate like old traditional betting shops with paper slips and manual operations. The onset of online betting fundamentally changed the way business is transacted and, as a result, the structure of the industry. The upcoming digitalisation of the traditional insurance business will radically change the cost structure of the industry. Lloyd’s should look to the example of Betfair (see an old post on Betfair for more) as a means of digitalising the market platform and radically reducing costs.

Follow-on 28th April – Many thanks to Adam at InsuranceLinked for re-posting this post. A big welcome to new readers, I hope you will stick around and check out some other posts from this blog. I just came across this report from Oliver Wyam on the underwriter of the future that’s worth a read. They state that the “commercial and wholesale insurance marketplaces are undergoing radical change” and they “expect that today’s low-price environment will continue for the foreseeable future, continuing to put major pressure on cost“.

Paddy Purgatory

The last time I posted on Paddy Power Betfair (PPB.L) in March, I highlighted the rich valuation and cautioned better value may be had on future dips, ending with the comment that “the game of speculation is all about getting the best odds”. Well, PPB.L has been on quite a ride in recent months. First the prospect of disappointing operating results put the stock under pressure and last week the bombshell that the golden boy CEO, Breon Corcoran, wants to do something more meaningful with his time. The result, as can be seen below, is PPB.L down 15% since the start of the year and 20% since this time last year.

click to enlarge

The revenue for the latest quarter, even after adjusting for the lack of the Euro soccer tournament in 2016, disappointed analysts who are fretting about whether reduced net revenue margins are part of a trend.

click to enlarge

Despite the firm putting reduced net revenue margins primarily down to unfavourable sports results (increased promotion costs also contributed, doing things like paying out on Hilary Clinton prior to the actual election results doesn’t help!), the worry is that competitive pressures rather than bad luck are resulting in reduced net revenue and gross win margins. [Net revenues are gross wins less VAT and fair-value adjustments for free bets, promotions and bonuses]. Care needs to be taken when comparing gross win margins (i.e. gross win divided by amounts staked) and net revenue margins across firms as the make-up of the underlying portfolio is important (e.g. gross wins varies by sport type such as football, horses, tennis, etc and by geography) and firms may account for certain items differently. Also, the absence of the largest online player, the privately owned Bet365, makes industry analysis difficult for amateurs like me.

click to enlarge

Of course, this sector is haunted by regulatory risk. The predicted restrictions of the highly addictive gaming machines by the UK Government is expected to impact PPB’s high street competitors much more that PPB.L. For example, PPB.L only derives 6% of its revenue from gaming machines compared to 30% for William Hill. The reaction of PPB’s competitors to compensate for restrictions on gaming machine revenue is likely to have a bigger potential impact on PPB.L’s future results.

For me, the biggest disappointment in the Q2 results wasn’t the revenue line but the operating margins. The full year 2017 EBITDA projection was nearly 10% shy of my estimates. The firm acknowledged that the platform integration has been taking longer than planned and took up over 70% of internal technology resources in Q2. This is projected to reduce to 60% and 30% in Q3 and Q4 respectively before been completed by year end. Releasing these resources will allow a refocus on product development and on fixing other problem areas such as their online gaming offerings. As a result of the Q2 results, I have taken a knife to my earnings estimates (my revenue estimates only required minor adjustment) for 2017 and 2018, as the graphic below shows.

click to enlarge

My 2017 and 2018 EPS estimates have reduced to £3.72 and £4.01 respectively, down 10% and 12% from my previous estimates. That puts PPB.L’s current market cap at a PE of approximately 20 and 18 for 2017 and 2018. That’s not bad for a firm with EPS growth of 13% and 8% for 2017 and 2018 respectively although, if these figures turn out to be accurate, the share price is likely to have gone lower that it currently is on worries about reducing operating metrics in a fiercely competitive market.

These estimates are conservative in my view, possibly overtly so. They reflect a sense that Breon Corcoran’s reason to go off into the tech sunset now is really due to concerns about the medium-to-long term prospects for the sector. Corcoran obviously has put a different explanation forward, one which is suspiciously unconvincing given the amount left undone at PPB.L, although he still does have about £40 million of share options in PPB.L. No firm is simply about the CEO and at the end of the conference call an indication was given of ensuring more exposure to the full management team in future investor engagements. That should help investors get more comfortable with management depth at the firm. I know nothing about the new CEO, Peter Jackson, so he has a real challenge in gaining investor’s confidence. He has big boots to fill as far as investors are concerned.

So, yet again, I suggest the best course of action is to wait, both for existing and new shareholders, and see how 2017 develops for PPB.L. There can be little doubt that recent events mean that the odds on PPB.L have lengthened.

PS- PPB have already paid out on Floyd Mayweather prior to his 26th of August fight with Conor McGregor. In the unlikely event that the Irishman does achieve the impossible PPB’s Q3 net revenue margins will suffer……

Peaky Power

The last time I posted on Paddy Power Betfair (PPB.L), I highlighted it was looking pricey in the mid-to high 90s. It has since traded down to the eighties and recently dipped below £83 after the full year results. Although it has now quickly recovered up around £88, the initial disappointment over the online revenue in Q4 sent the stock down 6%.

The graph below shows quarterly revenues, which met expectations largely due to the favourable A$ rate with Australia revenue up 34% in sterling but only 18% in the underlying currency. Management make a point of stating that “approximately 70% of our profits are sterling denominated, and accordingly, we are not exposed to FX translation fluctuation”. Events such as the summer 2016 Euros contribute to the revenue spike in Q2 2016.

click to enlarge

They exceeded my expectations on the bottom line with an operating profit of £182 million for H2 over my expectation of £160 million, with the merger expense and intangible write-off impacts of £300 million for the full year stripped out. The EPS of £3.30 for 2016 on average 80 million shares was impressive. I messed up on the average share count (again!) in my previous EPS estimate.

PPB stated that they “expect to complete the integration of our European online platforms by the end of 2017” and “until then, new product releases on the Paddy Power brand will be relatively limited, but on completion customers will see immediate benefits”. Despite their market beating margins on their dominant online segment, they caution that “a lot of the sportsbook operators acknowledge that gaming got harder in the second half of last year” and  they always emphasis that they operate in a very very competitive market. It looks to me like PPB management are trying to carefully manage expectations for 2017 and are likely nervous that large competitors like William Hill and Ladbrokes could possibly recover from recent online slumps and (just maybe) finally get their act together online.

There is an ongoing regulatory headwind in this business and 2016 bought items such as the online gaming point of consumption tax, the statutory Horserace Betting Levy, and the UK Competition and Markets Authority (CMA) investigation into UK online gambling (update due in April) to the fore. In addition, South Australia announced a 15% consumption tax effective from July 2017. The UK Government’s Review of Gaming Machines is a much bigger deal for PPB’s larger competitors as it only makes up 6% of their revenue.

PPB have substantially completed the integration of risk and trading functions which means that Paddy Power proprietary pricing and risk management tools are now used for over 85% of the bets on the Betfair sportsbook across 19 sports. They stated that “operating two individual brands on an integrated shared function is also proving to be beneficial for efficiency” and that the “pooling of analytics data has improved our econometric modelling, giving us greater insight into the effectiveness of marketing activity and leading to improved optimisation of spend”. These are critical factors in why PPB is differentiating itself operationally from its peers and are important to the success of the business model envisaged by the merger.

So, although I have likely got the share count wrong again (I am assuming an average of 85 million this time across 2017 and 2018), my new projections are below. I estimate growth of 5% and 11% for revenue in 2017 and 2018 respectively and EPS growth of 14% and 20% respectively. I factored in a degree of topline and bottom line upside in 2018 from the soccer world cup in Russia (assuming politics hasn’t messed up the world order by then!). That represents a PE multiple of 19.4 on an 2018 EPS estimate at a share price of £88 (2017 PE of 23.3). Not bargain basement cheap but not crazy mad either. With a targeted payout rate of 50%, my estimates could mean a dividend yield of 2% and 3.5% for 2017 and 2018 (again at a £88 share price).

click to enlarge

That looks like a better dynamic that the one at a share price in the mid to high 90’s, as per my post in August. If only I wasn’t so negative about overall valuations across the market, I would have added to my PPB position on the dip after the results last week. [Customary caution: PPB is not for the faint hearted, it is the gambling business after all!]. My instinct tells me markets will be bumpy in the coming months, valuation wise (e.g. rising interest rates, politics!). That may prove an opportune time to get more of PPB at a good price. After all, the game of speculation it is all about getting the best odds!

Paddy Power Betfair Revisited

It has been about 10 months since I posted on the potential for the Paddy Power and Betfair merger and a lot has happened since. Brexit and the resulting sterling volatility are obvious events of significance. In the betting sector, consolidation has continued with the Ladbrokes and Gala Coral merger having been announced and approved. The audacious proposed tie up by Rank and 888 on William Hill floundered with recent press reports suggesting Rank and 888 could get together. The consolidation in this rapidly changing sector is far from over.

The initial optimism on the future prospects for the two high achieving entities, Paddy Power and Betfair, resulted in the share price trading above the £100 level earlier in the year. Following Brexit, it traded as low as £80. The merged firm reported their H1 figures earlier this week which showed the full extent of the merger costs and provided an increased cost synergies figure for 2017 of £65 million. With 75% of EBITDA being sterling based, the currency impact was not as material as their multi-jurisdictional operations would suggest.

Top-line results for H1 do however indicate that 2016 revenue growth will likely not be as high as the 17% I had expected in November. The reality of issues in this regulated and highly competitive sector also served as a reminder that the path may not be as smooth as initially hoped for. Regulatory headwinds in Australia were an example. As a result, I revised my revenue estimates in November from £1.64 billion to £1.51 billion. The graph below shows the breakdown of my revenue estimates for the next few years with a comparison to overall average analyst estimates.

click to enlargePaddy Power Betfair pro-forma revenue split August 2016

Also, I have revised my previous earnings estimates with an operating profit margin of 20% for 2016, growing to 22% in 2017 and 23% in 2018. Based upon a share count of 86 million as at end June 2016 (which includes 2 million treasury shares), I estimate the H2 EPS at £1.55 which when added to the H1 EPS of £1.45 gives a full year 2016 EPS of £3.02.[ This 2016 estimate does represent an operating EPS of £3.79 which compares to my November estimate of £3.85 albeit that the November estimate was based upon suspect figures like the share count!!]. At today’s share price of £95.65, the PE multiple for 2016 is a hefty 31.6. The graph below shows the multiple based on my EPS estimates for 2016, 2017 and 2018 compared to those using the average analyst estimates.

click to enlargePaddy Power Betfair PE Multiples 2016 to 2018

In conclusion, I remain optimistic about the business model of Paddy Power Betfair particularly given the proven quality of the management team and their history of execution. However, quality doesn’t come cheap and the current valuation is priced for perfection. For new investors, it may be prudent to wait for a better entry point.

Time for a gamble?

While waiting for earnings season to show how firms are forecasting the impact of macro trends, it’s a good time to look over some investing ideas for the future. Having a few names selected that can be picked up in market weakness is always a good way of building quality positions. It also helps in viewing current positions to see if they stack up to alternatives.

Regular readers will know that I think the insurance sector is best left alone given pricing and competitive pressures. Despite the odd look from afar, I have never been able to get comfortable with hot sectors such as the Chinese internet firms (as per this July post). The hype around new technologies such as 3D printing has taken a battering with firms like 3D Systems and Stratasys bursting the bubble. A previous post in 2014 highlighted that a focussed play on 3D printing such as Sirona Dental makes better sense to me. The Biotech sector is not one I am generally comfortable in as it seems to me to be akin to leveraged one way bets (loss making firms with massive potential trading a large multiples of revenue). Firms such as GW Pharma which are looking at commercializing cannabinoid medicines for multiple sclerosis, cancer and epilepsy have had the shine taken off their gigantic runs in the recent volatility. My views on Trinity Biotech (which is not really a biotech firm) were expressed in a recent post in May and haven’t really changed despite a subsequent 25% drop. I need to see more results from TRIB to get comfortable that the core business justifies the current valuation with the upside being in the FDA approval of the Troponin point-of-care cardiac tests. Other ideas such as online education firm Houghton Mifflin Harcourt (in this post) have failed to sparkle.

click to enlargeInvesting Ideas October 2015

This leads me to the online gambling sector that I have posted on many times (here and here for example) and specifically to the Paddy Power/Betfair merge. My interest in this sector has not been one from an investment point of view (despite highlighting that PP and Betfair would make a good combination in May!) but I can’t get the recent performance of these two firms out of my head. The graph below shows the profit before tax margins of each (with my estimate for 2015).

click to enlargePaddy Power Betfair Historical PBT Margins

One of the things that stand out is how Betfair’s margin has improved, despite the recent headwinds such as the UK point of consumption (POC) tax. Indeed the market view that Betfair CEO Breon Corcoran is the new messiah can best be illustrated in the graph below on the firm’s performance since he took charge (revenue in sterling). It shows solid revenue growth (particularly from sustainable markets) and the incredible recent growth in EBITDA margin despite the drag of 9% of EBITDA margin from the POC tax.

click to enlargeBetfair Revenue Split & EBITDA Margin to July 2015

At the most recent results, Corcoran did highlight some headwinds that would bring the margins down (e.g. phasing of marketing spend and increased product investment) but emphasised the “high level of operational gearing” in the business and the “top-line momentum”. The merger of these two high class firms under a proven management team does make one giddy with the possibilities. The brokers Davy have a price target of €129 on the Paddy Power shares (currently trading just below €100). More information should emerge as documents for the shareholder votes are published (closing date expected in Q1 2016). An investor presentation does offer some insight (for example, as per the graphic below).

click to enlargeOnline Gambling Sector

I have calculated some initial estimates of what the combined entity will look like. Using an assumed constant sterling to euro FX rate of 1.30 and trying to adjust for Betfair’s funny reporting calendar, I estimate calendar year revenue growth 2016 to 2015 at 17% assuming a sterling reporting currency, as per the split below.

click to enlargePaddy Power Betfair pro-forma revenue split

I also calculated a profit before tax margin for the combined entity of 18% which increases to 21% post cost savings. Given approx 91 million shares in the new entity, my estimated operating EPS for 2016 is therefore approx £3.85 or approx €5.00 which gives a 20 multiple to operating earnings at the Paddy Power share price around €100 today.

So is buying into the merger of two quality firms with top management in a sector that is undergoing rapid change at a multiple of 20 sensible in today’s market? That depends whether you think it’s time for a gamble or whether patience will provide a more opportune time.