Tag Archives: Bet365

Fancy Flutter

Even before the COVID19 outbreak, it was a time of rapid change and transformation in the sports betting and online gaming sector. Since my last post nearly a year ago, the big news was the merger of Flutter (FLTR.L) and the Stars Group Inc. (TSG) in an all stock deal (at a 55%:45% split). The deal was announced in October and closed in May. The headwinds in the sector include an increased regulatory focus, particularly on problem gambling, and an array of new taxes and restrictions which have pushed the sector further along the consolidation route. The great hope for the sector was the opening of online gambling and gaming in the US.

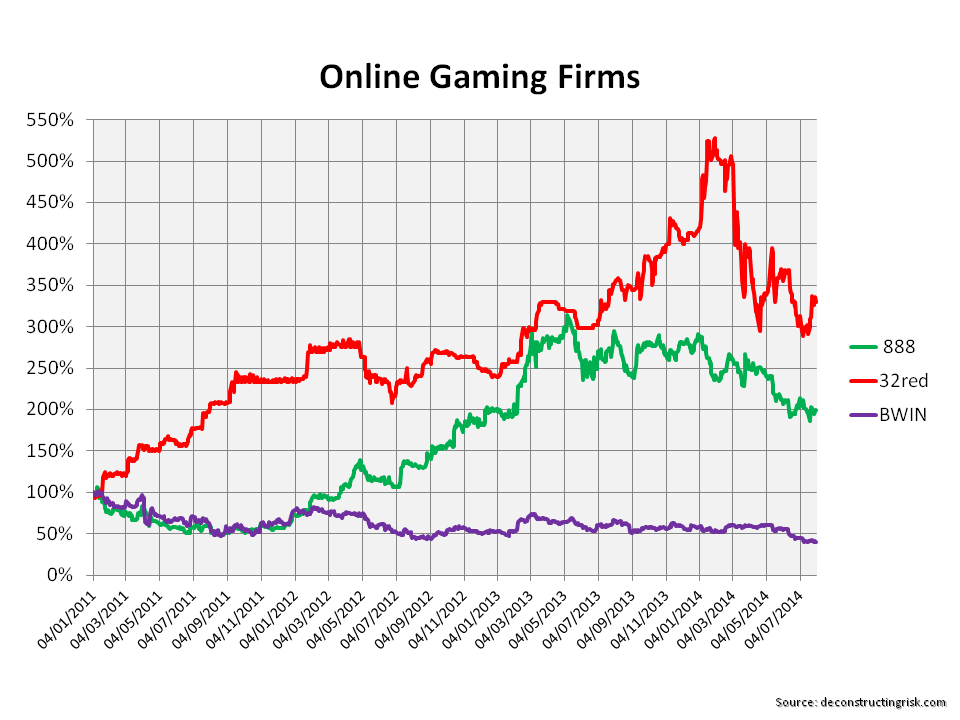
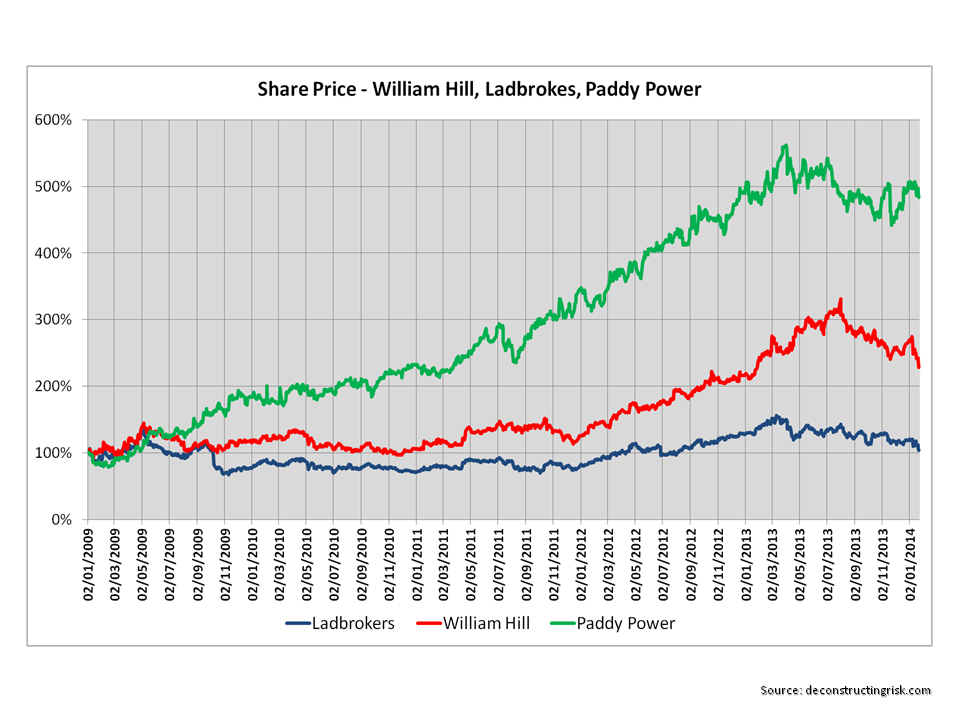
With that as the background, the COVID19 pandemic initially looked like it could create serious issues for the sector with cancelled sports events and retail shop closures. As the virus developed however, the upside in the demand for online gaming and gambling from people stuck at home combined with the spending power of government checks has resulted in a surge of online activity, particularly in gaming. The graph below of the relative share price movements over the past year for a sample of the market players illustrates the renewed optimism with the recent announcements on heightened online activity.

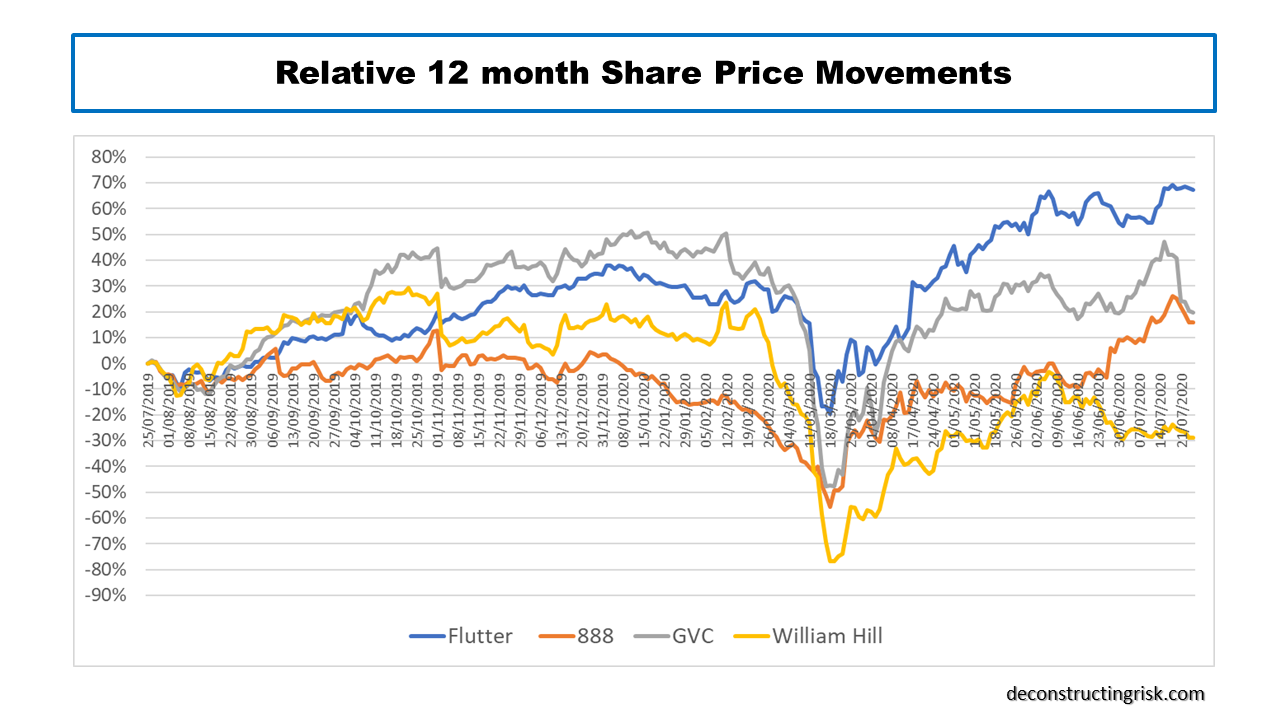
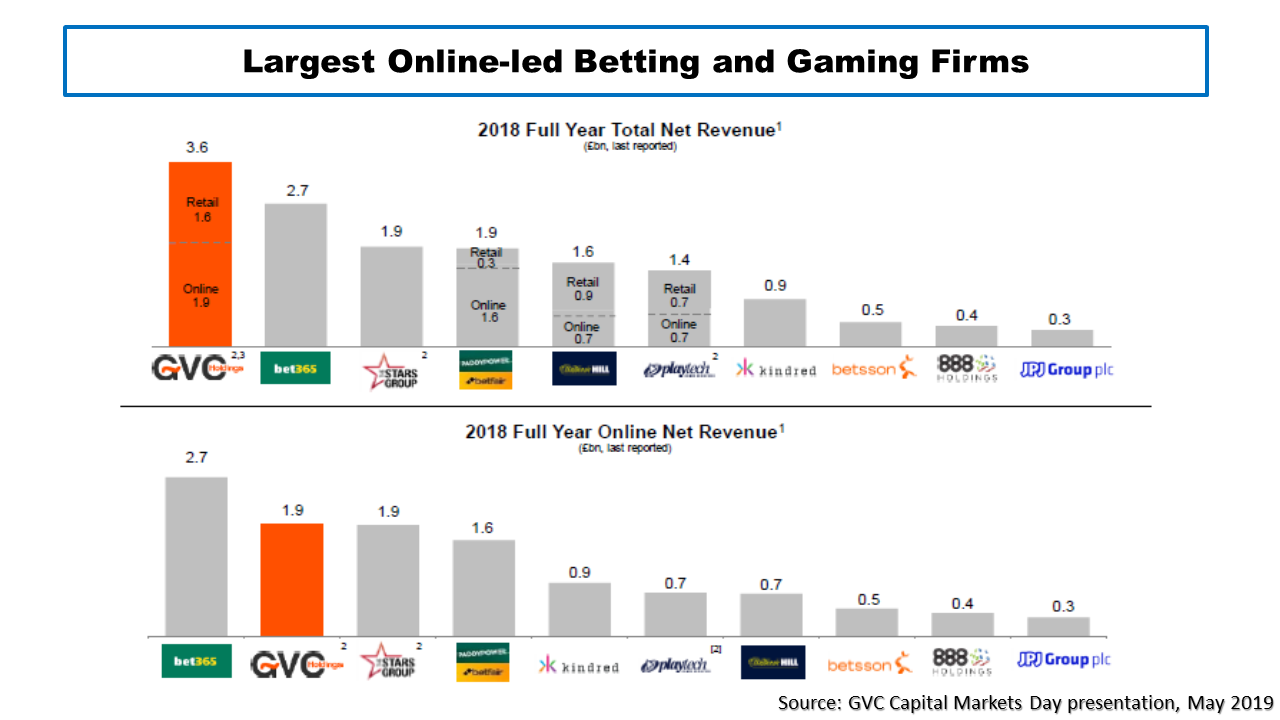
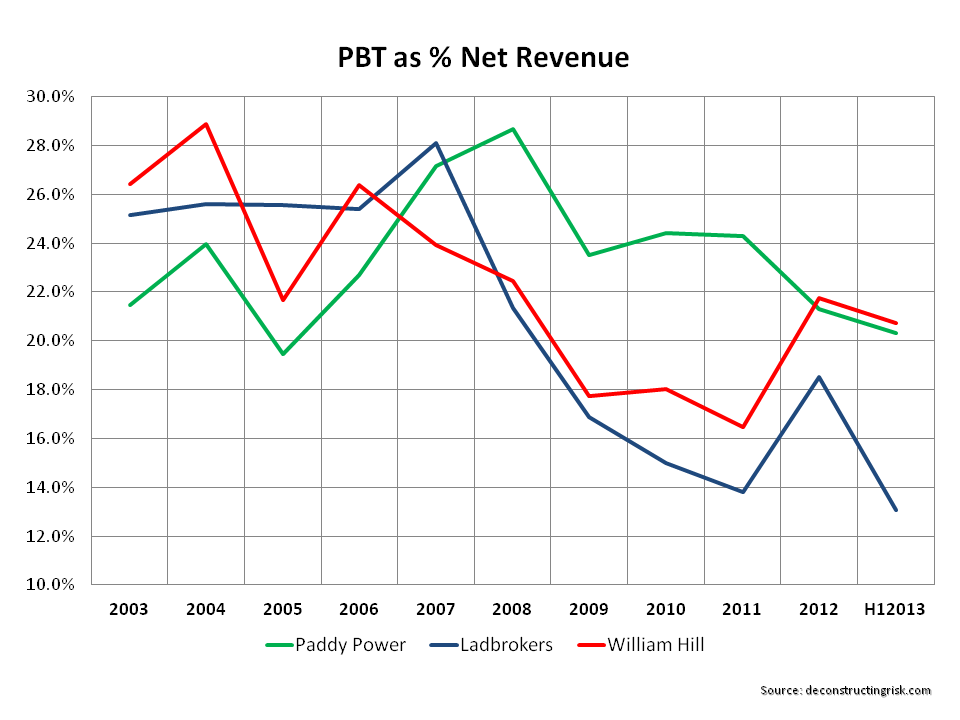
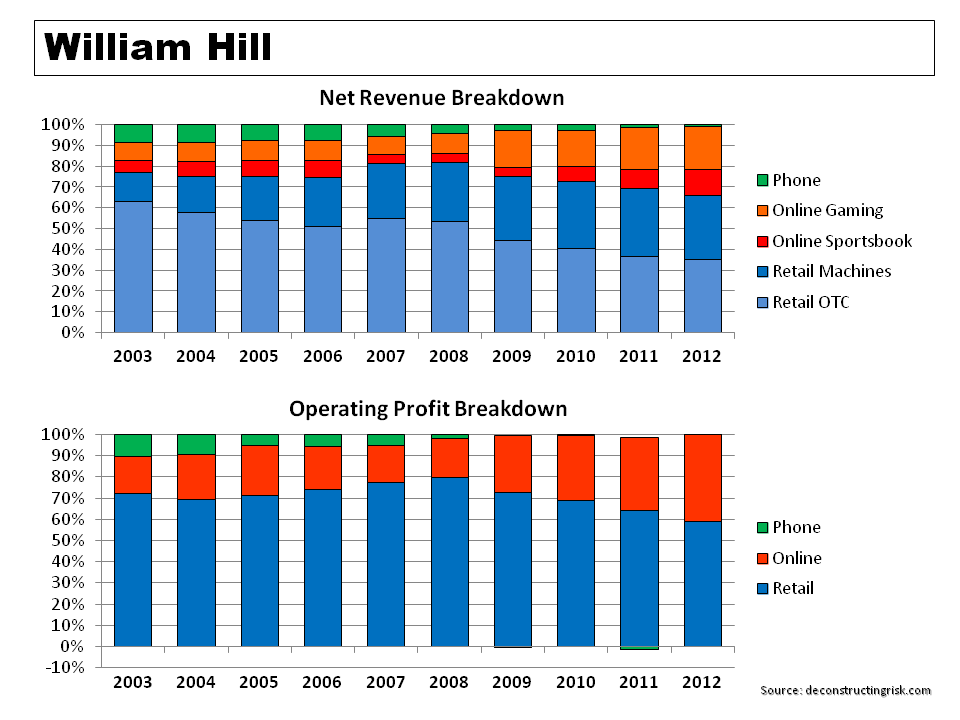
The performance of William Hill, with its over-reliance on retail, shows how far that business model must adapt to regain some of its former glory. 888, always the bridesmaid in the M&A dance of recent years, announced in June a 34% increase in average daily revenue in the year to date and boasted that it expected to beat EBITDA estimates for 2020 by a significant amount. In July, GVC announced a 30% H1 increase in online gaming and a 5% increase in online sports. For Q1, Flutter, which has been the focus of my posts in the past, initially announced approx. 30% growth in quarterly revenues up until the 15th of March with a dramatic fall off thereafter. In May, Flutter announced results to the 17th of May which showed extraordinarily strong gaming results and strong US and Australian performance. In late August, we will get a chance to see the H1 results of the newly merged entity in all its hoped for glory.

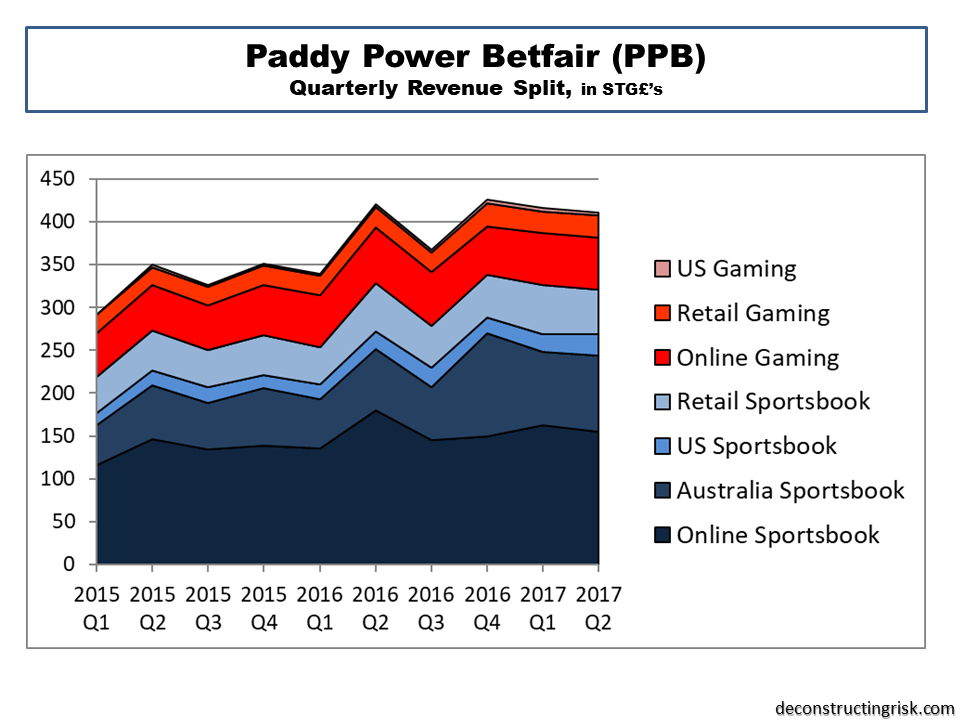
Projecting the short term in this pandemic environment is fraught with danger. Uncertainties relating to how the health situation develops, whether there will be more shut-downs or more openings, a second spike, whether government wage supports will be tempered, how defaults will progress are all subjects of daily discussion across the media. Notwithstanding these uncertainties, I have attempted to do a very rough and ready projection for the newly merged Flutter entity with the overarching assumption that gaming will remain strong, but not as extraordinary as the partial May figures, for the rest of 2020 (as will the US and Australia) but will pull back in 2021 as economies open back up and the full force of the recession and the COVID19 bills become reality. Offsetting the pull-back in 2021 of gaming is the opening of retail (albeit at a lower level than pre-COIVD) and the return of sports betting to a more normal level. The US is projected to continue its march forward in 2021. For my projections, the international and UK business of TSG is allocated to the online gaming and online sports lines as per the historical TSG breakdowns. The Australian business of Flutter and TSG is shown together.

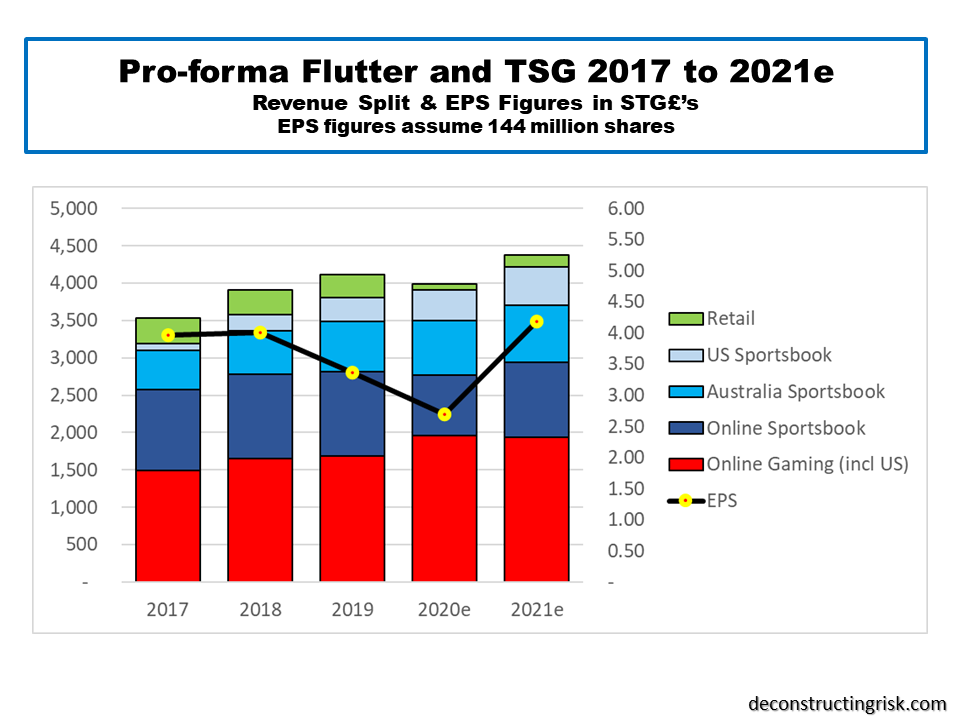
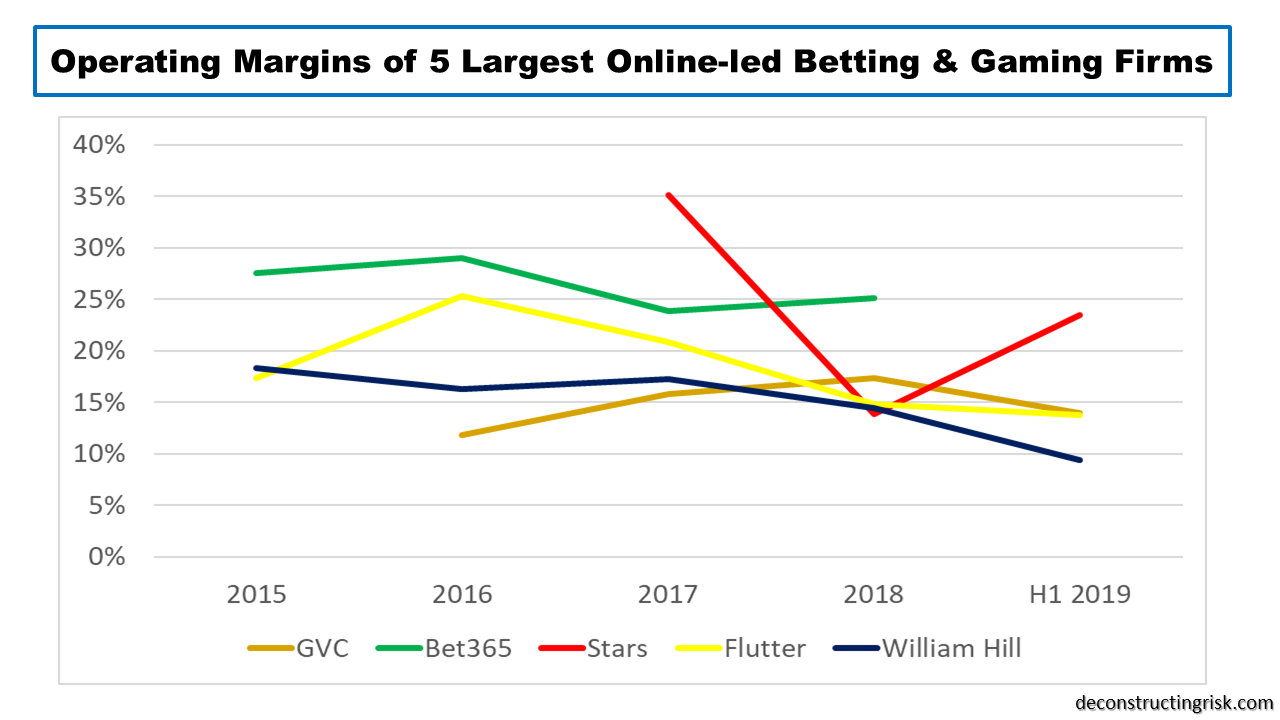
I would again emphasize that my figures are rough guesstimates, particularly the operating results. Although the presentation released at the time of the merger announcement used 2018 figures, I looked through the updated prospectus from March which used 2019 figures and made my COVID adjustments for 2020 based upon trends to date and assumed impacts upon margins. For example, the merger presentation touted EBITDA margins of 30% and above for the future whereas I have assumed the 30% EBITDA margin in 2018 for the combined entity falls to 27%, 25% and 28% for 2019 to 2021 respectively.

The big difference in the business model of the newly merged entity is the amount of debt it is carrying now. I have assumed net debt of £3.85 billion at the end of H1 2020 and a pro-forma net debt to EBITDA multiple of 3.86 and 3.12 for 2020 and 2021 respectively (assuming no debt repayments over that time, the amount of which will depend upon whether they restart dividends). Their stated target to get below 2 quickly (e.g. by end 2022 or 2023 at the latest) looks very achievable given the highly cash generative nature of this business.

My proforma EPS estimates, based upon 144 million shares, is £2.70 and £4.19 for 2020 and 2021 respectively. The 2020 figure is marginally below their stated 150% uplift of the pre-merger 2019 EPS but not materially so given the COVID impact. On a forward PE basis, the stock currently trades at a 27.5 multiple of the 2021 EPS which is not out of line with the current market sentiment. Better growth than I have assumed for the remainder of 2020 and into 2021, the potential for the US business, and future synergies from the merger could justify such a premium rating. For me, cautious as ever and soooo remarkable bad at market timing, I would need to see more on the 2020 trends and a pull-back to be tempted out of my bear pit. I’ll leave it up to you, dear reader, to make your own mind up.

UPDATED H1 NUMBERS

On the 27 August, Flutter released their H1 figures and gave further insight into how 2020 may develop. I did highlight that my figures above were rough guesstimates and the actual H1 numbers showed that I got a few items wrong. First off, I missed the impact of the May 2020 equity raise which means net debt as at the end of H1 was £2.9 billion rather than the £3.85 billion I estimated. Also, share count at the end of H1 was 157 million rather than the 144 million as a result of the equity raise. Secondly, the H1 proforma revenue came in at £2.4 billion, making my FY2020 revenue estimate of £4 billion look light (ditto for 2020 earnings).

The H1 report also contained specifics on the one-off nature of items like poker revenue and net revenue margins, as below.

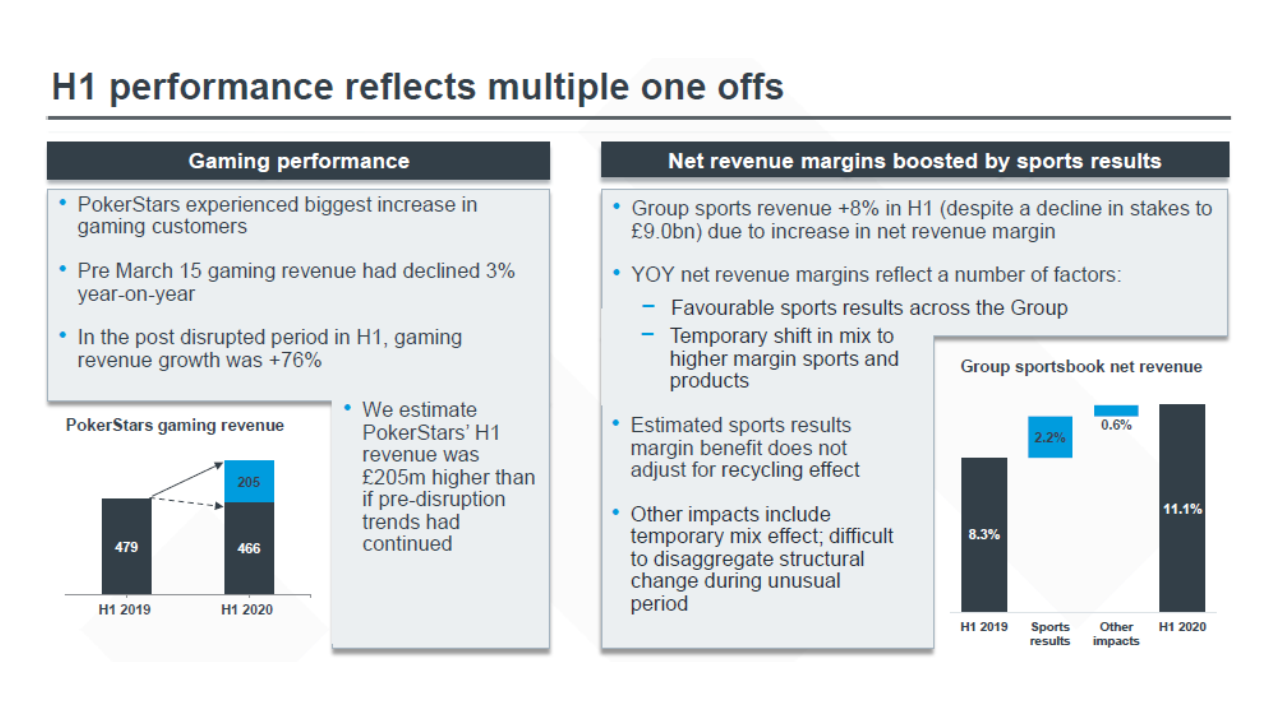
The report also shows the extraordinary trends from the height of lock-downs in certain sports and gaming categories, as below.

Guidance also highlighted the need to invest in the poker business and, as a result of heightened spending on items like marketing, the reduction in historical EBITDA margins of over 50% going forward. Based upon the pro-forma 2019 and H1 2020 results, my new projections on a half yearly basis are below.

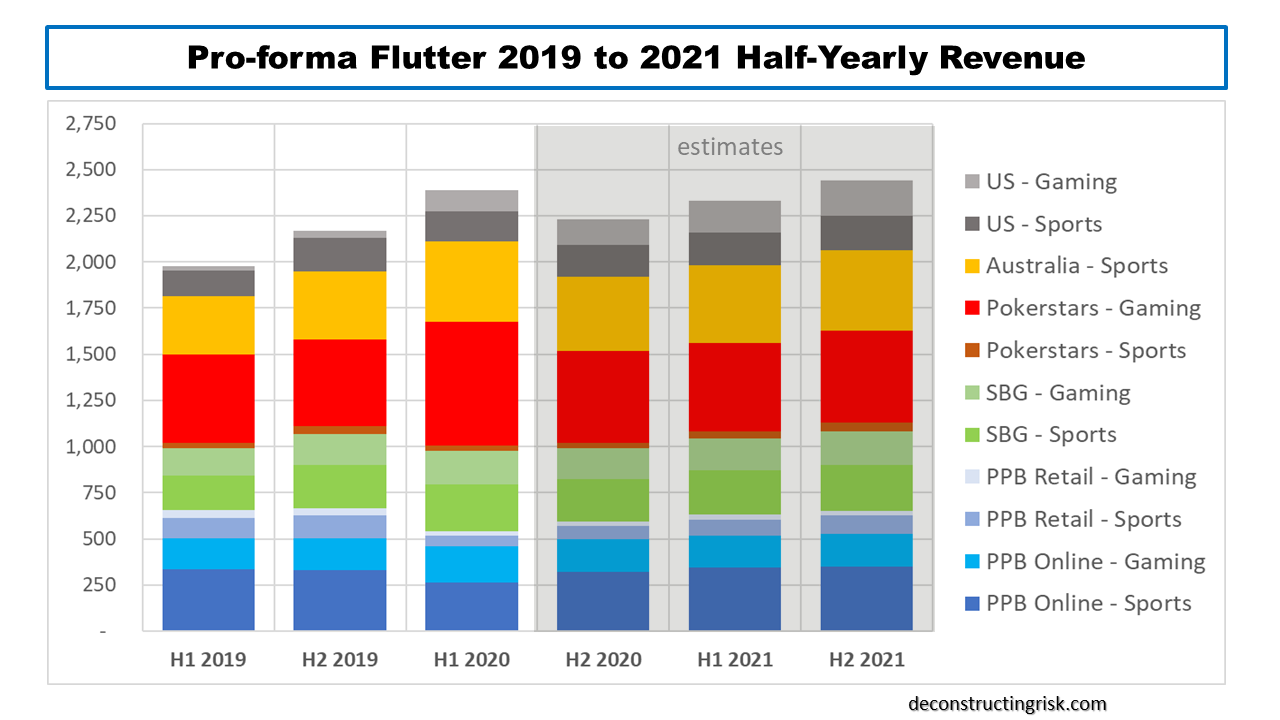
I estimate that, even with tailwinds in 2020 such as the rescheduled UEFA 2021 Euro soccer tournament, 2021 revenue at £4.8 billion will only be marginally above my new 2020 revenue estimate of £4.6 billion. This assumes sporting events in 2021 return to a semblance of normality! I also estimate that EBITDA (excluding the US) in 2021 will be roughly equal to the 2020 mid guidance of £1.25 billion.

My new estimate of adjusted EPS for 2021 (excluding any SDI impact) is £5.00 which puts the current market valuation at 25 times the 2021 adjusted EPS. There is however a lot of uncertainty around that figure (not least that my estimates are way off base again!). It looks like it will take at least another few quarters before the combined business will stabilize into a more predictable pattern.

Betting Battles

The sports betting and online gaming sector is going through transformative times. Firms like William Hill (WMH.L), GVC (GVC.L) and Flutter (FLTR.L), the new name for Paddy Power Betfair, are grappling with greater regulatory restrictions, more taxes, and the need to be seen to take the issue of problem gambling seriously (some of which are outlined in this previous post). Many of these issues are having a direct impact on revenues and margins. At the same time, they are trying to build a presence in the newly opened US gambling market. The exhibit below, from a recent GVC presentation, shows the players by revenues, both in the physical and the online market.

click to enlarge

A look at the operating margins of these firms show the impact on profits for the largest firms, with the pure online players Bet365 and The Stars looking the most lucrative (although it will be interesting to see the results for Bet365 to March 2019 when they are released in November).

click to enlarge

The future size of the US market is impossible to forecast, although all the firms are highlighting the potential. As per this post (when I had time to do proper research for my posts!!), its unlikely that the US market when it matures will be as profitable as the European or Australian markets. As Flutter/Paddy Power Betfair is the best public firm in the sector (Bet365 is private) and the one I am most familiar with, and have posted on many times (here, here and here for example), I had a shot at estimating the results to 2020 and came up with an EPS of £3.54 for 2020 compared to just over £3.00 for 2019, as below. These estimates are very rough and ready, based primarily upon a doubling of US revenues and a reduction of EBITDA losses in the US to £20 million in 2020 from £55 million in 2019.

click to enlarge

Based upon today’s price, I estimate a PE ratio for Flutter (hate the name by the way) for 2019 and 2020 of 22 and 18.8 based upon the EPS estimates above. Given the risks in these business models and the uncertainties over the development of the US market (plus my negative macro outlook), that’s still too rich for my liking. For others, given there was takeover rumours a few months ago in this ever-changing sector, it may be worth the gamble.

Paddy Purgatory

The last time I posted on Paddy Power Betfair (PPB.L) in March, I highlighted the rich valuation and cautioned better value may be had on future dips, ending with the comment that “the game of speculation is all about getting the best odds”. Well, PPB.L has been on quite a ride in recent months. First the prospect of disappointing operating results put the stock under pressure and last week the bombshell that the golden boy CEO, Breon Corcoran, wants to do something more meaningful with his time. The result, as can be seen below, is PPB.L down 15% since the start of the year and 20% since this time last year.

click to enlarge

The revenue for the latest quarter, even after adjusting for the lack of the Euro soccer tournament in 2016, disappointed analysts who are fretting about whether reduced net revenue margins are part of a trend.

click to enlarge

Despite the firm putting reduced net revenue margins primarily down to unfavourable sports results (increased promotion costs also contributed, doing things like paying out on Hilary Clinton prior to the actual election results doesn’t help!), the worry is that competitive pressures rather than bad luck are resulting in reduced net revenue and gross win margins. [Net revenues are gross wins less VAT and fair-value adjustments for free bets, promotions and bonuses]. Care needs to be taken when comparing gross win margins (i.e. gross win divided by amounts staked) and net revenue margins across firms as the make-up of the underlying portfolio is important (e.g. gross wins varies by sport type such as football, horses, tennis, etc and by geography) and firms may account for certain items differently. Also, the absence of the largest online player, the privately owned Bet365, makes industry analysis difficult for amateurs like me.

click to enlarge

Of course, this sector is haunted by regulatory risk. The predicted restrictions of the highly addictive gaming machines by the UK Government is expected to impact PPB’s high street competitors much more that PPB.L. For example, PPB.L only derives 6% of its revenue from gaming machines compared to 30% for William Hill. The reaction of PPB’s competitors to compensate for restrictions on gaming machine revenue is likely to have a bigger potential impact on PPB.L’s future results.

For me, the biggest disappointment in the Q2 results wasn’t the revenue line but the operating margins. The full year 2017 EBITDA projection was nearly 10% shy of my estimates. The firm acknowledged that the platform integration has been taking longer than planned and took up over 70% of internal technology resources in Q2. This is projected to reduce to 60% and 30% in Q3 and Q4 respectively before been completed by year end. Releasing these resources will allow a refocus on product development and on fixing other problem areas such as their online gaming offerings. As a result of the Q2 results, I have taken a knife to my earnings estimates (my revenue estimates only required minor adjustment) for 2017 and 2018, as the graphic below shows.

click to enlarge

My 2017 and 2018 EPS estimates have reduced to £3.72 and £4.01 respectively, down 10% and 12% from my previous estimates. That puts PPB.L’s current market cap at a PE of approximately 20 and 18 for 2017 and 2018. That’s not bad for a firm with EPS growth of 13% and 8% for 2017 and 2018 respectively although, if these figures turn out to be accurate, the share price is likely to have gone lower that it currently is on worries about reducing operating metrics in a fiercely competitive market.

These estimates are conservative in my view, possibly overtly so. They reflect a sense that Breon Corcoran’s reason to go off into the tech sunset now is really due to concerns about the medium-to-long term prospects for the sector. Corcoran obviously has put a different explanation forward, one which is suspiciously unconvincing given the amount left undone at PPB.L, although he still does have about £40 million of share options in PPB.L. No firm is simply about the CEO and at the end of the conference call an indication was given of ensuring more exposure to the full management team in future investor engagements. That should help investors get more comfortable with management depth at the firm. I know nothing about the new CEO, Peter Jackson, so he has a real challenge in gaining investor’s confidence. He has big boots to fill as far as investors are concerned.

So, yet again, I suggest the best course of action is to wait, both for existing and new shareholders, and see how 2017 develops for PPB.L. There can be little doubt that recent events mean that the odds on PPB.L have lengthened.

PS- PPB have already paid out on Floyd Mayweather prior to his 26th of August fight with Conor McGregor. In the unlikely event that the Irishman does achieve the impossible PPB’s Q3 net revenue margins will suffer……

More musings on the online gambling sector

A previous post on Paddy Power, William Hill and Ladbrokes showed how online sportsbook and gaming revenue are becoming an important part of the revenues of these firms. Another recent post on Betfair showed a similar import. This post will focus on the online gaming (which is a gentlier word used in the sector for what is more aptly described as online gambling) part of the equation.

As a recap, the graph below shows the online gaming revenues from Paddy Power, William Hill, Ladbrokes and Betfair (with PP converted to sterling at today’s rate) which make up 17%, 16%, 8% and 17% of their 2013 revenues respectively. Ladbrokes has approximately half the amount of its competitors. The considerable growth in William Hill’s online gaming (mainly casino) revenue after the creation of WH Online (WHO) in 2008 can clearly be seen. H2 Gambling Capital are forecasting an approximate 9% annual growth in online gaming gross win figures over the next few years

click to enlargeNet Gaming Revenue

None of the firms above split out their operating margins for the online gaming sectors. As casino is the dominant source of revenue for many of the firms, it is interesting to look at a diminutive online casino firm called 32Red, as per the graph below. Although 32Red is relatively small, the reduction in its margin to an average of 6% suggests that competition has pushed margins down in this business.

click to enlarge32Red Operating Metrics

Another two public firms that have a majority of their business in online gaming are 888 and BWIN. 888 is a well established player, particularly in the online casino market, with 40% of revenues in the UK and 40% in the rest of Europe in 2013, and it has been rebuilding its profit margins in recent years. 888’s operating metrics are summarized in the graph below.

click to enlarge888 Operating Metrics

BWIN, following its merger with PartyGaming in 2011, has a higher revenue base across Europe (excluding UK) making up approx 70% of 2013 revenues (25% from Germany) with only 10% from the UK. After some poor results and pressure from shareholders, BWIN is currently cutting its expense base by €30 million or approx 5.5% and is looked at ways it “can increase shareholder value”. BWIN’s operating metrics are summarized in the graph below.

click to enlargeBWIN Operating Metrics

The share performance of these firms has been distinctly mixed in recent years with little old 32Red blowing the others away, as per the graph below. BWIN has clearly underperformed and may likely be broken up. Analysts have speculated that a number of potential bidders, including William Hill and Paddy Power, are looking at various BWIN assets. Janus Capital Management has being building its stake in BWIN over recent months to 11% as at mid-July.

click to enlargeShare price since 2011 888 BWIN 32Red

Comparing the mainly online gaming firms with their more established betting firms in terms of the PBT margin shows the trend for both is downwards, as per the graph below. Headwinds include increased regulation and taxes such as the proposed UK POC tax. Opportunities include the explosion in mobile gambling, the slow re-opening of the US market (although I am sure established US bricks and mortar gambling firms will fight hard for their turf), new product development such as social gaming and the expected market consolidation. Amaya’s recent purchase of PokerStars has focussed minds on what will be needed to succeed in the US.

click to enlarge2003 to 2013 PBT Margin Betting & Online Gaming Firms

One of the more colourful firms in the sector, Playtech, has some interesting things to say about where the future is leading. On increased regulation, Playtech say that “the regulation of online gambling can be a catalyst for market growth, depending on how regulation is introduced, what product verticals the regulator allows and the tax rate applied” and that ”opportunities exist as markets move from a ‘dot.com’ to a ‘dot.national’ regime, although some uncertainties through the transition period are expected”.

Specifically on the UK, Playtech commented that “many smaller operators are understood to generate operating margins lower than the expected tax rate of 15% and in the view of industry experts, will struggle to compete. Larger operators can rely on economies of scale and their leading brands to remain competitive. Analysts expect that in 2015 the UK market will undergo significant change led by consolidation, as those operators with the strongest brands, best technology and means to invest in marketing will prevail”.

Playtech is a software gaming firm which offers a fully integrated platform across games and sports-betting called IMS that many of the main players use (licensees include Betfair, bet365, William Hill, Paddy Power and Sky, amongst others). They also run a white label turn-key operation called PTTS and a joint venture business. Their most well known joint venture was one where they very successfully partnered with William Hill in 2008 in the creation of William Hill Online (WHO). William Hill recently bought out Playtech of their 29% stake for £424 million. In March 2013, Playtech entered into a deal with Ladbrokes (in an attempt by Ladbrokes to diversify their business and catch up with their competitors – see first paragraph of this post) where, according to Morgan Stanley, Playtech “has effectively been given a quasi-equity stake, where it will “own” 27.5% of any increase in profits”. A Morgan Stanley report, although over a year old, has more interesting background on Playtech (they are still hot on the stock). The graph below highlights some of the metrics behind Playtech.

click to enlargePlaytech Revenues and PBT Margin 2009 to 2013

Much of the colour behind the firm has been provided by its 40 year old Israeli playboy founder, Teddy Sagi, who has a bribery and insider trading conviction from his youth in the 1990s. Playtech bought many of the assets used in the WHO 2008 deal from Sagi and also the PTTS assets (70% of this business is from Imperial e-Club licensed in Antigua and Barbuda!) in 2011 which caused concerns about conflicts of interest. Concern over such conflicts on what Playtech may do with its new cash pile from the WHO sale (they returned £100 million in a special dividend earlier this year but still have £376 million in cash as at end Q1) and on potential problems that Sagi’s ownership position may do in gaining access to the US resulted in an offering in March this year which reduced his 49% stake to 34%.

Playtech has stated that their “the Board is seeking transformational M&A opportunities to take the business to the next level.” Although it’s a bit too colourful for me, a number of analysts estimate a 20%+ upside on its current share price and it’s interesting to note that David Einhorn’s Greenlight Capital is a believer with an ownership of 3.8%. That, I think, is a good place to end a post on gambling!

A look over some bookmakers’ books

I have been doing some digging into the dynamics of betting exchanges, the largest and best known of which is BetFair. The betting and gaming sector itself has been the subject of a mountain of academic research, there is even a journal dedicated to it! Quants have moved in and are actively pitting their algorithms against human gambling behaviour on the exchanges. A recent intriguing Bloomberg article on tennis betting illustrates some strategies now common in the marketplace.

Technology has driven disruptive disintermediation across many sectors such as the travel & airline industry and more recently across the retail sector. There was a fascinating documentary on the BBC by Robert Preston late last year on the UK retail sector which concluded that the future for many clothing retail outlets would be to act like galleries for consumers to peruse items with the ultimate purchase decision being made online.

The betting and gaming sector is one undergoing structural changes due to the massive increase in online activity. Additional competitive threats from disintermediated business models such as betting exchange pose interesting questions for the sector. Such structural market changes may be useful in understanding the impact of new business models in other sectors such as financial services –  peer to peer (P2P) lending in banking or the ILS market in insurance come to mind. On the growing P2P lending sector, there was an article on the front page of Friday’s FT on how a UK developer sourced £4 million of debt through online P2P platform Lendinvest which may prove to be defining moment of change. On the impact of the ILS market, there was another interesting FT article that contended that the ILS market is resulting in structural changes in a market with “a lot of excessive overhead, ie highly paid staff, that can be eliminated”.

Before looking deeper into structural changes in the betting and gaming sector, I needed to understand the “traditional” betting market better. Besides the odd poker tournament (with real people), I am not a gambler and therefore not a user of the services provided by betting firms. I know enough that the odds are obviously in the bookies favour but I know very little about the economics of the betting industry. As such, this post details my research on the UK betting industry. A follow on post will go into the broader picture and some (likely rambling) thoughts on the impact of structural changes from betting exchanges like Betfair.

So, I concentrated on the UK market where data is freely available. The graphic below outlines the size of the UK betting and gaming market with the main providers. The market is split by revenue approx 60% retail and 40% online. The retail market is split approx 50:50 between over the counter betting at shops and gaming on machines (aka fixed odds betting terminals or FOBTs). On the online side, sports betting (commonly referred to as the Sportsbook) is approx 40% with gaming making up the remainder, led by casino (approx 30%), poker and bingo (approx 15% each).

click to enlargeUK Gambling Market Size

The main players on the retail side stress the advantages of their multi-access models and, to counter the impression that retail betting shops attach the older demographic, cite statistics that show even younger customers often use retail outlets (more and more in combination with online and mobile).

The gaming machine/FOBT sector has come under renewed focus recently. Derek Webb, a successful gambler, is one of the principles behind the Campaign for Fairer Gambling and has described the machines as “crack cocaine”. Campaigners point to the rapid rise in revenue from FOBT, which were only widely introduced in the early 2000s, the addictive nature of the machines and that users are high frequency gamblers with a concentration amongst younger men with low incomes. Bookies point to the high payouts (the margin taken by the bookmaker is generally about 3% to 4% of the amount staked whereby such margin is referred to as the gross win) and the importance of machines supporting the retail shop model (I estimate that FOBT can contribute 70% to 80% of retail operating profits). Political pressure is mounting to restrict the amount that can be bet on the machines and JP Morgan recently cut its rating on Ladbrokes and William Hill saying that the likely change “could make the bottom 20pc of Ladbrokes and William Hill shops loss-making, with a further 20pc only marginally profitable, and require significant restructuring to close shops in order to cut costs.

I selected Ladbrokes, William Hill and Paddy Power as firms to do some deeper analysis. William Hill and Ladbrokes are long established firms, particularly in the retail sector. William Hill is also the market leader in the online sector with a particular strength in online casino gaming. Paddy Power is the new kid on the block growing aggressively in online, particularly over the past 5 years, from its Irish base into the fourth largest in the online sector. Size wise, William Hill and Ladbrokes had revenue of £1.3 billion and £1 billion in 2012 respectively while Paddy Power had 2012 revenue of €650 million (approx £570 million). It would have been interesting to have a deeper look at the online only Bet365, which was founded in 2000 by Denise Coates and is now the number 2 in the UK online market with over £200 million in revenue, but unfortunately Bet365 is private. The graph below shows the share price moves of the selected firms since 2009.

click to enlargeShare Price William Hill Ladbrokes Paddy Power

The graph below shows the profit before tax margins of the firms since 2003. As can be seen, profit margins have been under pressure, particularly for Ladbrokes in recent years.

click to enlargePBT % William Hill Ladbrokes Paddy Power

Revenue and operating profit breakdown for William Hill is below.

click to enlargeWilliam Hill Revenue & Operating Profit Breakdown

Revenue and operating profit breakdown for Ladbrokes is below.

click to enlargeLadbrokes Revenue & Operating Profit Breakdown

Revenue and operating profit breakdown for Paddy Power is below.

click to enlargePaddy Power Revenue & Operating Profit Breakdown

As mentioned above, the percentage that a bookmaker takes as a margin in each business is called the gross win (another commonly used term is the overround which refers to the excess above the sum of the odds). Net revenues are gross wins less VAT and fair-value adjustments for free bets, promotions and bonuses. Care needs to be taken when comparing gross win percentages (i.e. gross win divided by amounts staked) across firms as the make-up of the underlying books is important (gross wins varies by sport type such as football, horses, tennis, etc and by geography). Also items such as betting levies and charges vary and some are not deducted in the gross win to net revenue calculations but rather in operating expenses. Items such as the new UK point of consumption (POC) tax that is due to be introduced later this year also need to be understood in their potential accounting treatment. The graph below compares the reported gross win percentages amongst the firms in the retail over the counter (OTC) business and in the online Sportsbook businesses for the firms.

click to enlargeGross Win Percentage

I have found it difficult to get metrics for the profitability of both the retail and the online gaming businesses. As discussed above on the FOBT business, the operating profit contribution from gaming can be significant. I suspect that online gaming also contributes significantly to the online operating profit although not as high as the 70% to 80% contribution that I estimated for the retail business

Online gaming is also a more cross border business and is the fastest growing segment of the gambling industry. H2 Gambling Capital, a leading supplier of data and market intelligence on the global gambling industry, puts the size of the global online gaming market at approx $30 billion. Large markets such as the US are seen as ultimately providing a massive opportunity for growth once regulatory issues are resolved. Although firms withdrew from the US in 2006 after the passing of the Unlawful Internet Gambling Enforcement Act (UIGEA), individual States such as Nevada and New Jersey are looking at ways that they can approve online gaming and challenge federal restrictions.

Although the established firms like William Hill and Ladbrokes are facing headwinds in their business with significant competition from online upstarts like Paddy Power, Bet365 and Betfair, they have size and powerful brands on their side. Both have made significant investments in IT infrastructure to support their business. The area of liability management is one that is particularly interesting. Ladbrokes, for example, has made significant investment in enhancing their trading abilities through the development of Morse, their own algorithmic robot. They cite the use of Morse in improving pricing which is particular important in the growing bet in play (BIP) market, as the exhibit shows.

click to enlargeLadbrokes Pricing & Trading Exhibit 2012 Investor Day

They also cite the use of such active liability management tools in improving outcomes such as the Royal Ascot results below.

click to enlargeLadbrokes Liability Management Exhibit 2012 Investor Day

Changes in the whole betting and gaming sector have been rapidly evolving over recent years. These changes and the impact of betting exchanges will be the subject of a follow on post with some further musings in the coming weeks.