
Nassim Nicholas Taleb, the dark knight or rather the black swan himself, said that “anything that relies on correlation is charlatanism”. I am currently reading the excellent “The signal and the noise” by Nate Silver. In Chapter 1 of the book he has a nice piece on CDOs as an example of a “catastrophic failure of prediction” where he points to certain CDO AAA tranches which were rated on an assumption of a 0.12% default rate and which eventually resulted in an actual rate of 28%, an error factor of over 200 times!.
Silver cites a simplified CDO example of 5 risks used by his friend Anil Kashyap in the University of Chicago to demonstrate the difference in default rate if the 5 risks are assumed to be totally independent and dependent. It got me thinking as to how such a simplified example could illustrate the impact of applied correlation assumptions. Correlation between core variables are critical to many financial models and are commonly used in most credit models and will be a core feature in insurance internal models (which under Solvency II will be used to calculate a firms own regulatory solvency requirements).
So I set up a simple model (all of my models are generally so) of 5 risks and looked at the impact of varying correlation from 100% to 0% (i.e. totally dependent to independent) between each risk. The model assumes a 20% probability of default for each risk and the results, based upon 250,000 simulations, are presented in the graph below. What it does show is that even at a high level of correlation (e.g. 90%) the impact is considerable.
click to enlarge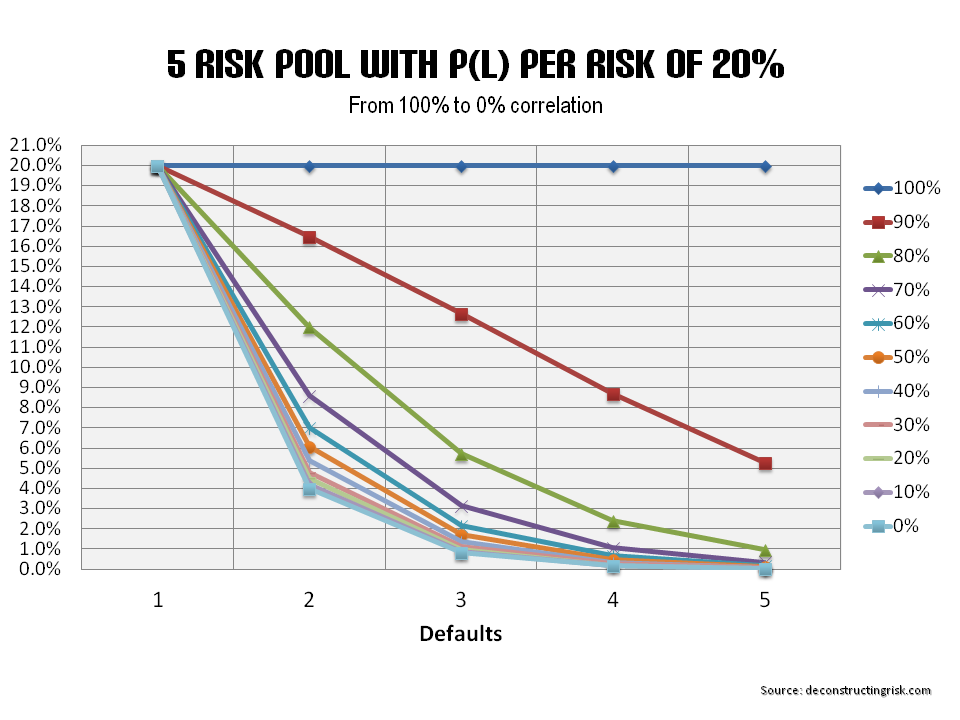
The graph below shows the default probabilities as a percentage of the totally dependent levels (i.e 20% for each of the 5 risks). In effect it shows the level of diversification that will result from varying correlation from 0% to 100%. It underlines how misestimating correlation can confound model results.
click to enlarge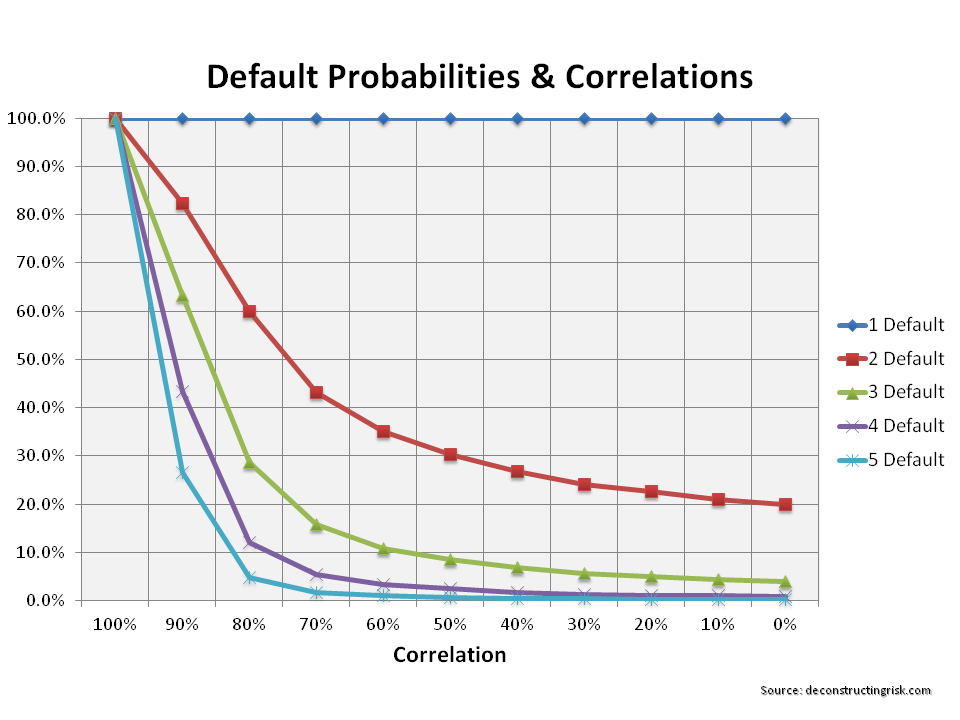

“The Signal and the Noise” really is an excellent book; a must read for anyone involved in forecasting or prediction. “Risk Intelligence” by Dylan Evans has a lot of similar themes, but comes at it from a different direction
Thanks Dee
Do you have some colour what kind of CDO it was ? My bet is a CDO of ABS. Most people back then knew (or should have known) that correlations between AAA tranches or similar stuff are way high than correlations between corporates. Which leads to higher PDs once pooh hits the fan…
I’ve become a bit wary everytime I read something about CDOs and “failures of prediction” or “failures of models”. Most of the time it was more fuss than substance.
My 2 bps.
Eddie
Hi Eddie,
Good to hear from you, hope you are not too busy. Silver cites an S&P report on CDO defaults called Default, Transition, and Recovery: A Global Cross-Asset Report Card Of Ratings Performance In Times Of Stress from 2010. The 28% comes from a heading of I year structured finance CDO defaults
http://www.standardandpoors.com/products-services/articles/en/us/?assetID=1245214438884
He also refers to a paper by Anna Katherine Barnett-Hart called The Story of the CDO Market Meltdown that has the default rates a lot higher!!
Click to access 2009-CDOmeltdown.pdf
I hear what you say on commentary on cos!
Keep commenting, I was getting lonely!.
M
Thanks Mozoz, I will have a look anytime soon.
Yeah, it’s been busy lately. Besides I want to post something meaningful and no crap which is kinda tricky if my head is fully of other stuff :-). I hope I can be more active going forward.
Btw, I left a comment in the AIG @ 50$ thread. I think I can explain some of the points you mentioned, probably not all, but I had to take a good look at the 10-K. Dunno whether they didn’t highlight it for a reason or whether this was just coincidence. And pls ignore the first one I made, this was during a period when I was quite busy (the quality was as expected).
Eddie
Ok, I think I see clearer now. Let’s go through it in the order you laid out.
Chart 1 in the S&P document (bottom left chart) shows a 1 year default rate of a bit more than 6% for AAA Structured Finance (SF) CDOs. Chart 2 shows in the same corner the 28% for a 5 years period. Which is ok, I would have expected a higher figure (in corporate land you would have a factor of 10 between the 1 year and the 5 year default rate),
Now 6% 1 y default rate for a “AAA” *ahem* asset is bad enough but not as bad as the headline figure. The problem is that Structured Finance assets, ie ABS tranches are way higher correlated than coporate CDS or bonds. Think about it: you have a pool of pretty risk remote assets, AAA RMBS tranches for example. If is unlikely that you loose money since it needs a market meltdown to touch that tranche. But once that happens probably a lot more tranches are affected in the same way. Thus higher correlations. High correlations are bad for senior tranches (ie AAAs) since you only loose money if many defaults happen at the same time… oooops. If you look at the two charts you see that the effect if quite muted across the capital structure, ie lower rated tranches won’t get hit that hard (or even become more of a well-paid coinflip like the BBs and Bs over 5 years).
I think the Barnett-Hart paper talks mainly about subprime CDO of ABS and similar structures (I read it several years ago). Funny enough nobody mentiones CLOs for example (spoiler alert: CLO AAAs experienced almost no credit losses over the last couple of years). Year, the collateral was crap and the potentially too optimistic model assumptions didn’t help either. On the other hand you had to click only once to see that the expected (1 year I think) default rate for a AAA CDO tranche was about 10 times higher than the default rate of a comparable corporate bond. The facts were there in plain sight. But you had to open your eyes…
Best,
Eddie
Thanks Eddie, I see what you mean by the 6% versus 28%, that’s a bit misleading from Silver, his point is still valid given the 6% versus the 0.12% when rated but its not as dramatic, 50 times wrong rather than 200!.
I had heard that some CLOs performed quite well, is there anything you’d recommend to read on performance of CLOs?
M
Re CLOs I would look at the rating agencies’ homepages. You need to register, but it is free and comes with bells and whistles attached.
I didn’t look explicitly but I remember there are some performance reports, at least rating-wise. Which should give you an idea regarding performance. The usual path was AAA – BBB – AA or even AAA because the tranches suffered minimal losses if at all. CLOs are usually managed (I don’t think that there are many so-called static CLOs around anymore) so the manager might also make a difference. But otoh most CDOs I have seen were managed, too.
I will see whether I can dig up somehting further.
Eddie
Re 6% vs 28%: I see your point. Fully agreed that the performance leaves a lot to be desired. It just cracks me up if people abuse numbers to make an even more sensational point about some fact that has been around for years (at least in the industry).
Eddie