Tag Archives: valuation multiples

Peak Earnings?

With the S&P500 down 9% off its high this month after last week, the question everybody is asking is whether this is a buying opportunity or the beginning of a new phase in the market. I have no idea. Nobody really does. I suspect this week will be bumpy but will rally off Fridays’ lows as there is some cheap names who have been hit hard. I have been modestly dipping my toe in on some names but am waiting before making any big moves. I hope to post on a few of the stocks regularly mentioned in this blog in the coming weeks.

The underlying concerns about the global economy and trade, the impact of US rate increases and quantitative tightening, Italy, to name but a few, have been and continue to be real issues to consider. The fact that the market has turned on a penny and is now all worried about the issues it shrugged off a few weeks ago is, well just how markets are!

What I do know is that this bull market has all been about earnings and margin growth, nothing else matters. So, I took the latest operating EPS and sales estimates for 2019 from S&P, extrapolated them into 2020, assuming a modest slowing of the EPS growth. These operating margin figures and assumed sales figures form the basis of Scenario 1. Stressed operating margin and sales formed the basis for Scenarios 2 and 3, with Scenario 2 falling back to the 2013-17 average operating margin of 9.5% and Scenario 3 falling more severely to the 2008-18 average of 8.75%. The graph below shows the operating margin assumptions in a historical context for each scenario.

click to enlarge

Assuming a price for the S&P500 as per Friday’s close of 2,659, the EPS figures with respective trailing and future 12-month PEs are as per the graphs below.

click to enlarge

click to enlarge

click to enlarge

So, if the current operating estimates for 2019 stand up and continue into 2020 as per Scenario 1, then I would say the current dip is a buying opportunity with a forward 2019 and 2020 PE of 15 and 14 respectively. If, however, you feel that we have reached peak earnings and a modest enough EPS retrenchment over 2019 and 2020 is likely as per Scenario 2, then the current S&P500 level looks vulnerable to further downside as the implied forward PEs of 17.5 and 18.7 for 2019 and 2020 look rich in a downward trending EPS environment. If, as per Scenario 3, the EPS retrenchment is more severe, then we are in for a very bumpy ride with another 15% to 25% downside possible.

To state the obvious, the current market focus is all about the earnings outlook for 2019 and 2020. The mid-terms over the next few weeks will be another factor to consider. It will be interesting to see if the market focus moves away from the economic prospects over the next few years and more towards 2018 bonuses and end of year window dressing as this quarter progresses!

Broken Record II

As the S&P500 hit an intraday all-time high yesterday, it’s been nearly 9 months since I posted on the valuation of the S&P500 (here). Since then, I have touched on factors like the reversal of global QE flows by Central Banks (here) and the lax credit terms that may be exposed by tightening monetary conditions (here). Although the traditional pull back after labor day in the US hasn’t been a big feature in recent years, the market feels frothy and a pullback seems plausible. The TINA (There Is No Alternative) trade is looking distinctly tired as the bull market approaches the 3,500-day mark. So now is an opportune time to review some of the arguments on valuations.

Fortune magazine recently had an interesting summary piece on the mounting headwinds in the US which indicate that “the current economic expansion is much nearer its end than its beginning”. Higher interest rates and the uncertainty from the ongoing Trump trade squabble are obvious headwinds that have caused nervous investors to moderate slightly valuation multiples from late last year. The Fortune article points to factors like low unemployment rates and restrictions on immigration pushing up wage costs, rising oil prices, the fleeting nature of Trump’s tax cuts against the long-term impact on federal debt, high corporate debt levels (with debt to EBITDA levels at 15 years high) and the over-optimistic earnings growth estimated by analysts.

That last point may seem harsh given the 24% and 10% growth in reported quarterly EPS and revenue respectively in Q2 2018 over Q2 2017, according to Factset as at 10/08/2018. The graph below shows the quarterly reported growth projections by analysts, as per S&P Dow Jones Indices, with a fall off in quarterly growth in 2019 from the mid-20’s down to a 10-15% range, as items like the tax cuts wash out. Clearly 10-15% earnings growth in 2019 is still assuming strong earnings and has some commentators questioning whether analysts are being too optimistic given the potential headwinds outlined above.

click to enlarge

According to Factset as at 10/08/2018, the 12-month forward PE of 16.6 is around the 5-year average level and 15% above the 10-year average, as below. As at the S&P500 high on 21/08/2018, the 12-month forward PE is 16.8.

click to enlarge

In terms of the Shiller PE or the cyclically adjusted PE (PE10), the graph below shows that the current PE10 ratio of 32.65 as at the S&P500 high on 21/08/2018, which is 63% higher than 50-year average of 20. For the purists, the current PE10 is 89% above the 100-year average.

click to enlargeCAPE Shiller PE PE10 as at 21082018 S&P500 high

According to this very interesting research paper called King of the Mountain, the PE10 metric varies across different macro-economic conditions, specifically the level of real interest rates and inflation. The authors further claim that PE10 becomes a statistically significant and economically meaningful predictor of shorter-term returns under the assumption that PE10 levels mean-revert toward the levels suggested by prevailing macroeconomic conditions rather than toward long-term averages. The graph below shows the results from the research for different real yield and inflation levels, the so-called valuation mountain.

click to enlarge

At a real yield around 1% and inflation around 2%, the research suggests a median PE around 20 is reasonable. Although I know that median is not the same as mean, the 20 figure is consistent with the 50-year PE10 average. The debates on CAPE/PE10 as a valuation metric have been extensively aired in this blog (here and here are examples) and range around the use of historically applicable earnings data, adjustments around changes in accounting methodology (such as FAS 142/144 on intangible write downs), relevant time periods to reflect structural changes in the economy, changes in dividend pay-out ratios, the increased contribution of foreign earnings in US firms, and the reduced contribution of labour costs (due to low real wage inflation).

One hotly debated issue around CAPE/PE10 is the impact of the changing profit margin levels. One conservative adjustment to PE10 for changes in profit margins is the John Hussman adjusted CAPE/PE10, as below, which attempts to normalise profit margins in the metric. This metric indicates that the current market is at an all time high, above the 1920s and internet bubbles (it sure doesn’t feel like that!!). In Hussman’s most recent market commentary, he states that “we project market losses over the completion of this cycle on the order of -64% for the S&P 500 Index”.

click to enlarge

Given the technological changes in business models and structures across economic systems, I believe that assuming current profit margins “normalise” to the average is too conservative, particularly given the potential for AI and digital transformation to cut costs across a range of business models over the medium term. Based upon my crude adjustment to the PE10 for 2010 and prior, as outlined in the previous Broken Record post (i.e. adjusted to 8.5%), using US corporate profits as a % of US GDP as a proxy for profit margins, the current PE10 of 32.65 is 21% above my profit margin adjusted 50-year average of 27, as shown below.

click to enlargeCAPE Shiller PE PE10 adjusted as at 21082018 S&P500 high

So, in summary, the different ranges of overvaluation for the S&P500 at its current high are from 15% to 60%. If the 2019 estimates of 10-15% quarterly EPS growth start to look optimistic, whether through deepening trade tensions or tighter monetary policy, I could see a 10% to 15% pullback. If economic headwinds, as above, start to get serious and the prospect of a recession gets real (although these things normally come quickly as a surprise), then something more serious could be possible.

On the flipside, I struggle to see where significant upside can come from in terms of getting earnings growth in 2019 past the 10-15% range. A breakthrough in trade tensions may be possible although unlikely before the mid-term elections. All in all, the best it looks like to me in the short term is the S&P500 going sideways from here, absent a post-labor day spurt of profit taking.

But hey, my record on calling the end to this bull market has been consistently broken….

CenturyLink 2018 Preview

I don’t do this often but as I am travelling this week I thought I’d give some predictions on the Q4 announcement from CenturyLink (CTL) due after market close this Valentine’s Day. As my last post on the topic in August stated, I am taking a wait and see approach on CTL to assess whether enough progress has been made on the integration and balance sheet to safeguard the dividend. Although CTL is down 15% since my last post, the history of LVLT has taught me that extracting costs from a business with (at best) flat-lining revenue will be a volatile road over the coming quarters and years. Add in high debt loads in an increasing interest rate environment and any investment into CTL, with a medium term holding horizon, must be timed to perfection in this market.

The actual results for Q4 matter little, except to see revenue trends for the combined entity, particularly as according to their last 10Q they “expect to recognize approximately $225 million in merger-related transaction costs, including investment banker and legal fees”. They will likely kitchen sink the quarter’s results. The key will be guidance for 2018 which the new management team (e.g. the old LVLT CEO and CFO) have cautioned will only be the 2018 annual range for bottom-line metrics like EBITDA and free cashflow. Although many analysts know the LVLT management’s form, it may take a while for the wider Wall Street to get away from top line trends, particularly in the rural consumer area, and to measuring CTL primarily as a next generation enterprise communication provider.

At a recent investor conference, the CFO Sunit Patel gave some further colour on their targets. Capex would be set at 16% of revenues, the target for margin expansion is 5%-7% over the next 3 to 5 years reflected cost synergies coming into effect faster than previously indicated, and they will refocus the consumer business on higher speeds “more surgically [in terms of return on capital] in areas that have higher population densities, better socioeconomic demographics, better coexistence with businesses and where wireless infrastructure might be needed”. Based upon these targets and assuming average LIBOR of 3% and 4% for 2018 and 2019 respectively plus a flat-line annual revenue for the next 3 years (although a better revenue mix emerges), I estimate a valuation between $20 to $25 per share is justified, albeit with a lot of execution risk on achieving Sunit’s targets.

On guidance for 2018, I am hoping for EBITDA guidance around $9.25 billion and capex of $4 billion. I would be disappointed in EBITDA guidance with a lower mid-point (as would the market in my view). I also estimate cash interest expense of $2.25-$2.5 billion on net debt of $36-$36.5 billion. Dividend costs for the year should be about $2.35 billion.

Wednesday’s result will be interesting, particularly the market’s assessment of the plausibility of management’s targets for this high dividend yielding stock. There is plenty of time for this story to unfold over the coming quarters. For CTL and their people, I hope it’s not a Valentine’s Day massacre.

Follow-up after results:

I am still going through the actual results released on the 14th of February but my initial reaction is that the 2018 EBITDA guidance is a lot lower than I expected. Based upon proforma 2017 EBITDA margin of 36.1%, I factored in a more rapid margin improvement for 2018 to get to the EBITDA figure of $9.25 billion than the approximate 80 basis point improvement implied in the 2018 guidance to get to the mid-point of $8.85 billion. In response to an analyst’s question on the 5%-7% margin improvement expected over the next 3 to 5 years, Sunit responded as follows:

On the EBITDA margin, to your question, I think, in general, we continue to expect to see the EBITDA margin expand nicely over the next 3 to 5 years. I think we said even at the time of the announcement that with synergies and everything pro forma, we should be north of 40% plus EBITDA margins over the next few years and we continue to feel quite confident and comfortable with that. So I think you will see the margin expansion in terms of the basis points that you described.

I will go through the figures (and maybe the 10K) to revise my estimates and post my conclusion in the near future.

CenturyLink levelled

It’s been over 6 months since I last posted on the upcoming merger of Level 3 (LVLT) and Centurylink (CTL). Since then, LVLT’s CEO Jeff Storey has been named COO of the combined entity and CEO from January 2019, after a gentle push from activist investor Keith Meister of Corvex Management (here is an article on their latest position), effectively meaning the merger is an operational LVLT takeover of CTL. In June, CTL also got hit by a lawsuit from an ex-employer alleging a high-pressure sales culture which ripped customers off (an avalanche of class action suits followed). And, potentially more damaging, the recent results of CTL continue to point to deteriorating trends in the legacy part of their business and lackluster growth on the strategic part of the business. CTL missed their quarterly estimates again in the most recent quarter, the third miss in a row.

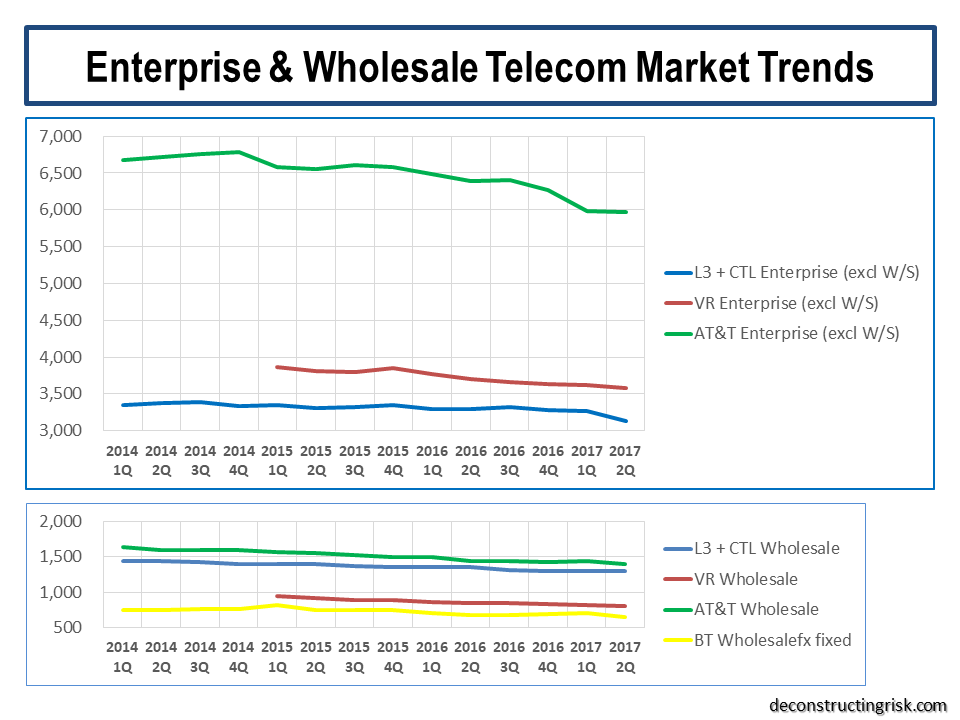
Picking up on my recent telecom industry post, the sector will struggle in the short term to find top line growth before the full impact of new “digital lifestyle” opportunities emerge. The figures below for enterprise, including public sector, and wholesale revenues for some of the biggest US players (which have been adjusted judgmentally for items such as the impact of the XO acquisition on Verizon’s revenues and the ever-changing classifications and reclassifications that telecom’s love) illustrate the current struggle in getting newer IP enabled services to fully compensate for declining legacy revenues.

click to enlarge

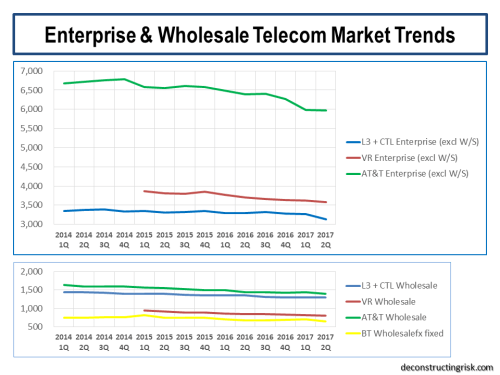
These figures imply average quarterly declines since 2014 of -0.3% and -1.2% for enterprise and wholesale business respectively. However, the trend has been getting worse. The average quarterly change was 0.2% and -1.1% for enterprise and wholesale business respectively from 2014 to 2015. Since 2016, the average quarterly change is -0.9% and -1.3% for enterprise and wholesale respectively. Not exactly a cheery trend when contemplating the prospects of a merged CTL/LVLT!

As can be seen below, the share price of LVLT and deal implied price have converged, particularly as CTL’s dividends get paid, albeit with a sharply downward bias in recent weeks over worries about dividend sustainability, valuation, sector trends, lawsuits and uncertainty over the closing date of the merger (a delay by California, the last State approval needed, may mean the end of September deadline is missed).

click to enlarge

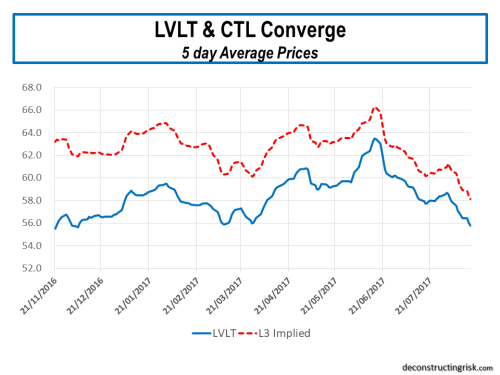
My estimates for a standalone LVLT compared to analyst figures and those presented by LVLT management in the S4 (figures presented for merger negotiations are generally on the optimistic side) are below. Even factoring in higher interest rates (about 40% of LVLT’s debt is floating) over the coming years, I am comfortable with a standalone share price around the current mid-50’s, in the unlikely event the merger falls apart.

click to enlarge

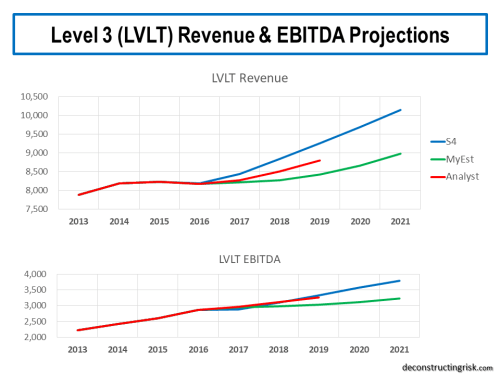
To recap on my confidence in the ability of LVLT’s current management team to deliver, the results of the last merger between LVLT and TWTC show that management delivered a 40% uplift in the amount of free cashflow (e.g. EBITDA less capex) on flat revenues from 2014 to 2017 (e.g. combined FCF of both entities in the year prior to the merger to actual H1 results and my estimates for H2 2017). Some of my many previous posts on LVLT are here, here and here. Such a repeat in FCF in the CLT/LVLT merger is not a realistic expectation given the larger scale and different business mix, as the analysis below illustrates. Of course, the flat revenues over the past 3 years is a key concern (but worthy of praise given the industry trends highlighted above) and one of the catalysts for the CLT deal. Also, the health of designate CEO Jeff Storey may also be a factor over the next few years given his heart issues a few year ago.

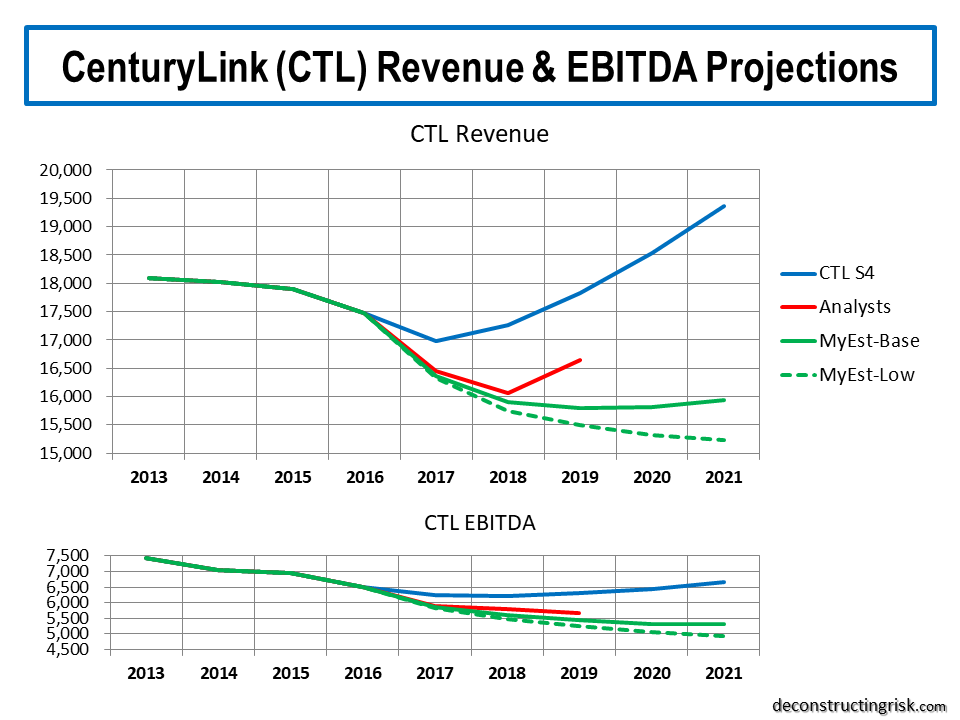
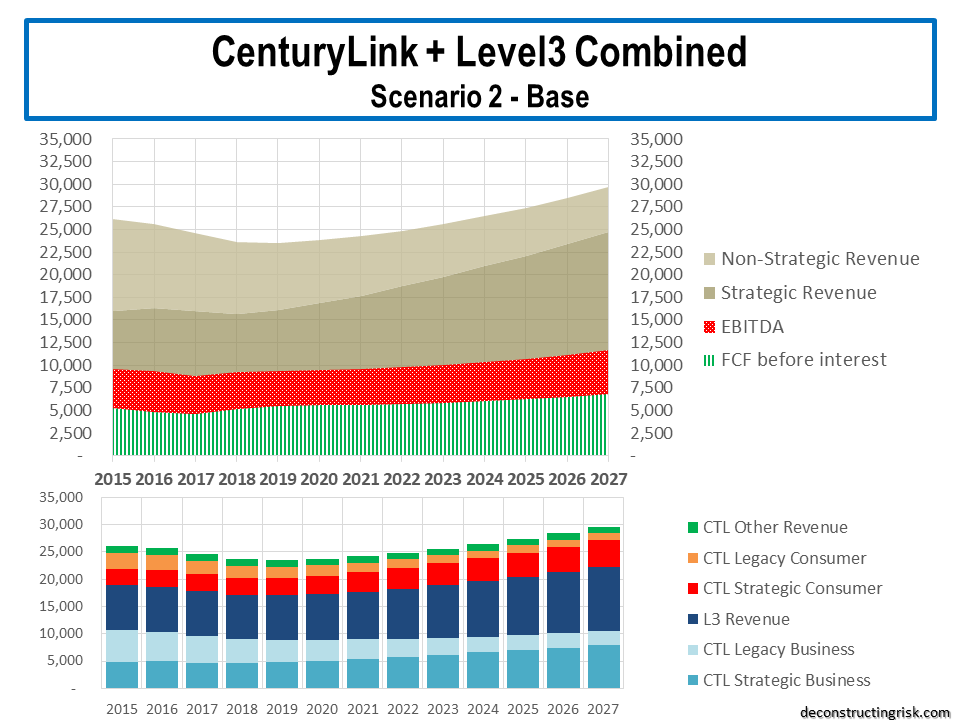
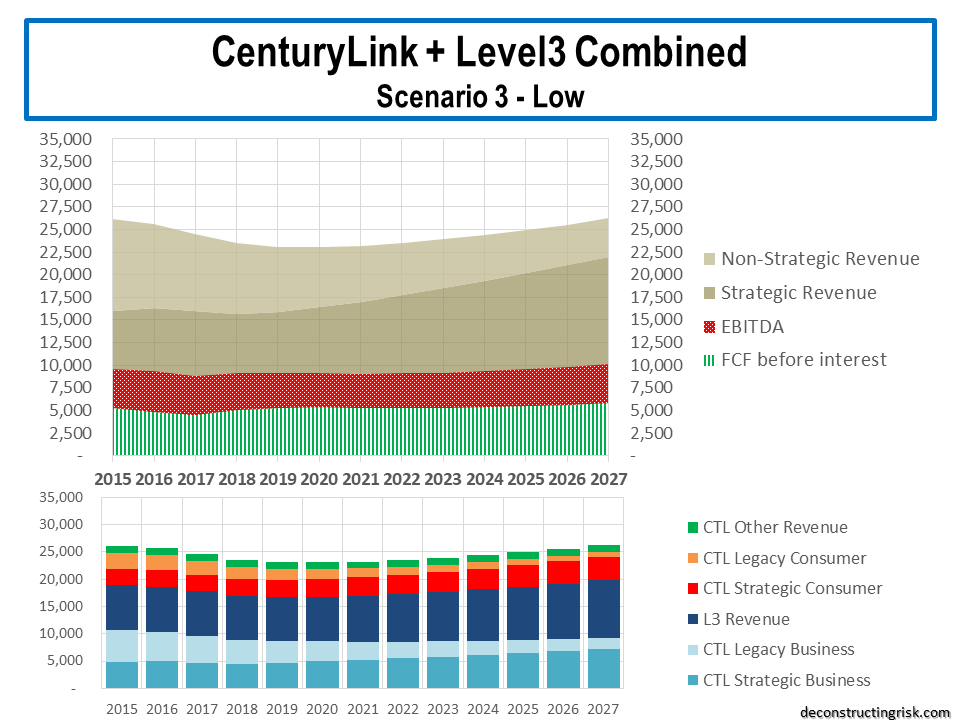
My knowledge of CTL’s business is not as deep as that of LVLT’s and my confidence in their prospects on a standalone basis is nowhere near as lofty. My projections, split over a conservative base scenario and a more conservative low business scenario, can be seen below. My projections are primarily based upon the more recent trends in their business lines across their legacy and strategic enterprise and consumer businesses. The vast variance in my estimates, based upon recent trends, and those presented by management in the S4 (again, acknowledging that these are generally optimistic) illustrates why the market has lost such confidence in the outgoing management team at CTL, in my opinion.

click to enlarge

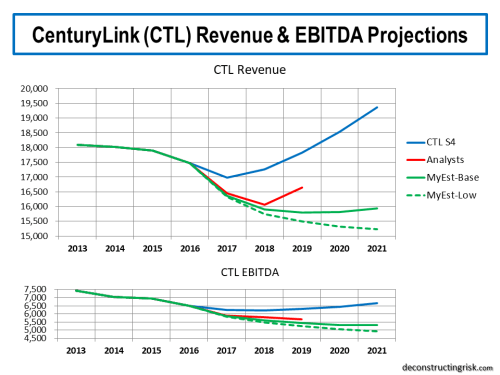
In terms of trying to model the merged CTL/LVLT, I have assumed the deal closes by the end of 2017 with 2018 being the first year of the merged entity. I have made a number of judgmental adjustments in my model, including assuming some loss of revenue due to the merger and cost reductions above published target synergies (e.g. $1 billion of operating synergies by end 2020 and $150 million of capex synergies by end 2019, higher than the announced target savings of $850 million and $125 million for opex and capex respectively). I have taken analyst estimates as an optimistic case (in CTL’s case I have taken their EBITDA estimates but still can’t get anywhere near their revenue figures) and called it the high scenario. My two projections above are used for the base and low scenarios. The resulting operating metrics for each scenario is shown below.

click to enlarge

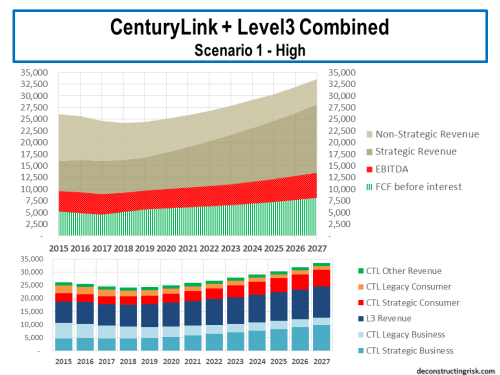
The high scenario shows revenues flat-lining slightly above $24 billion for 2018 and 2019 with top-line growth returning in 2020 (YoY above 2.5%). EBITDA margins hit 40% by 2019 and remain stable around 40% thereafter. Capex is assumed to hit 15.5% of revenues by 2019 and remain at that percentage thereafter. This scenario assumes that management will be able to generate an approximate 30% uplift in the amount of free cashflow (e.g. EBITDA less capex) from 2017 (e.g. combined FCF of both entities in the year prior to the merger) to FY 2020.

click to enlarge

The base scenario shows revenues flat-lining around $23.5 billion for 2018 through 2020 with top-line growth returning in 2021 (YoY just below 2%). EBITDA margins hit 40% by 2019 and slowly trend down toward 39% thereafter. Capex is again assumed to hit 15.5% of revenues by 2019 and remain at that percentage thereafter. This scenario assumes that management will be able to generate an approximate 22% uplift in the amount of free cashflow (e.g. EBITDA less capex) from 2017 (e.g. combined FCF of both entities in the year prior to the merger) to FY 2020.

click to enlarge

The low scenario shows revenues around $23.5 billion for 2018 and drifting down to $23 billion before slowly hitting $23.5 billion again by 2022. Thereafter revenue growth builds slowly from 1.5% to 2.5% by 2027. EBITDA margins hit 39.5% by 2019 and slowly trend down toward 38.5% thereafter. Capex is again assumed to hit 15.5% of revenues by 2019 and remain at that percentage thereafter. This scenario assumes that management will be able to generate an approximate 18% uplift in the amount of free cashflow (e.g. EBITDA less capex) from 2017 (e.g. combined FCF of both entities in the year prior to the merger) to FY 2020.

I also assume the merged entity will carry $38 billion of debt from the offset (resulting from merger expenses, the cash payout to LVLT shareholders, and existing debts from both firms, after factoring any proceeds from recent CTL divestitures). I estimate that only 30% of this debt load is subject to a floating rate. In all scenarios, I assume the LIBOR rate linked to the floating rate increases incrementally by 275 basis points over the next 3 years (the current 12 month US rate is about 175 basis points). With a net debt to EBITDA ratio of approximately 3.8 at the end of 2018 across all scenarios, I believe that getting that ratio below 3 within 4 years by 2021, at the latest, will be a primary objective of the new management team. That would only be prudent in my view given the likely tightening monetary environment over the next few years which will punish valuations of corporates with high debt levels. Also, management will want to remain flexible if higher capex is needed to compete in new technologies for the IoT and digital lifestyle era (see recent sector post). I haven’t factored in an upside from LVLT’s CFO Sunit Patel proven ability to actively manage debt rates and maturities (his ability is highlighted by the fact that LVLT’s fixed debt costs 5.5% compared to CTL’s admittingly much larger fixed debt costing 6.8%)

That leads to the thorny question of the sustainability of the annual dividend of $2.16 per share (particularly given that share count will double, amounting to $2.3 billion per year). Under the high scenario, maintaining the current dividend and getting the net debt multiple below 3 by 2021 is doable if a little tight (primarily due to the cashflow benefits of LVLT’s NOLs). For both of the base and low scenarios maintaining the current dividend level is not realistic in my view, with a cut in the dividend to $1.30 and $1.00 needed in each scenario respectively (a 40% and a 55% cut). The current dividend yield on CTL is over 10%. Each of the cuts above would reduce that yield to approximately 6% and 5% for the base and low scenarios respectively based upon the current share price. Addressing the uncertainty over the dividend should be one of the priorities of the new management (and may even result in Jeff Storey’s move to the CEO position ahead of the planned January 2019 date).

Finally, before I reveal my per share valuations, I haven’t given any consideration to the financial impact of the current legal cases on alleged aggressive sales tactics as the level of current detail makes any such estimate impossible. Some of the class action cases claim anything from $600 million to $12 billion but these claims are always bloated and the eventual settlement figure, if there even is one, are often for a lot less than that claimed. Nor have I considered the potential impact of a spin-off of the consumer business (that’s for another time!).

So, based upon the analysis outlined in this post and using a discount rate of 8.5%, my valuation estimates for each of the three scenarios are below.

click to enlarge

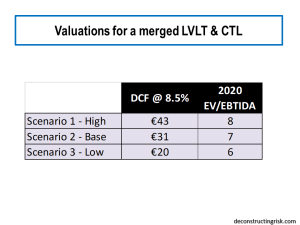
The market’s current valuation of CTL around $20 indicates scenario 3 as the current expectation. This emphasizes the need to address the uncertainty over future dividend levels and the validity of the legal cases. Uncertainty over the closing date of the deal is overblown, in my view, and a few months of delay will not prove material. I do think the current valuation is harsh, given the potential upsides from the deal and longer-term industry trends. Interestingly, my base scenario valuation of £31 is not too far off the value of $34.75 by BofA Merrill Lynch and Morgan Stanley in the S4 (see this post on the S4). The base scenario is the one I would have the most confidence in, based upon my current knowledge, rather than the high scenario of $43 which does look too optimistic to me given current market trends.

I was never going to reinvest the cash component of the deal for LVLT shareholders given my current reservations about market valuations and move to cash across my portfolio. The analysis presented in this post indicates to me that the CTL shares due from the deal for LVLT shareholders are worth holding from a valuation perspective. For now.

For new investors, I’d wait to see how some of the uncertainties play out, particularly the dividend issue.

Farewell, dissonant 2016.

Many things will be written about the events of 2016.

The populist victories in the US election and the UK Brexit vote will no doubt have some of the biggest impacts amongst the developed world. Dissatisfaction amongst the middle class across the developed world at their declining fortunes and prospects, aligned with the usual disparate minorities of malcontent, has forced a radical shift in support away from the perceived wisdom of the elite on issues such as globalisation. The strength of the political and institutional systems in the US and the UK will surely adapt to the 2016 rebuff over time.

The more fundamental worry for 2017 is that the European institutions are not strong enough to withstand any populist curveball, particularly the Euro. With 2017 European elections due in France, Germany, Netherlands and maybe in Italy, the possibility of further populist upset remains, albeit unlikely (isn’t that what we said about Trump or Brexit 12 months ago!).

The 5% rise in the S&P 500 since Trump’s election, accounting for approx half of the overall increase in 2016, has made the market even more expensive with the S&P 500 currently over 60% of its historical average based upon the 12 month trailing PE and the Shiller CAPE (cyclically adjusted price to earnings ratio, also referred to as the PE10). A recent paper by Valentin Dimitrov and Prem C. Jain argues that stocks outperform 10-year U.S. Treasuries regardless of CAPE except when CAPE is very high (the current CAPE is just above the “very high” reference point of 27.6 in the paper) and that a high CAPE is an indicator of future stock market volatility. Bears argue that the President elect’s tax and expansionary fiscal policies will likely lead to higher interest rates and inflation in 2017 which will further strengthen the dollar, both of which will pressure corporate earnings.

Critics of historical PE measures like CAPE, such as Jeremy Siegel in this paper (previous posts on this topic are here and here), highlight the failings of using GAAP earnings and point to alternative metrics such as NIPA (national income and product account) after-tax corporate profits which indicate current valuations are more reasonable, albeit still elevated above the long term average by 20%-30%. The graph below from a Yardeni report illustrates the difference in the earnings metrics.

click to enlargenipa-vrs-sp500-earnings

Bulls further point to strong earnings growth in 2017 complemented by economic stimulus and corporate tax giveaways under President Trump. Goldman Sachs expects corporations to repatriate approx $200 billion of overseas cash and to spend a lot of it buying back stock rather than making capital expenditures (see graph below) although the political pressure to invest in the US may impact the balance.

click to enlargesp500-use-of-cash-2000-to-2017

The consensus amongst analysts predict EPS growth in 2017 in the high single digits, with many highlighting further upside depending upon the extent of the corporate tax cuts that Trump can get past the Republican congress. Bulls argue that the resulting forward PE ratio for the S&P 500 of approx 17 only represents a 20% premium to the longer term average. Predictions for the S&P 500 for 2017 by a selection of analysts can be seen below (the prize for best 2016 prediction goes to Deutsche Bank and UBS). It is interesting that the average prediction is for a 4% rise in the S&P500 by YE 2017, hardly a stellar year given their EPS growth projections!

click to enlargesp500-predictions-2017

My best guess is that the market optimism resulting from Trump’s victory continues into 2017 until such time as the realities of governing and the limitations of Trump’s brusque approach becomes apparent. Volatility is likely to be ever present and actual earnings growth will be key to the market story in 2017 and maintaining high valuation multiples. After all, a low or high PE ratio doesn’t mean much if the earnings outlook weakens; they simply indicate how far the market could fall!

Absent any significant event in the early days of Trump’s presidency (eh, hello, Mr Trump’s skeleton cupboard), the investing adage about going away in May sounds like a potentially pertinent one today. Initial indications of Trump’s reign, based upon his cabinet selections, indicate sensible enough domestic economy policies (relatively) compared with an erratic foreign policy agenda. I suspect Trump first big foreign climb down will come at the hands of the Chinese, although his bromance with Putin also looks doomed to failure.

How Brexit develops in 2017 looks to be much more worrying prospect. After watching her actions carefully, I am fast coming to the conclusion that Theresa May is clueless about how to minimise the financial damage from Brexit. Article 50 will be triggered in early 2017 and a hard Brexit now seems inevitable, absent a political shock in Europe which results in an existential threat to the EU and/or the Euro.

The economic realities of Brexit will only become apparent to the UK and its people, in my view, after Article 50 is triggered and chunks of industry begin the slow process of moving substantial parts of their operation to the continent. This post illustrates the point in relation to London’s insurance market. The sugar high provided by the sterling devaluation after Brexit is fading and the real challenge of extracting the UK from the institutions of the EU are becoming ever apparent.

Prime Minister May should be leading her people by arguing for the need for a sensible transition period to ensure a Brexit logistical tangle resulting in unnecessary economic damage is avoided. Instead, she acts like a rabbit stuck in the headlights. Political turmoil seems inevitable as the year develops given the current state of the UK’s fractured political system and lack of sensible leadership. The failure of a coherent pro-Europe political alternative to emerge in the UK following the Brexit vote, as speculated upon in this post, is increasingly looking like a tragedy for the UK.

Of course, Trump and Brexit are not the only issues facing the world in 2017. China, the Middle East, Russia, climate change, terrorism and cyber risks are just but a few of the issues that seem ever present in any end of year review and all will likely be listed as such in 12 months time. For me, further instability in Europe in 2017 is the most frightening potential addition to the list.

As one ages, it becoming increasingly understandable why people think their generation has the best icons. That said, the loss of genuine icons like Muhammad Ali and David Bowie (eh, sorry George Michael fans) does put the reality of the ageing (as highlighted in posts here and here) of the baby boomer generation in focus. On a personal note, 2016 will always be remembered by me for the loss of an icon in my life and emphasizes the need to appreciate the present including all of those we love.

So on that note, I’d like to wish all of my readers a prosperous, happy and healthy 2017. It looks like there will be plenty to write about in 2017…..