Tag Archives: bear market

Enervating Market

Wow, what a December this has been in the equity markets! Not a buyer in sight as we (effectively given the Christmas break) end the year at the S&P500 close today of 2,417. This really is a market to stay well away from. I suspect Q1 2019 will again be volatile until we get into earnings season and get a taste of the sector 2019 EPS projections (a minor relief rally from institutional funds allocating capital followed by more programme selling is my guess).

This recent post postulated that with small single digit EPS growth for 2019 and 2020, a slowing but non-recession scenario, a range of 2,500 to 2,300 on the S&P500. Well, we’re bang in that range now!! And the consensus is for more downside with the probability of a recession beginning next year raising by the day. Not even dovish statements today from John Williams of the New York Fed could tempt the buyers out of hibernation. The prospect of the demise of the Fed put has freaked the market out this week. My crude calculations estimate that a slow drop in operating EPS over 2019 of 6%, likely in a mild recession scenario, could result in the S&P500 testing 2,000.

I have been bearish on this market for several years (here, here and here are just recent examples) and although the majority of my assets have been in cash throughout 2018, the graph below from BoA Merrill Lynch, sends a shiver down my spine. As with most people, my equity positions have been hammered. According to BoA ML, the last time there was positive cash and negative equity, credit, and government returns in the same year was 1969. To plagiarize the old investing adage, it would take some monkey to call a bottom on this equity market any time soon.

Click to Enlarge

The outlook for 2019 is highly uncertain at the current point in time, nobody really knows how it will pan out and I’ll leave the musing over that topic to future posts. As this post in January highlighted, I do think quantitative tightening and the great unwinding of Central Bank easing experimentation is having some nasty unintended consequences.

At this time, I do find it insightful to look at recent movements in a historical context. If you look at the number of months with moves greater than or equal to +/-1% in the S&P500, the comparison between the decades is as below. The number of such moves are surprisingly consistent across the decades.

Click to Enlarge

If we assume that the 1970s and the 2000’s were extraordinary decades with the oil and financial crises respectively, then there could be more up months than down months due in the remainder of this decade for it to look more like the 1980s or the 1990s. A pretty flimsy analysis admittedly!

Continuing the theme of trying to end the year on a positive note, if we look at the historical months with moves of +/-5%, as below, it could be argued that the recent volatility is healthy as extended periods of reduced volatility prior to the dotcom bubble and the financial crisis didn’t end well!!

Click to Enlarge

That’s a happier note to end on (albeit rather pangloss).

A very happy and healthy Christmas to all who have spent any time reading my musings this year.

Bye-bye buy the dip

As my previous post illustrated, I got caught up with the notion that the fall in the equity market of late was an opportunity to buy into some names in the expectation that we’d go higher into year end. It’s clear that the classic “buy the dip” strategy that has worked so well in recent years, well, doesn’t work anymore. The graph below, from a report by equity strategist Michael Wilson of Morgan Stanley, has been widely cited to illustrate the failure of the strategy in 2018.

click to enlarge

Wilson commented that “such market behaviour is rare and in the past has coincided with official bear markets (20 percent declines), recessions, or both.” There is much discussion amongst commentators about whether we are entering, or indeed have entered, a bear market. I like the simplicity of the argument by Peter Oppenheimer, another equity strategist this time at Goldman Sachs. Oppenheimer argues that a decline in corporate profits in 2019 implies a recession in the US and as a recession is unlikely in 2019, he expects corporate profits to continue to grow, albeit at a much-reduced pace.

As pointed out by Wilson, we will not know the answer about where corporate profits are going until firms report Q4 and guide for 2019. He did also say that equity analysts are always slow off the mark as they wait for firms to reluctantly report on bad news. The after the fact downgrades on NVDA are testament to that! With some commentators calling the bottom around 2,550 to 2,600 on the S&P500, it looks unlikely that there will be any major upside in the market until there is more clarity on Fed policy and the trade issues with China.

If the market moving up depends upon Fed Chairman Powell indicating a policy change to “one and wait” or for a breakthrough at the G20 on trade, then I think we’ll go down further or, at best, sideways. If there is some modest indicator that the pace of interest rate rises in 2019 will be data dependent from Powell and the G20 meeting results in a short-term cease-fire between the US and China, then markets could find a bottom and stabilize. Whatever about the likelihood of the Fed rescuing the market (unlikely in my opinion), I fear that any meaningful relaxation in US-China tensions is against the play-book of the Orange One in the White House. The rhetoric from side-kick Pence at the weekend with language indicating China was leading other Asian countries into debt bondage does not bode well for next week’s G20 summit.

On China, I really like Ray Dalio’s explanation of the fundamental difference between the Chinese and US system (here is just one example of his latest thoughts), being a top down versus a bottom up approach. As Dalio explained it, the Chinese place an importance on family and paternal direction as opposed to the US adoration of the individual above all else. Unfortunately, I doubt that the current US leadership has the intellect to nuance a workable resolution between these two philosophies.

Following on from the analysis in this post on peak quarterly earnings, the current market narrative is that the EPS estimates for 2019 and 2020 will come down over the coming months. Currently S&P is showing a 11% projected increase for 2019 operating EPS for the S&P500 (13% on a reported EPS basis). The current market jitters indicate the market view those figures as unrealistic. Oppenheimer indicated that Goldman Sachs is currently thinking about a 6% and a 4% growth in EPS for 2019 and 2020 respectively is more realistic. Wilson indicted Morgan Stanley are projecting EPS growth for 2019 in the low single digits.

Given that estimates usually increase over time in the good years and decease in the bad years, I am going to assume a 3% and 1% increase in operating EPS for 2019 and 2020 respectively in this no recession but slowing growth scenario. Given that forward multiples would also decline in such a slowing environment (I have assumed to a modest 14), I estimate year-end targets for the S&P500 for 2019 and 2020 of 2,500 and 2,300 respectively, a decline of 6% and 13% respectively over the S&P500 today! The graph below shows the scenario as described.

click to enlarge

Economies generally don’t have slow gentle soft landings, it’s nearly always turbulent. Just look at the chart above to see how improbable the gentle scenario is compared to history. We need a major boast, such as a comprehensive resolution of the US-China trade issue, to maintain the bull market. Otherwise, I suspect the great EPS growth party is over.

Interestingly, Morgan Stanley also highlighted the headwind of quantitative tightening, as per the graph below, on the current market fall. I last discussed this issue in this post in January.

click to enlarge

No more buy the dip for a while yet I fear…….


Broken Record II

As the S&P500 hit an intraday all-time high yesterday, it’s been nearly 9 months since I posted on the valuation of the S&P500 (here). Since then, I have touched on factors like the reversal of global QE flows by Central Banks (here) and the lax credit terms that may be exposed by tightening monetary conditions (here). Although the traditional pull back after labor day in the US hasn’t been a big feature in recent years, the market feels frothy and a pullback seems plausible. The TINA (There Is No Alternative) trade is looking distinctly tired as the bull market approaches the 3,500-day mark. So now is an opportune time to review some of the arguments on valuations.

Fortune magazine recently had an interesting summary piece on the mounting headwinds in the US which indicate that “the current economic expansion is much nearer its end than its beginning”. Higher interest rates and the uncertainty from the ongoing Trump trade squabble are obvious headwinds that have caused nervous investors to moderate slightly valuation multiples from late last year. The Fortune article points to factors like low unemployment rates and restrictions on immigration pushing up wage costs, rising oil prices, the fleeting nature of Trump’s tax cuts against the long-term impact on federal debt, high corporate debt levels (with debt to EBITDA levels at 15 years high) and the over-optimistic earnings growth estimated by analysts.

That last point may seem harsh given the 24% and 10% growth in reported quarterly EPS and revenue respectively in Q2 2018 over Q2 2017, according to Factset as at 10/08/2018. The graph below shows the quarterly reported growth projections by analysts, as per S&P Dow Jones Indices, with a fall off in quarterly growth in 2019 from the mid-20’s down to a 10-15% range, as items like the tax cuts wash out. Clearly 10-15% earnings growth in 2019 is still assuming strong earnings and has some commentators questioning whether analysts are being too optimistic given the potential headwinds outlined above.

click to enlarge

According to Factset as at 10/08/2018, the 12-month forward PE of 16.6 is around the 5-year average level and 15% above the 10-year average, as below. As at the S&P500 high on 21/08/2018, the 12-month forward PE is 16.8.

click to enlarge

In terms of the Shiller PE or the cyclically adjusted PE (PE10), the graph below shows that the current PE10 ratio of 32.65 as at the S&P500 high on 21/08/2018, which is 63% higher than 50-year average of 20. For the purists, the current PE10 is 89% above the 100-year average.

click to enlargeCAPE Shiller PE PE10 as at 21082018 S&P500 high

According to this very interesting research paper called King of the Mountain, the PE10 metric varies across different macro-economic conditions, specifically the level of real interest rates and inflation. The authors further claim that PE10 becomes a statistically significant and economically meaningful predictor of shorter-term returns under the assumption that PE10 levels mean-revert toward the levels suggested by prevailing macroeconomic conditions rather than toward long-term averages. The graph below shows the results from the research for different real yield and inflation levels, the so-called valuation mountain.

click to enlarge

At a real yield around 1% and inflation around 2%, the research suggests a median PE around 20 is reasonable. Although I know that median is not the same as mean, the 20 figure is consistent with the 50-year PE10 average. The debates on CAPE/PE10 as a valuation metric have been extensively aired in this blog (here and here are examples) and range around the use of historically applicable earnings data, adjustments around changes in accounting methodology (such as FAS 142/144 on intangible write downs), relevant time periods to reflect structural changes in the economy, changes in dividend pay-out ratios, the increased contribution of foreign earnings in US firms, and the reduced contribution of labour costs (due to low real wage inflation).

One hotly debated issue around CAPE/PE10 is the impact of the changing profit margin levels. One conservative adjustment to PE10 for changes in profit margins is the John Hussman adjusted CAPE/PE10, as below, which attempts to normalise profit margins in the metric. This metric indicates that the current market is at an all time high, above the 1920s and internet bubbles (it sure doesn’t feel like that!!). In Hussman’s most recent market commentary, he states that “we project market losses over the completion of this cycle on the order of -64% for the S&P 500 Index”.

click to enlarge

Given the technological changes in business models and structures across economic systems, I believe that assuming current profit margins “normalise” to the average is too conservative, particularly given the potential for AI and digital transformation to cut costs across a range of business models over the medium term. Based upon my crude adjustment to the PE10 for 2010 and prior, as outlined in the previous Broken Record post (i.e. adjusted to 8.5%), using US corporate profits as a % of US GDP as a proxy for profit margins, the current PE10 of 32.65 is 21% above my profit margin adjusted 50-year average of 27, as shown below.

click to enlargeCAPE Shiller PE PE10 adjusted as at 21082018 S&P500 high

So, in summary, the different ranges of overvaluation for the S&P500 at its current high are from 15% to 60%. If the 2019 estimates of 10-15% quarterly EPS growth start to look optimistic, whether through deepening trade tensions or tighter monetary policy, I could see a 10% to 15% pullback. If economic headwinds, as above, start to get serious and the prospect of a recession gets real (although these things normally come quickly as a surprise), then something more serious could be possible.

On the flipside, I struggle to see where significant upside can come from in terms of getting earnings growth in 2019 past the 10-15% range. A breakthrough in trade tensions may be possible although unlikely before the mid-term elections. All in all, the best it looks like to me in the short term is the S&P500 going sideways from here, absent a post-labor day spurt of profit taking.

But hey, my record on calling the end to this bull market has been consistently broken….

Broken Record

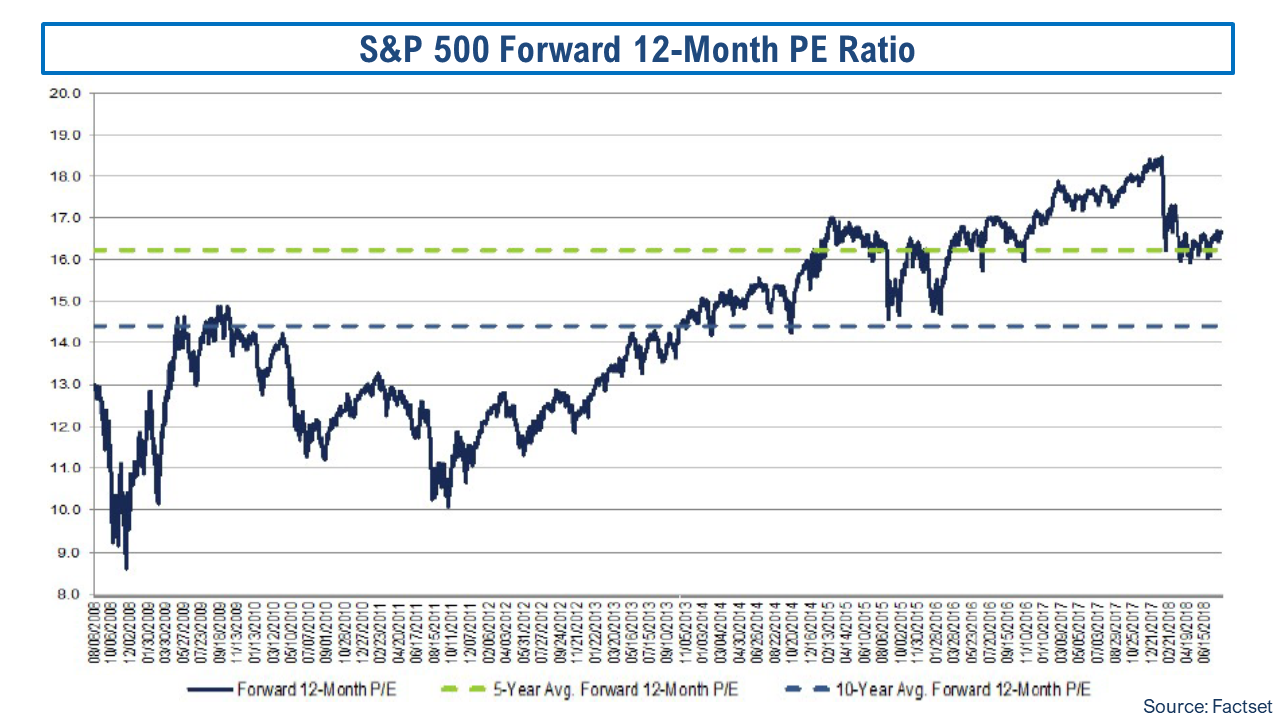
Whilst the equity market marches on regardless, hitting highs again today, writing about the never-ending debates over equity valuations makes one feel like a broken record at times. At its current value, I estimate the S&P500 has returned an annualised rate of nearly 11%, excluding dividends, since its low in March 2009. As of the end of September 2017, First Trust estimated the total return from the S&P500 at 18% since March 2009, as per the graph below.

click to enlarge

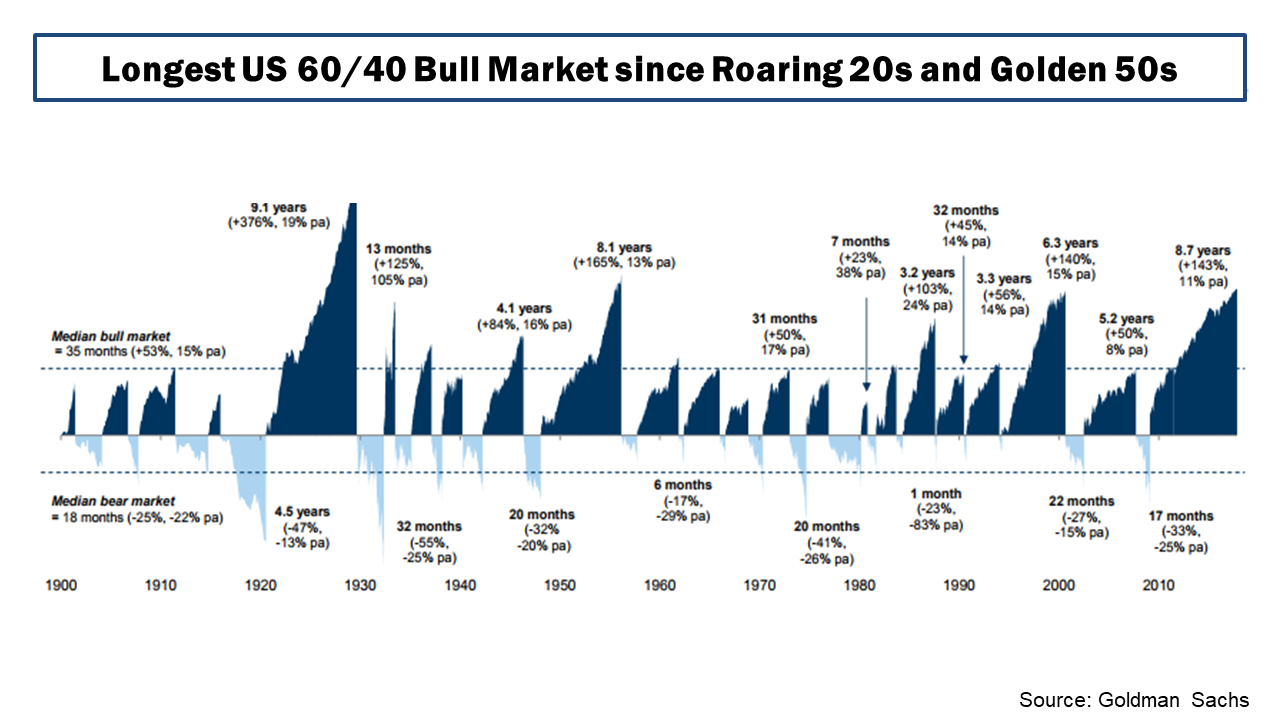
Goldman Sachs recently published an analysis on a portfolio of 60% in the S&P 500 and 40% in 10-year U.S. Treasuries, as per the graph below, and commented that “we are nearing the longest bull market for balanced equity/bond portfolios in over a century, boosted by a Goldilocks backdrop of strong growth without inflation”. They further stated that “it has seldom been the case that all assets are expensive at the same time—historical examples include the Roaring ‘20s and Golden ‘50s. While in the near term, growth might stay strong and valuations could pick up further, they should become a speed limit for returns”.

click to enlarge

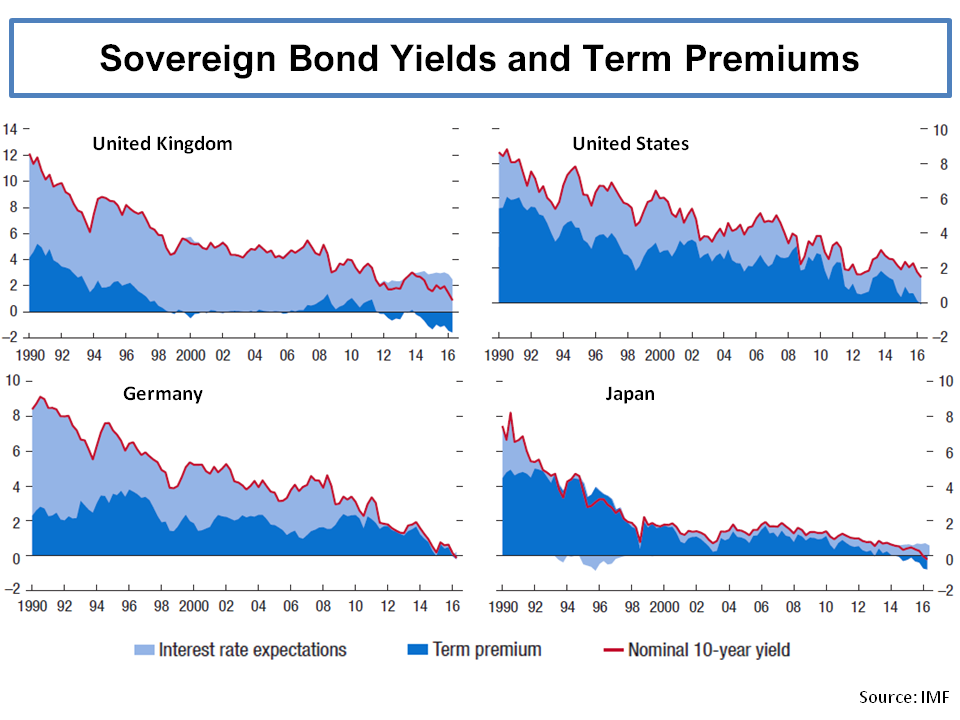
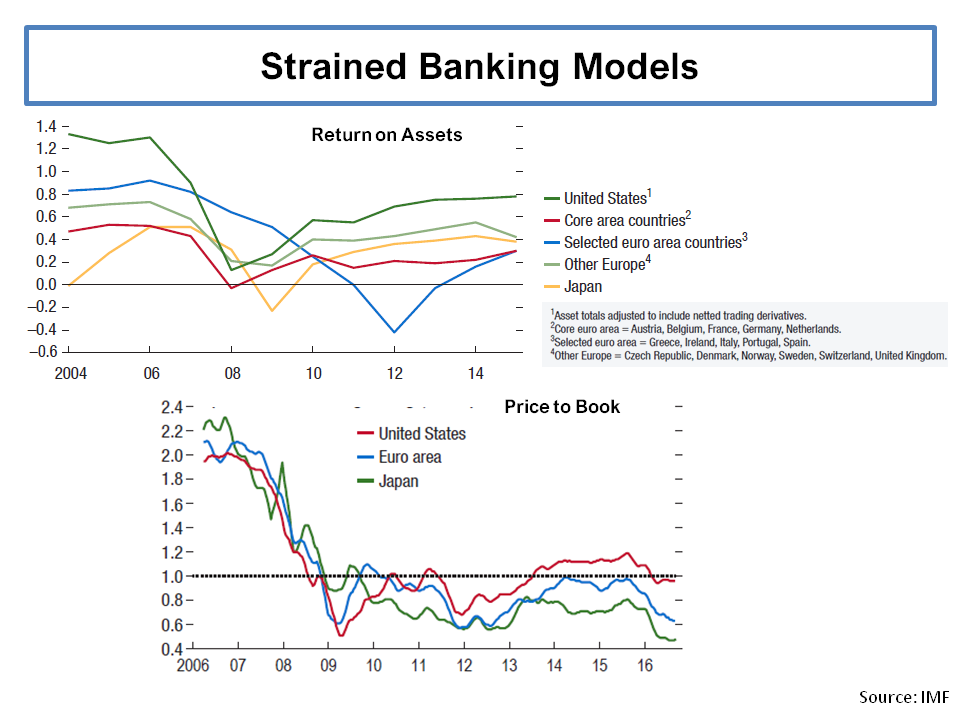
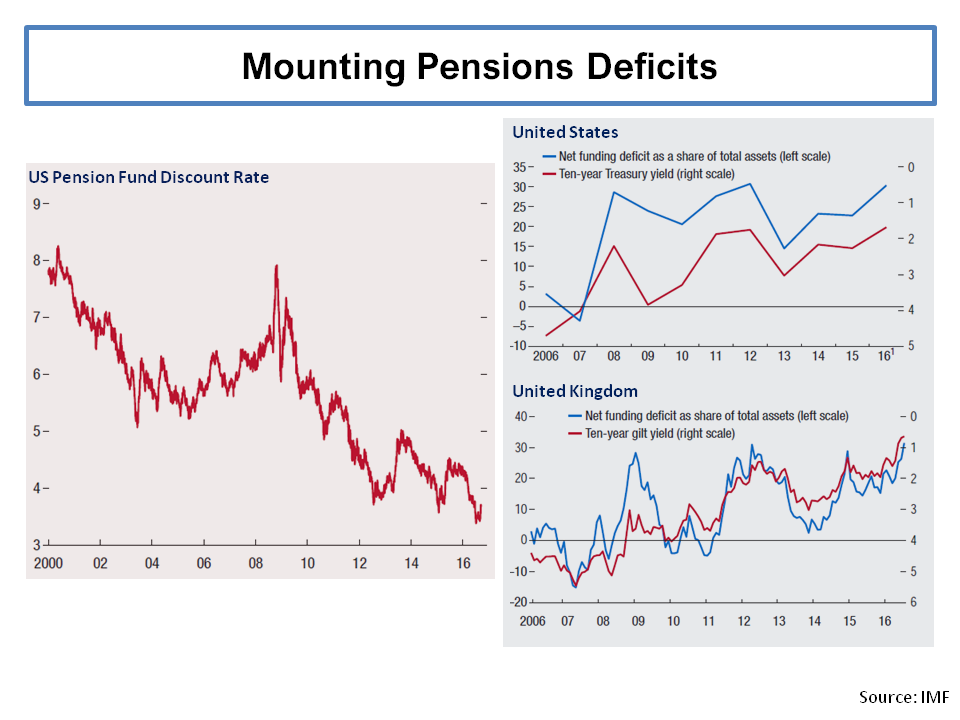
My most recent post on the topic of US equity valuations in May looked at the bull and bear arguments on low interest rates and heighten profit margins by Jeremy Grantham and John Hussman. In that post I further highlighted some of the other factors which are part of the valuation debate such as the elevated corporate leverage levels, reduced capital expenditures, and increased financial risk taking as outlined in the April IMF Global Financial Stability report. I also highlighted, in my view, another influential factor related to aging populations, namely the higher level of risk assets in public pensions as the number of retired members increases.

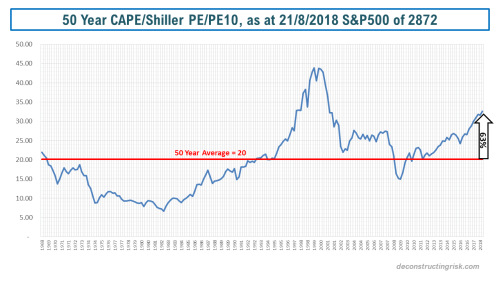
In other posts, such as this one on the cyclically adjusted PE (CAPE or PE10), I have highlighted the debates around the use of historically applicable earnings data in the use of valuation metrics. Adjustments around changes in accounting methodology (such as FAS 142/144 on intangible write downs), relevant time periods to reflect structural changes in the economy, changes in dividend pay-out ratios, the increased contribution of foreign earnings in US firms, and the reduced contribution of labour costs (due to low real wage inflation) are just some examples of items to consider.

The FT’s John Authers provided an update in June on the debate between Robert Shiller and Jeremy Siegel over CAPE from a CFA conference earlier this year. Jeremy Siegel articulated his critique of the Shiller CAPE in this piece last year. In an article by Robert Shiller in September article, called “The coming bear market?”, he concluded that “the US stock market today looks a lot like it did at the peaks before most of the country’s 13 previous bear markets”.

The contribution of technology firms to the bull market, particularly the so-called FANG or FAANG stocks, has also been a much-debated issue of late. The graph below shows the historical sector breakdown of the S&P500 since 1995.

click to enlarge

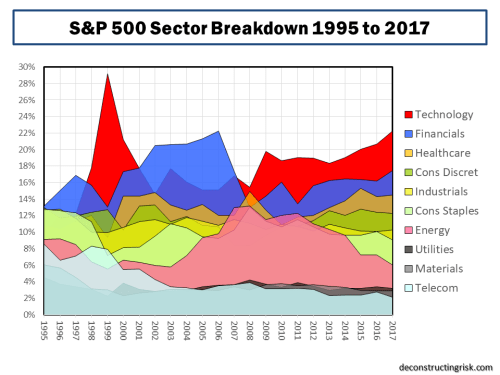
A recent article from GMO called “FAANG SCHMAANG: Don’t Blame the Over-valuation of the S&P Solely on Information Technology” tried to quantify the impact that the shift in sector composition upon valuations and concluded that “today’s higher S&P 500 weight in the relatively expensive Information Technology sector is cause for some of its expensiveness, but it does not explain away the bulk of its high absolute and relative valuation level. No matter how you cut it, the S&P 500 (and most other markets for that matter) is expensive”. The graph below shows that they estimate the over-valuation of the S&P500, as at the end of September 2017, using their PE10 measure is only reduced from 46% to 39% if re-balanced to take account of today’s sector weightings.

click to enlarge

In his recent article this month, John Hussman (who meekly referred to “his incorrectly tagged reputation as a permabear”!!) stated that “there’s no need to take a hard-negative outlook here, but don’t allow impatience, fear of missing out, or the illusion of permanently rising stock prices to entice you into entrusting your financial future to the single most overvalued market extreme in history”.

As discussed in my May post, Hussman reiterated his counter-argument to Jeremy Grantham’s argument that structurally low interest rates, in the recent past and in the medium term, can justify a “this time it’s different” case. Hussman again states that “the extreme level of valuations cannot, in fact, be “justified” on the basis of depressed interest rates” and that “lower interest rates only justify higher valuations if the stream of future cash flows is held constant” and that “one of the reasons why reliable valuation measures have retained such a high correlation with subsequent market returns across history, regardless of the level of interest rates, is that the impact of interest rates and growth rates on “terminal” valuations systematically offset each other”.

Hussman also again counters the argument that higher profit margins are the new normal, stating that “it’s important to recognize just how dependent elevated profit margins are on maintaining permanently depressed wages and salaries, as a share of GDP” and that “simply put, elevated corporate profit margins are the precise mirror-image of depressed labour compensation” which he contends is unlikely to last in a low unemployment environment.

Hussman presents a profit margin adjusted CAPE as of the 3rd of November, reproduced below, which he contends shows that “market valuations are now more extreme than at any point in history, including the 1929 and 2000 market highs”.

click to enlarge

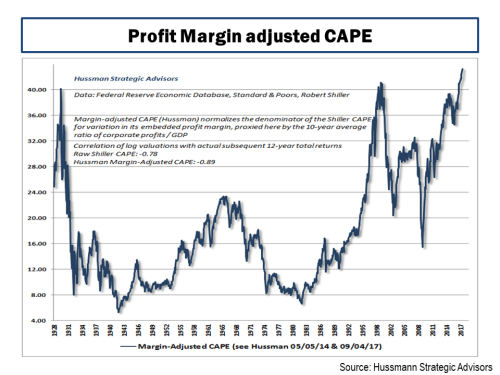
However, I think that his profit margin analysis is harsh. If you adjust historical earnings upwards for newer higher margin levels, of course the historical earning multiples will be lower. I got to thinking about what current valuations would look like against the past if higher historical profit margins, and therefore earnings, had resulted in higher multiples. Using data from Shiller’s website, the graph below does present a striking representation of the relationship between corporate profits (accepting the weaknesses in using profits as a percentage of US GDP) and interest rates.

click to enlarge

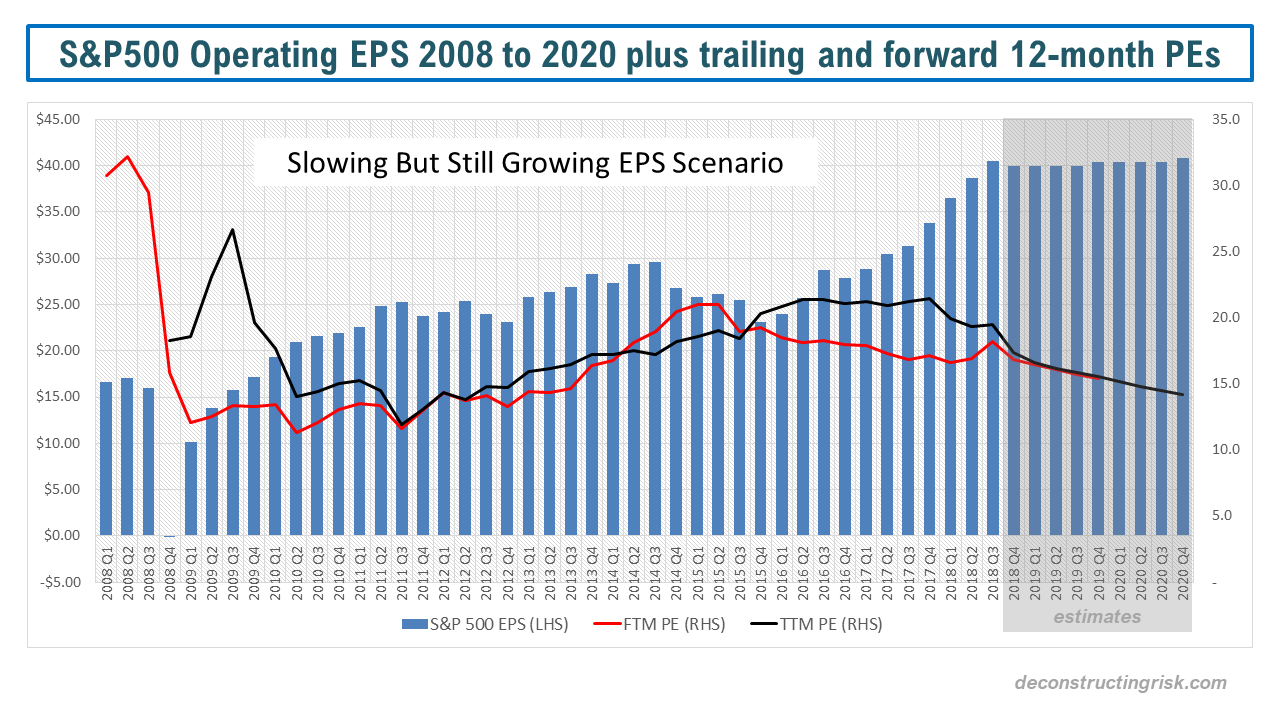
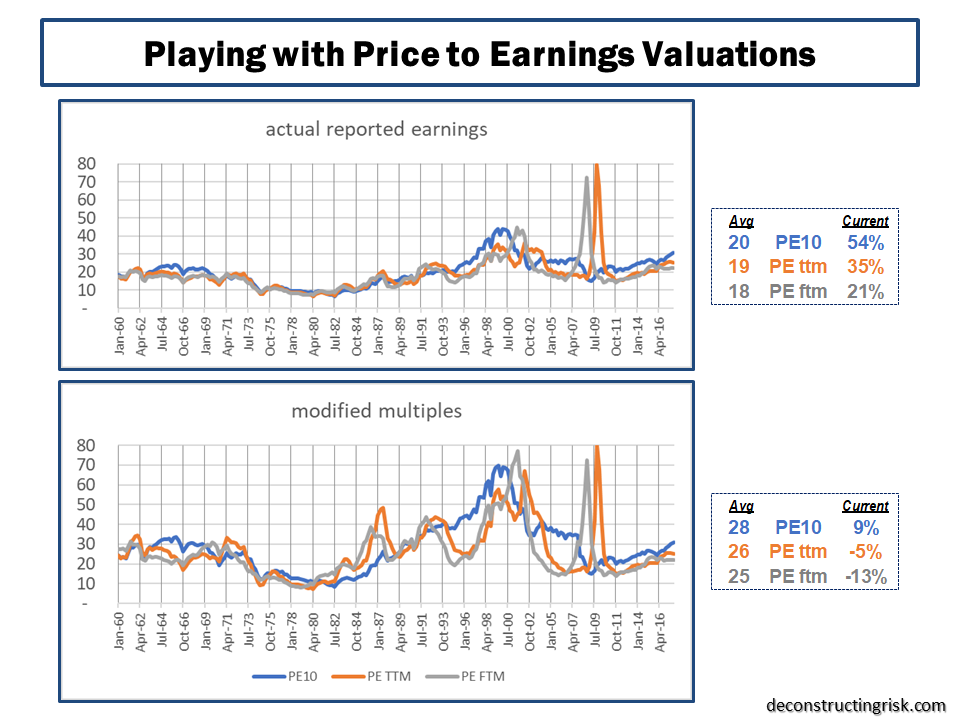
Purely as a thought experiment, I played with Shiller’s data, updating the reported earnings for estimates through 2018 (with a small discount to reflect over-zealous estimates as per recent trends of earnings revisions), recent consensus end 2018 S&P500 targets, and consensus inflation and the 10-year US interest rates through 2018. Basically, I tried to represent the base case from current commentators of slowly increasing inflation and interest rates over the short term, with 2018 reported EPS growth of 8% and the S&P500 growing to 2,900 by year end 2018. I then calculated the valuation metrics PE10, the regular PE (using trailing twelve month reported earnings called PE ttm), and the future PE (using forward twelve month reported earnings called PE ftm) to the end of 2018. I further adjusted the earnings multiples, for 2007 and prior, by applying an (principally upward) adjustment equal to a ratio of the pre-2007 actual  corporate profits percentage to GDP divided by a newly assumed normalised percentage of 8.5% (lower than the past 10-year average around 9% to factor in some upward wage pressures over the medium term). The resulting historical multiples and averages are shown below.

click to enlarge

Based upon this analysis, whilst accepting its deeply flawed assumptions, if 2018 follows the base case currently expected (i.e. no external shocks, no big inflation or interest rates moves, steady if not spectacular earnings growth), the S&P500 currently looks over-valued by 50% to 20% using historical norms. If this time it is different and higher profit margins and lower interest rates are the new normal, then the S&P500 looks roughly fairly-valued and current targets for 2018 around 2,900 look achievable. Mind you, it’s a huge leap in mind-set to assume that the long-term average PE is justifiably in the mid-20s.

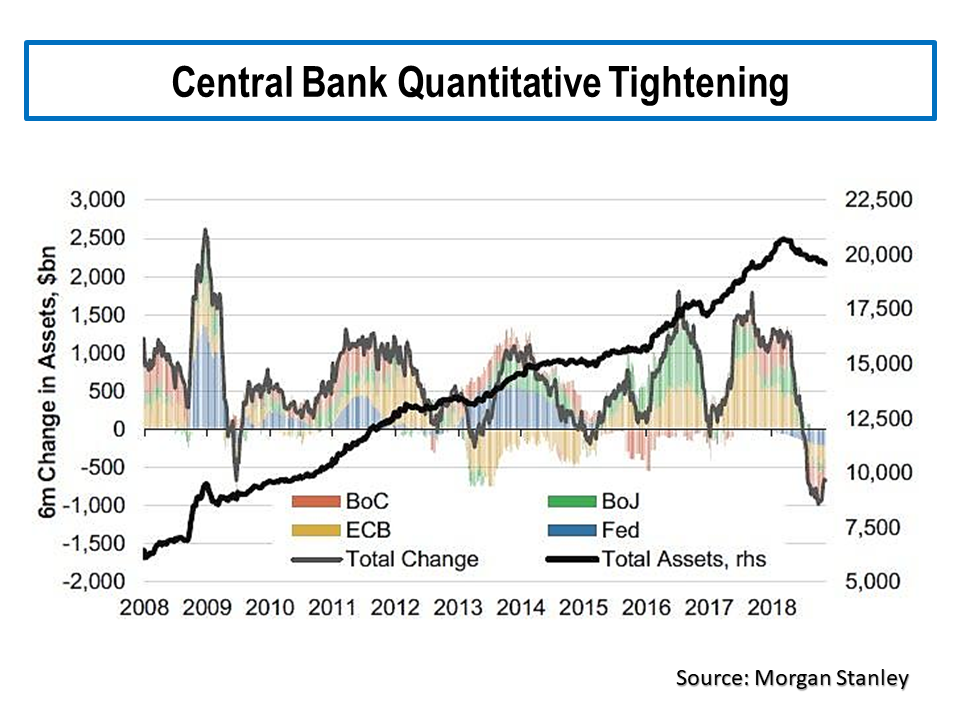
I continue to be concerned about increasing corporate leverage levels, as highlighted in my May post from the IMF Global Financial Stability report in April, and the unforeseen consequences of rising interest rate after such a long period of abnormally low rates.

In the interim, to paraphrase an ex-President, it’s all about the earnings stupid!

One Direction

Goldman Sachs says “we have more potential for shocks right now”. Deutsche Bank and Bank of America Merrill Lynch predict a pick-up in volatility to hit equities. The ever positive Albert Edwards of Socgen points to a recent IMF report on debt and trashes the Fed with the quip “these dudes will never identify an asset bubble at least before the event!

In the IMF report referenced above, and other reports published by the IMF this month, there is some interesting analysis and a sample of the accompanying graphs are reproduced below.

All of these graphs show trends going inexorably in one direction. Add in dollops of (not unrelated) political risk particularly in the UK and across Europe, and that direction looks like trouble ahead.

click to enlargeimf-gross-global-debt-as-of-gdp

click to enlargeimf-private-debt-during-deleveraging-periods

click to enlargeimf-decomposition-of-equity-valuations-october-2016

click to enlargeimf-global-real-rates

click to enlargeimf-report-sovereign-bond-yields-and-term-premiums

click to enlargeimf-report-banking-sector

click to enlargeimf-report-pension-deficits