Tag Archives: earnings growth

Flying High

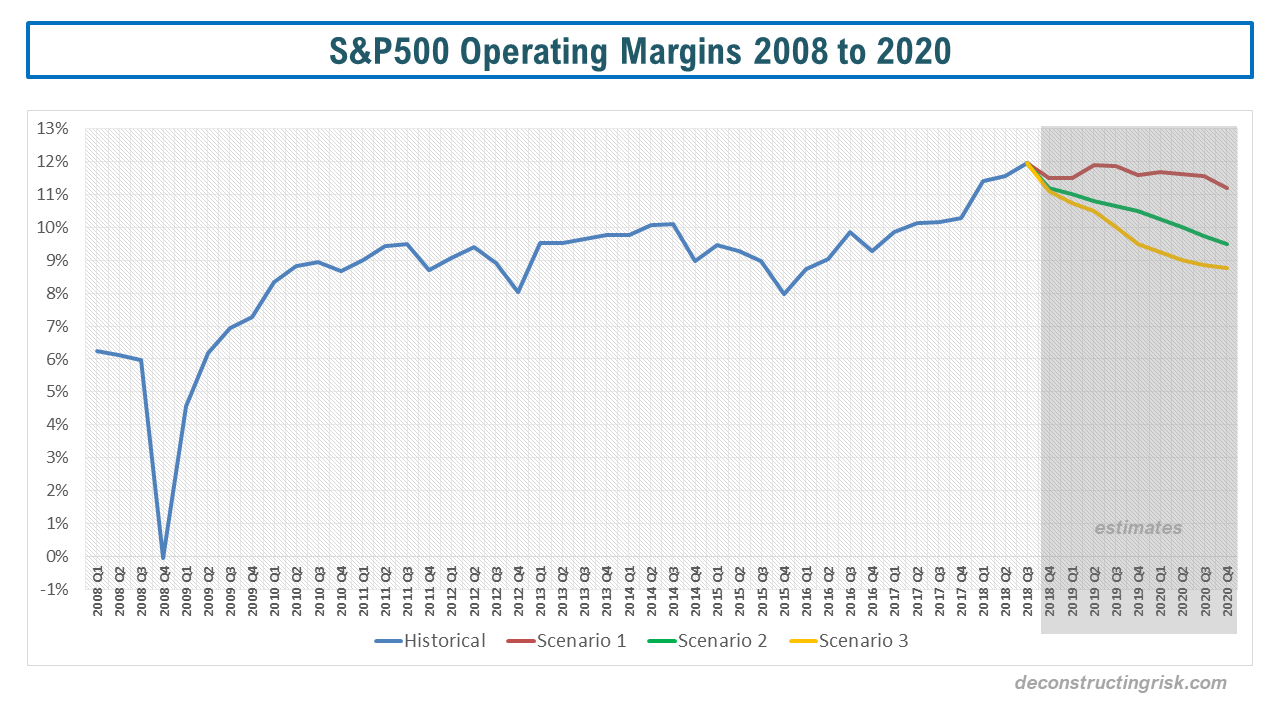
As the S&P 500 grapples around the 2,800 mark, it has achieved an impressive 12% year to date gain. A pause or a pull-back whilst macro events like Brexit and the US-China trade talks are resolved are a possibility given the near 17 forward PE. I thought it would be worthwhile looking at some of the high flyers in the market to search for value.

I selected a group of 12 stocks that have increased by 25% on average since the beginning of the year. The list is dominated by business software firms that are squarely in the SaaS, cloud and AI hype. Firms like ServiceNow (NOW), Workday (WDAY), Tableau Software (DATA), Splunk (SPLK), Adobe (ADBE), Salesforce (CRM), Palo Alto Networks (PANW) and the smaller Altair Engineering (ALTR). Others included in my sample are Square (SQ), Paypal (PYPL), VMWare (VMW) and my old friend Nvidia (NVDA).

Using data from Yahoo Finance, I compared each of the firm’s valuation, based upon today’s close, using their 2019 projected PE against their PEGs, using projected EPS growth for the next 3 years. The results are below.

click to enlarge

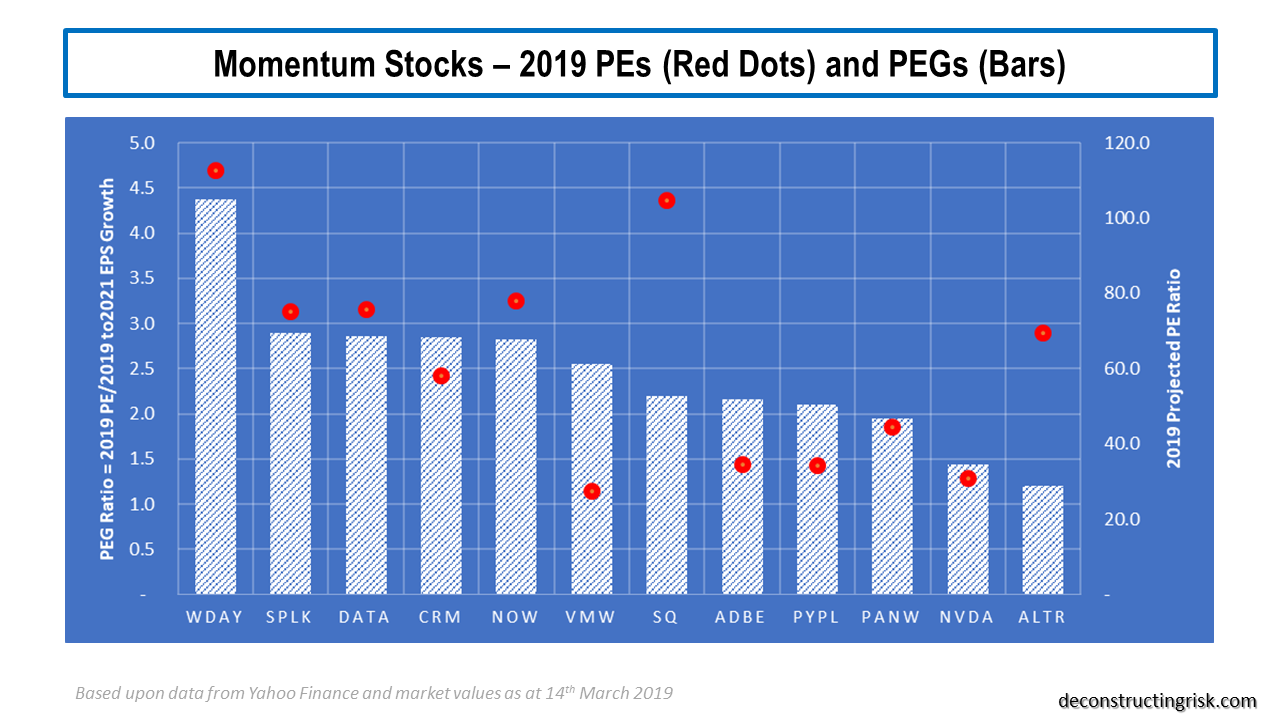
These are not cheap stocks (a PEG at or below 1 is considered undervalued). As per this FT article, the CEO of ServiceNow John Donahoe summed up the market’s love of some of these stocks by saying “investors value, first and foremost, growth”. By any measure, “value” in that quote is an understatement. I have never been good at playing hyped stocks, I just can’t get my head around these valuations. I do think it indicates that the market has got ahead of itself in its love of growth. I am going to focus on the two most “reasonably” valued stocks on a PEG basis in the graph above – Nvidia and Altair – by running my own numbers (I always distrust consensus figures).

I have posted on my journey with Nvidia previously, most recently here in November after their first revenue warning. Amazingly, even after a second big revenue warning in January from ongoing inventory and crypto-mining headwinds, the stock recovered from the 130’s into the 150’s before again trading into the 160’s in recent weeks following the Mellanox merger announcement. NVDA purchased Mellanox, an admired data centre equipment maker, at 25 times 2018 earnings (which seems reasonable given Mellanox is growing revenues at 25%).

NVDA’s recent quarterly results were not only worrying for its near 50% sequential decline in gaming but also for the 14% sequential decline in its data centre business, its second largest segment which was growing strongly. Despite management’s assertion that the gaming segment’s quarterly run rate is $1.4 billion (Q4 was below $1 billion), I am struggling to match analyst revenue estimates for FY2020 and FY2021. The most optimistic figures that I can get to (pre-Mellanox), assuming the crypto-mining boom is removed from the trend, is $10.3 billion and $12.8 billion for FY2020 and FY2021, 8% and 4% less than the consensus (pre-Mellanox), as below.

click to enlarge

Based upon management’s guidance on expenses (it is impressive that nearly 9,500 of their 13,300 employees are engaged in R&D), on the Mellanox deal closing in calendar year Q3 2019, and on 15 million shares repurchased each year, my estimates for EPS for FY2020 and FY2021 are $5.00 and $7.77 respectively (this FY2020 EPS figure is below analyst estimates which exclude any Mellanox contribution). At today’s share price that’s a PE of 33 and 21 for their FY2020 and FY2021. That may look reasonable enough, given the valuations above, for a combined business that will likely grow at 20%+ in the years thereafter. However, NVDA is a firm that has just missed its quarterly numbers by over 30% and it should be treated with a degree of “show me the money”. I think the consensus figures for FY2020 on NVDA are too optimistic so I shall watch NVDA’s progress with interest from the sidelines.

Altair Engineering (ALTR) is not the usual hyped firm. ALTR provide an integrated suite of multi-disciplinary computer aided engineering software that optimizes design performance across various disciplines which recently purchased an AI firm called Datawatch. ALTR is led by the impressive James Scapa and have built a highly specialised platform with significant growth potential. The revenue projections for the firm, including Datawatch and another acquisition SimSolid, with 2018 and prior on an ASC 605 basis and 2019 on an ASC 606 basis are below. The reason for the relatively flat Q/Q is the conversion of the Datawatch business to a SaaS basis and integration into the Altair platforms.

click to enlarge

For 2019 through 2021, my estimates for EPS are $0.62, $0.81 and $1.17 respectively (2019 and 2020 figures are over 10% higher than consensus). At the current share price of $38.32, that’s PE ratios of 63, 47, and 33. A rich valuation indeed. And therein lies the problem with high growth stocks. ALTR is a fantastic firm but its valuation is not. Another one for the watchlist.

Enervating Market

Wow, what a December this has been in the equity markets! Not a buyer in sight as we (effectively given the Christmas break) end the year at the S&P500 close today of 2,417. This really is a market to stay well away from. I suspect Q1 2019 will again be volatile until we get into earnings season and get a taste of the sector 2019 EPS projections (a minor relief rally from institutional funds allocating capital followed by more programme selling is my guess).

This recent post postulated that with small single digit EPS growth for 2019 and 2020, a slowing but non-recession scenario, a range of 2,500 to 2,300 on the S&P500. Well, we’re bang in that range now!! And the consensus is for more downside with the probability of a recession beginning next year raising by the day. Not even dovish statements today from John Williams of the New York Fed could tempt the buyers out of hibernation. The prospect of the demise of the Fed put has freaked the market out this week. My crude calculations estimate that a slow drop in operating EPS over 2019 of 6%, likely in a mild recession scenario, could result in the S&P500 testing 2,000.

I have been bearish on this market for several years (here, here and here are just recent examples) and although the majority of my assets have been in cash throughout 2018, the graph below from BoA Merrill Lynch, sends a shiver down my spine. As with most people, my equity positions have been hammered. According to BoA ML, the last time there was positive cash and negative equity, credit, and government returns in the same year was 1969. To plagiarize the old investing adage, it would take some monkey to call a bottom on this equity market any time soon.

Click to Enlarge

The outlook for 2019 is highly uncertain at the current point in time, nobody really knows how it will pan out and I’ll leave the musing over that topic to future posts. As this post in January highlighted, I do think quantitative tightening and the great unwinding of Central Bank easing experimentation is having some nasty unintended consequences.

At this time, I do find it insightful to look at recent movements in a historical context. If you look at the number of months with moves greater than or equal to +/-1% in the S&P500, the comparison between the decades is as below. The number of such moves are surprisingly consistent across the decades.

Click to Enlarge

If we assume that the 1970s and the 2000’s were extraordinary decades with the oil and financial crises respectively, then there could be more up months than down months due in the remainder of this decade for it to look more like the 1980s or the 1990s. A pretty flimsy analysis admittedly!

Continuing the theme of trying to end the year on a positive note, if we look at the historical months with moves of +/-5%, as below, it could be argued that the recent volatility is healthy as extended periods of reduced volatility prior to the dotcom bubble and the financial crisis didn’t end well!!

Click to Enlarge

That’s a happier note to end on (albeit rather pangloss).

A very happy and healthy Christmas to all who have spent any time reading my musings this year.

Bye-bye buy the dip

As my previous post illustrated, I got caught up with the notion that the fall in the equity market of late was an opportunity to buy into some names in the expectation that we’d go higher into year end. It’s clear that the classic “buy the dip” strategy that has worked so well in recent years, well, doesn’t work anymore. The graph below, from a report by equity strategist Michael Wilson of Morgan Stanley, has been widely cited to illustrate the failure of the strategy in 2018.

click to enlarge

Wilson commented that “such market behaviour is rare and in the past has coincided with official bear markets (20 percent declines), recessions, or both.” There is much discussion amongst commentators about whether we are entering, or indeed have entered, a bear market. I like the simplicity of the argument by Peter Oppenheimer, another equity strategist this time at Goldman Sachs. Oppenheimer argues that a decline in corporate profits in 2019 implies a recession in the US and as a recession is unlikely in 2019, he expects corporate profits to continue to grow, albeit at a much-reduced pace.

As pointed out by Wilson, we will not know the answer about where corporate profits are going until firms report Q4 and guide for 2019. He did also say that equity analysts are always slow off the mark as they wait for firms to reluctantly report on bad news. The after the fact downgrades on NVDA are testament to that! With some commentators calling the bottom around 2,550 to 2,600 on the S&P500, it looks unlikely that there will be any major upside in the market until there is more clarity on Fed policy and the trade issues with China.

If the market moving up depends upon Fed Chairman Powell indicating a policy change to “one and wait” or for a breakthrough at the G20 on trade, then I think we’ll go down further or, at best, sideways. If there is some modest indicator that the pace of interest rate rises in 2019 will be data dependent from Powell and the G20 meeting results in a short-term cease-fire between the US and China, then markets could find a bottom and stabilize. Whatever about the likelihood of the Fed rescuing the market (unlikely in my opinion), I fear that any meaningful relaxation in US-China tensions is against the play-book of the Orange One in the White House. The rhetoric from side-kick Pence at the weekend with language indicating China was leading other Asian countries into debt bondage does not bode well for next week’s G20 summit.

On China, I really like Ray Dalio’s explanation of the fundamental difference between the Chinese and US system (here is just one example of his latest thoughts), being a top down versus a bottom up approach. As Dalio explained it, the Chinese place an importance on family and paternal direction as opposed to the US adoration of the individual above all else. Unfortunately, I doubt that the current US leadership has the intellect to nuance a workable resolution between these two philosophies.

Following on from the analysis in this post on peak quarterly earnings, the current market narrative is that the EPS estimates for 2019 and 2020 will come down over the coming months. Currently S&P is showing a 11% projected increase for 2019 operating EPS for the S&P500 (13% on a reported EPS basis). The current market jitters indicate the market view those figures as unrealistic. Oppenheimer indicated that Goldman Sachs is currently thinking about a 6% and a 4% growth in EPS for 2019 and 2020 respectively is more realistic. Wilson indicted Morgan Stanley are projecting EPS growth for 2019 in the low single digits.

Given that estimates usually increase over time in the good years and decease in the bad years, I am going to assume a 3% and 1% increase in operating EPS for 2019 and 2020 respectively in this no recession but slowing growth scenario. Given that forward multiples would also decline in such a slowing environment (I have assumed to a modest 14), I estimate year-end targets for the S&P500 for 2019 and 2020 of 2,500 and 2,300 respectively, a decline of 6% and 13% respectively over the S&P500 today! The graph below shows the scenario as described.

click to enlarge

Economies generally don’t have slow gentle soft landings, it’s nearly always turbulent. Just look at the chart above to see how improbable the gentle scenario is compared to history. We need a major boast, such as a comprehensive resolution of the US-China trade issue, to maintain the bull market. Otherwise, I suspect the great EPS growth party is over.

Interestingly, Morgan Stanley also highlighted the headwind of quantitative tightening, as per the graph below, on the current market fall. I last discussed this issue in this post in January.

click to enlarge

No more buy the dip for a while yet I fear…….


Peak Earnings?

With the S&P500 down 9% off its high this month after last week, the question everybody is asking is whether this is a buying opportunity or the beginning of a new phase in the market. I have no idea. Nobody really does. I suspect this week will be bumpy but will rally off Fridays’ lows as there is some cheap names who have been hit hard. I have been modestly dipping my toe in on some names but am waiting before making any big moves. I hope to post on a few of the stocks regularly mentioned in this blog in the coming weeks.

The underlying concerns about the global economy and trade, the impact of US rate increases and quantitative tightening, Italy, to name but a few, have been and continue to be real issues to consider. The fact that the market has turned on a penny and is now all worried about the issues it shrugged off a few weeks ago is, well just how markets are!

What I do know is that this bull market has all been about earnings and margin growth, nothing else matters. So, I took the latest operating EPS and sales estimates for 2019 from S&P, extrapolated them into 2020, assuming a modest slowing of the EPS growth. These operating margin figures and assumed sales figures form the basis of Scenario 1. Stressed operating margin and sales formed the basis for Scenarios 2 and 3, with Scenario 2 falling back to the 2013-17 average operating margin of 9.5% and Scenario 3 falling more severely to the 2008-18 average of 8.75%. The graph below shows the operating margin assumptions in a historical context for each scenario.

click to enlarge

Assuming a price for the S&P500 as per Friday’s close of 2,659, the EPS figures with respective trailing and future 12-month PEs are as per the graphs below.

click to enlarge

click to enlarge

click to enlarge

So, if the current operating estimates for 2019 stand up and continue into 2020 as per Scenario 1, then I would say the current dip is a buying opportunity with a forward 2019 and 2020 PE of 15 and 14 respectively. If, however, you feel that we have reached peak earnings and a modest enough EPS retrenchment over 2019 and 2020 is likely as per Scenario 2, then the current S&P500 level looks vulnerable to further downside as the implied forward PEs of 17.5 and 18.7 for 2019 and 2020 look rich in a downward trending EPS environment. If, as per Scenario 3, the EPS retrenchment is more severe, then we are in for a very bumpy ride with another 15% to 25% downside possible.

To state the obvious, the current market focus is all about the earnings outlook for 2019 and 2020. The mid-terms over the next few weeks will be another factor to consider. It will be interesting to see if the market focus moves away from the economic prospects over the next few years and more towards 2018 bonuses and end of year window dressing as this quarter progresses!