Tag Archives: corporate profits

Enervating Market

Wow, what a December this has been in the equity markets! Not a buyer in sight as we (effectively given the Christmas break) end the year at the S&P500 close today of 2,417. This really is a market to stay well away from. I suspect Q1 2019 will again be volatile until we get into earnings season and get a taste of the sector 2019 EPS projections (a minor relief rally from institutional funds allocating capital followed by more programme selling is my guess).

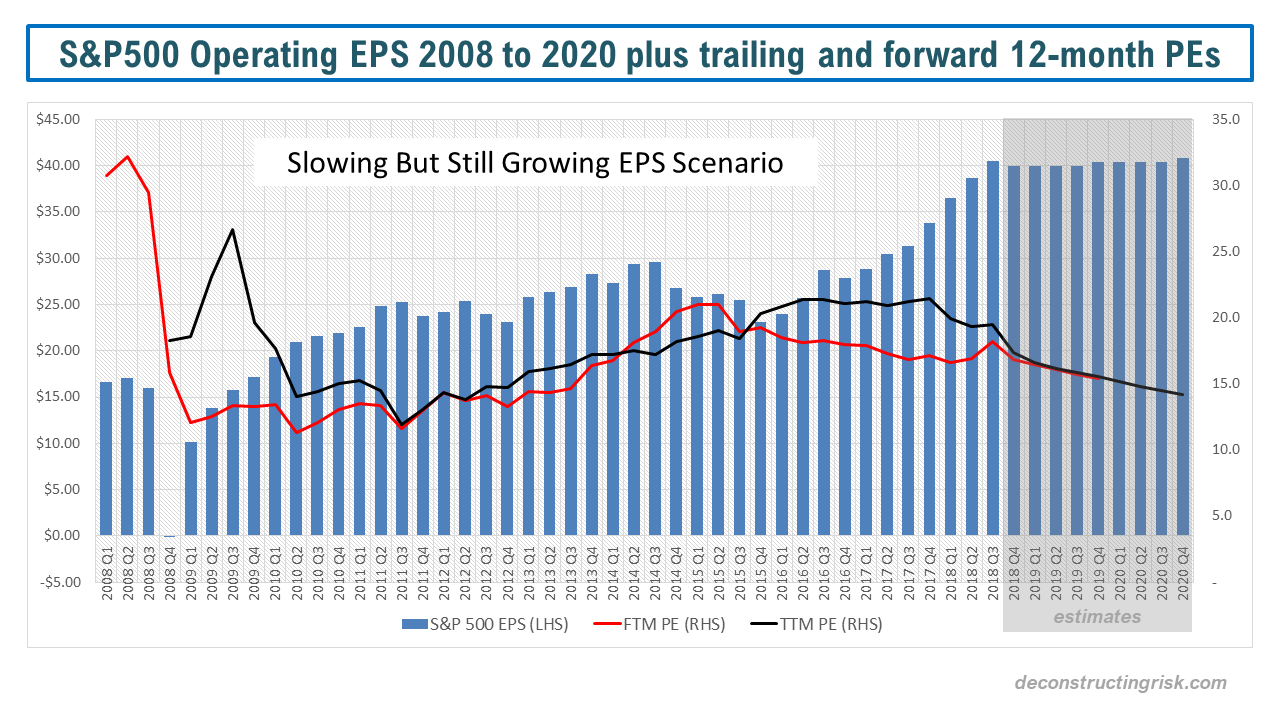
This recent post postulated that with small single digit EPS growth for 2019 and 2020, a slowing but non-recession scenario, a range of 2,500 to 2,300 on the S&P500. Well, we’re bang in that range now!! And the consensus is for more downside with the probability of a recession beginning next year raising by the day. Not even dovish statements today from John Williams of the New York Fed could tempt the buyers out of hibernation. The prospect of the demise of the Fed put has freaked the market out this week. My crude calculations estimate that a slow drop in operating EPS over 2019 of 6%, likely in a mild recession scenario, could result in the S&P500 testing 2,000.

I have been bearish on this market for several years (here, here and here are just recent examples) and although the majority of my assets have been in cash throughout 2018, the graph below from BoA Merrill Lynch, sends a shiver down my spine. As with most people, my equity positions have been hammered. According to BoA ML, the last time there was positive cash and negative equity, credit, and government returns in the same year was 1969. To plagiarize the old investing adage, it would take some monkey to call a bottom on this equity market any time soon.

Click to Enlarge

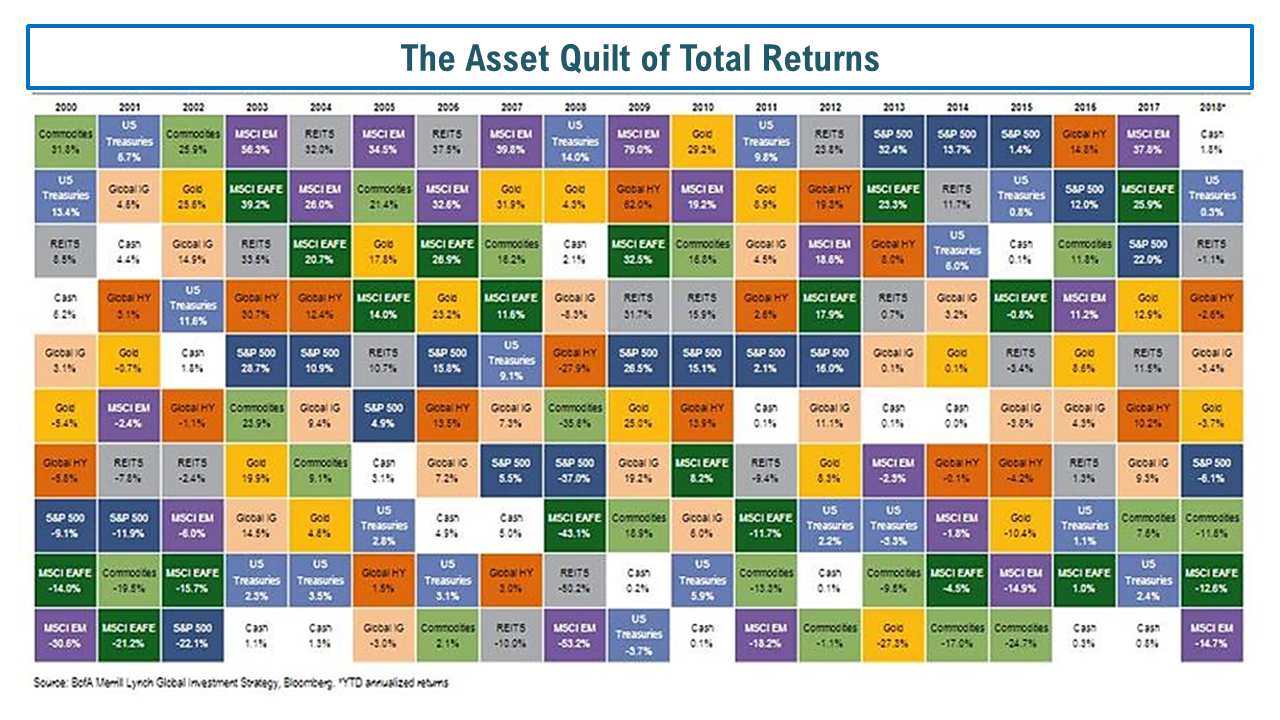
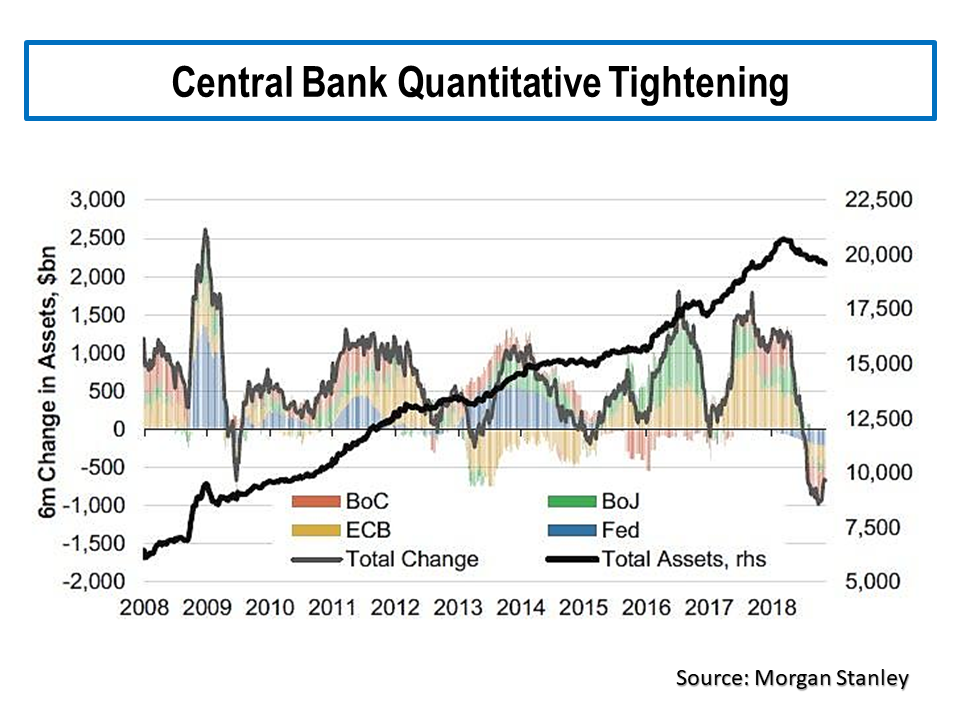
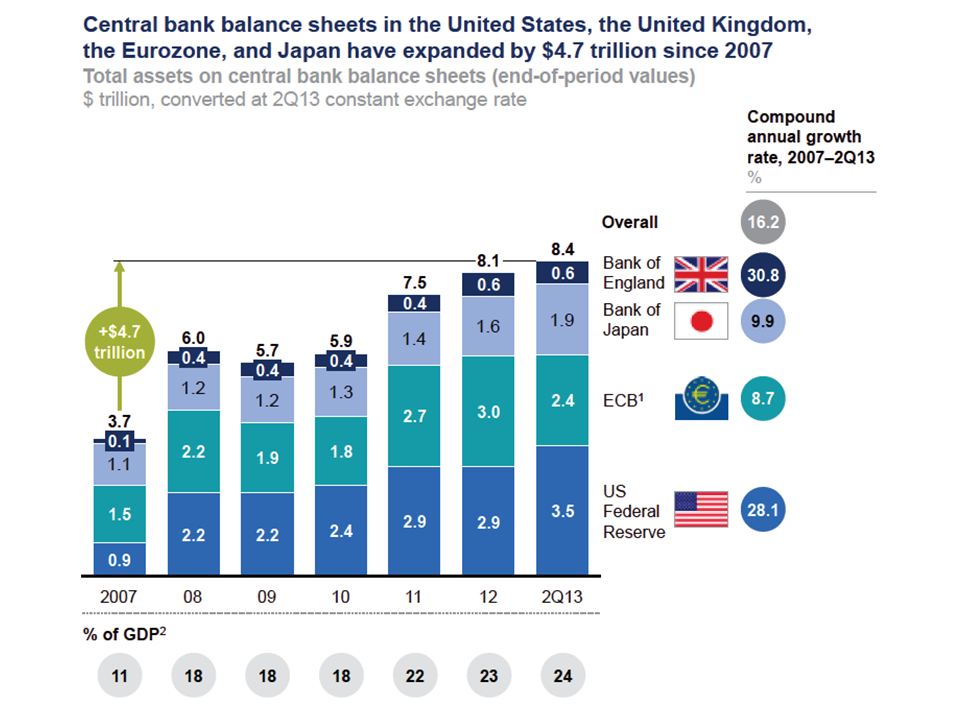
The outlook for 2019 is highly uncertain at the current point in time, nobody really knows how it will pan out and I’ll leave the musing over that topic to future posts. As this post in January highlighted, I do think quantitative tightening and the great unwinding of Central Bank easing experimentation is having some nasty unintended consequences.

At this time, I do find it insightful to look at recent movements in a historical context. If you look at the number of months with moves greater than or equal to +/-1% in the S&P500, the comparison between the decades is as below. The number of such moves are surprisingly consistent across the decades.

Click to Enlarge

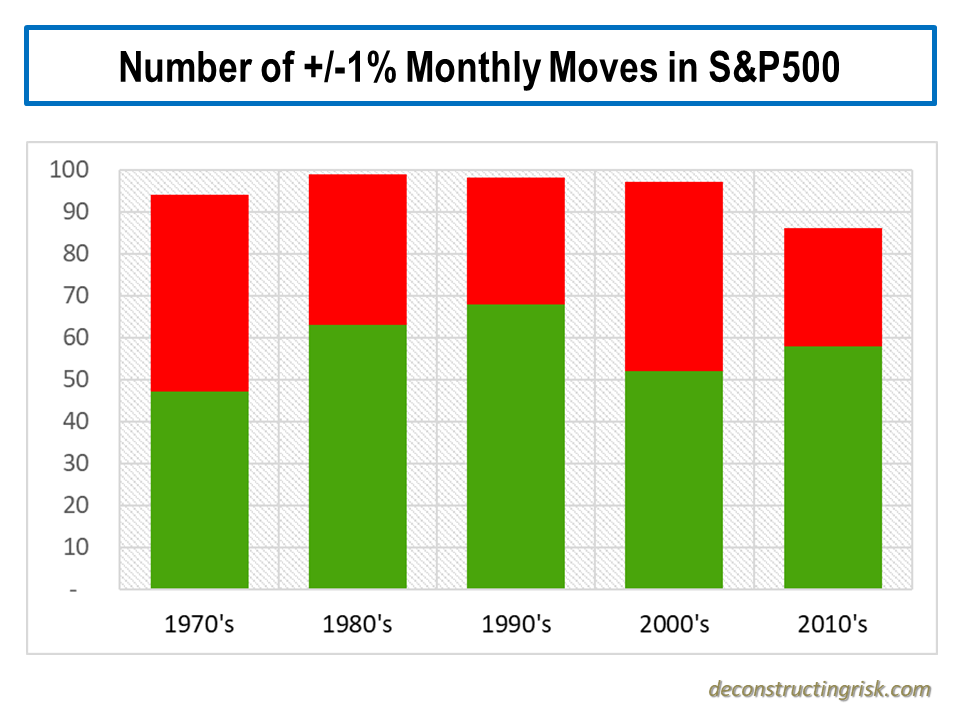
If we assume that the 1970s and the 2000’s were extraordinary decades with the oil and financial crises respectively, then there could be more up months than down months due in the remainder of this decade for it to look more like the 1980s or the 1990s. A pretty flimsy analysis admittedly!

Continuing the theme of trying to end the year on a positive note, if we look at the historical months with moves of +/-5%, as below, it could be argued that the recent volatility is healthy as extended periods of reduced volatility prior to the dotcom bubble and the financial crisis didn’t end well!!

Click to Enlarge

That’s a happier note to end on (albeit rather pangloss).

A very happy and healthy Christmas to all who have spent any time reading my musings this year.

Bye-bye buy the dip

As my previous post illustrated, I got caught up with the notion that the fall in the equity market of late was an opportunity to buy into some names in the expectation that we’d go higher into year end. It’s clear that the classic “buy the dip” strategy that has worked so well in recent years, well, doesn’t work anymore. The graph below, from a report by equity strategist Michael Wilson of Morgan Stanley, has been widely cited to illustrate the failure of the strategy in 2018.

click to enlarge

Wilson commented that “such market behaviour is rare and in the past has coincided with official bear markets (20 percent declines), recessions, or both.” There is much discussion amongst commentators about whether we are entering, or indeed have entered, a bear market. I like the simplicity of the argument by Peter Oppenheimer, another equity strategist this time at Goldman Sachs. Oppenheimer argues that a decline in corporate profits in 2019 implies a recession in the US and as a recession is unlikely in 2019, he expects corporate profits to continue to grow, albeit at a much-reduced pace.

As pointed out by Wilson, we will not know the answer about where corporate profits are going until firms report Q4 and guide for 2019. He did also say that equity analysts are always slow off the mark as they wait for firms to reluctantly report on bad news. The after the fact downgrades on NVDA are testament to that! With some commentators calling the bottom around 2,550 to 2,600 on the S&P500, it looks unlikely that there will be any major upside in the market until there is more clarity on Fed policy and the trade issues with China.

If the market moving up depends upon Fed Chairman Powell indicating a policy change to “one and wait” or for a breakthrough at the G20 on trade, then I think we’ll go down further or, at best, sideways. If there is some modest indicator that the pace of interest rate rises in 2019 will be data dependent from Powell and the G20 meeting results in a short-term cease-fire between the US and China, then markets could find a bottom and stabilize. Whatever about the likelihood of the Fed rescuing the market (unlikely in my opinion), I fear that any meaningful relaxation in US-China tensions is against the play-book of the Orange One in the White House. The rhetoric from side-kick Pence at the weekend with language indicating China was leading other Asian countries into debt bondage does not bode well for next week’s G20 summit.

On China, I really like Ray Dalio’s explanation of the fundamental difference between the Chinese and US system (here is just one example of his latest thoughts), being a top down versus a bottom up approach. As Dalio explained it, the Chinese place an importance on family and paternal direction as opposed to the US adoration of the individual above all else. Unfortunately, I doubt that the current US leadership has the intellect to nuance a workable resolution between these two philosophies.

Following on from the analysis in this post on peak quarterly earnings, the current market narrative is that the EPS estimates for 2019 and 2020 will come down over the coming months. Currently S&P is showing a 11% projected increase for 2019 operating EPS for the S&P500 (13% on a reported EPS basis). The current market jitters indicate the market view those figures as unrealistic. Oppenheimer indicated that Goldman Sachs is currently thinking about a 6% and a 4% growth in EPS for 2019 and 2020 respectively is more realistic. Wilson indicted Morgan Stanley are projecting EPS growth for 2019 in the low single digits.

Given that estimates usually increase over time in the good years and decease in the bad years, I am going to assume a 3% and 1% increase in operating EPS for 2019 and 2020 respectively in this no recession but slowing growth scenario. Given that forward multiples would also decline in such a slowing environment (I have assumed to a modest 14), I estimate year-end targets for the S&P500 for 2019 and 2020 of 2,500 and 2,300 respectively, a decline of 6% and 13% respectively over the S&P500 today! The graph below shows the scenario as described.

click to enlarge

Economies generally don’t have slow gentle soft landings, it’s nearly always turbulent. Just look at the chart above to see how improbable the gentle scenario is compared to history. We need a major boast, such as a comprehensive resolution of the US-China trade issue, to maintain the bull market. Otherwise, I suspect the great EPS growth party is over.

Interestingly, Morgan Stanley also highlighted the headwind of quantitative tightening, as per the graph below, on the current market fall. I last discussed this issue in this post in January.

click to enlarge

No more buy the dip for a while yet I fear…….


Path of profits

The increase in corporate profits has been one of the factors behind the market run-up (as per posts such as here and here from last year). McKinsey have a new report out called “Playing to win: The new global competition for corporate profits” that predicts a decrease of the current rate of 10% of global GDP back to the 1980 level of below 8% by 2025.

Factors that McKinsey cite for the decline are that the impact of global labour arbitrage and falling interest rates have reached their limits. McKinsey also predict that competitive forces from 2 sources will drive down profits, as per the following extract:

“On one side is an enormous wave of companies based in emerging markets. The most prominent have been operating as industrial giants for decades, but over the past ten to 15 years, they have reached massive scale in their home markets. Now they are expanding globally, just as their predecessors from Japan and South Korea did before them. On the other side, high-tech firms are introducing new business models and striking into new sectors. And the tech (and tech-enabled) firms giants themselves are not the only threat. Powerful digital platforms such as Alibaba and Amazon serve as launching pads for thousands of small and medium-sized enterprises, giving them the reach and resources to challenge larger companies.”

Interesting graphs from the report included those below. One shows the factors contributing to the rise in US corporate profits, as below.

click to enlargeMGI Historical US Corporate Profit Components 1980 to 2013

Another graph shows the variability and median return on invested capital (ROIC) from US firms from 1964 to 2013, as below.

click to enlargeMGI Historical ROIC US Corporates 1964 to 2013

Another shows the reduction in labour inputs by country, as below.

click to enlargeMGI Labor Share of Total Income 1980 to 2012

Another shows the growth in corporate sales by region from 1980 to 2013, as below.

click to enlargeMGI Global Corporate Sales By Region

Another shows the ownership and the ROIC profile of the new competitors, as below.

click to enlargeMGI The New Competitors ownership split & ROIC by region

And finally the graph below shows McKinseys’ projections for EBITDA, EBIT, operating profit, and net income to 2025.

click to enlargeMGI Global Corporate Profits 1980 2013 2025

QE effects and risks: McKinsey

McKinsey had an interesting report on the impact of QE and ultra low interest rates. There was nothing particularly earth shattering about what they said but the report has some interesting graphs and commentary on the risks of the current global monetary policies.

The main points highlighted included:

  • By the end of 2012, governments in the US, the UK, and the Eurozone had collectively benefited by $1.6 trillion (through reduced debt service costs and increased central bank profits) whilst households have lost $630 billion in net interest income (impacting those more dependent upon fixed income returns).
  • Non-financial companies across the US, the UK, and the Eurozone have benefited by $710 billion through lower debt service costs. This boosted corporate profits by about 5%, 3% and 3% for the US, UK and Eurozone respectively. The 5% US boost accounted for approx 25% of profit growth for US corporates.
  • Effective net interest margins for Eurozone banks have declined significantly and their cumulative loss of net interest income totalled $230 billion between 2007 and 2012. Banks in the US have experienced an increase in effective net interest margins by $150 billion as interest paid on deposits and other liabilities has declined more than interest received on loans and other assets. The experience of UK banks falls between these two extremes.
  • Life insurance companies, particularly in several European countries where guaranteed returns are the norm (e.g. Germany), are being squeezed by ultra-low interest rates. If the low interest-rate environment were to continue for several more years, many insurers who offered guaranteed returns would find their survival threatened.
  • The impact of ultra-low rate monetary policies on financial asset prices is ambiguous. Bond prices rise as interest rates decline and, between 2007 and 2012, the value of sovereign and corporate bonds in the US, the UK, and the Eurozone increased by $16 trillion.
  • Little conclusive evidence that ultra-low interest rates have boosted equity markets was found.
  • At the end of 2012, house prices may have been as much as 15 percent higher in the US and the UK than they otherwise would have been without ultra-low interest rates.

Some interesting graphs from the report are reproduced below:

click to enlargeCentral Bank Balance Sheets 2007 to Q2 2013

click to enlargeImpact of lower interest rates 2007 to 2012

 click to enlargeEffective Bank Margins 2007 to 2012

click to enlargeImplied Real Cost of Equity US 1964 to 2013

If the current low rate environment were to continue, McKinsey highlight European life insurers and banks as being under stress and believe that each will need to change their business models to survive. Defined-benefit pension schemes would be another area under continuing stress. A continuation of the search for yield for investors may lead to increased leverage (and we know how that ends!).

Increases in interest rate would have “important implications for different sectors in advanced economies and for the dynamics of the global capital market.” Not least, many working in investment firms and banks will never have experienced an era of increased rates in their careers to date! The first impact is likely to be an increase in volatility. Such volatility combined with market price reductions in interest sensitive assets may have an impact across the market and asset classes. McKinsey state that “a risk that volatility could prove to be a headwind for broader economic growth as households and corporations react to uncertainty by curtailing their spending on durable goods and capital investment.

click to enlargeS&P movement to tapering

The report highlight the average maturity on sovereign debt has lengthened with 5.4 years, 6.5 years, 6 years and 14.6 years for the US, Germany, Eurozone and the UK. Higher interest rates will obviously mean higher interest payments for governments. A 3% increase in US 10 year rates would mean $75 billion more in repayments or 23% higher than 2012. If, as seems likely, rates increase in the US first, the impact of capital outflows on other governments could be material, particularly in the Eurozone. A resulting Euro depreciation is highlighted (although I am not sure this would be too unwelcome currently in Europe).

click to enlargeImpact of 1% rate increase on household income

Mark to market losses on fixed income portfolios will follow. Some, such as many non-life insurers have purposely run a short asset:liability mismatch in anticipation of rates increasing. Others such as life insurers or banks may not be in such a fortunate position. Hopefully, the impact of improved economies which is assumed to have accommodated the rise in interest rates will solve all ills.