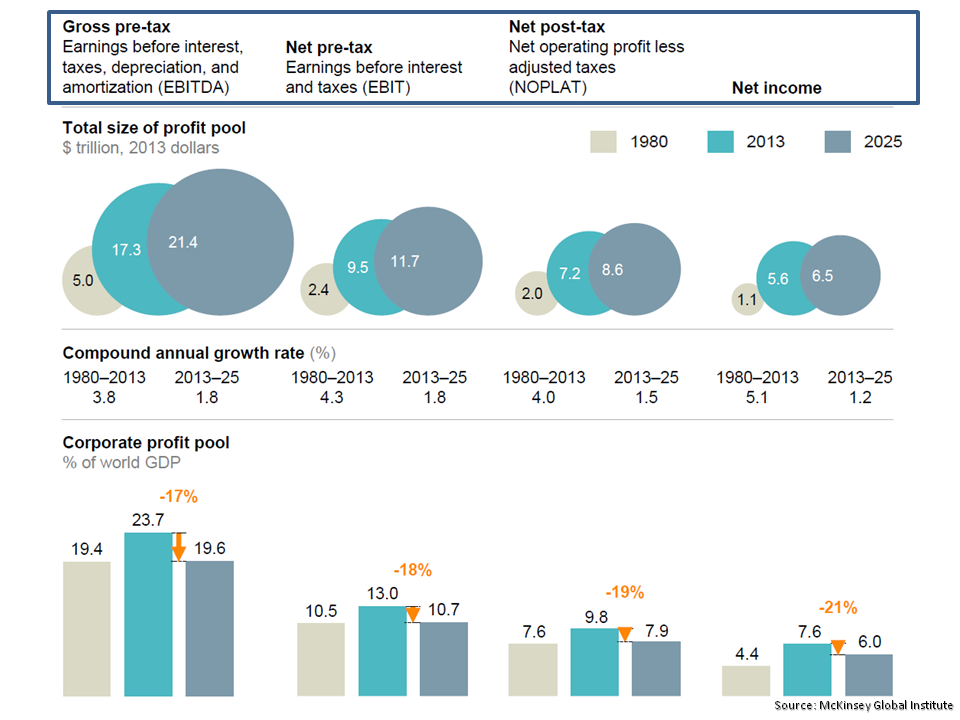
The increase in corporate profits has been one of the factors behind the market run-up (as per posts such as here and here from last year). McKinsey have a new report out called “Playing to win: The new global competition for corporate profits” that predicts a decrease of the current rate of 10% of global GDP back to the 1980 level of below 8% by 2025.
Factors that McKinsey cite for the decline are that the impact of global labour arbitrage and falling interest rates have reached their limits. McKinsey also predict that competitive forces from 2 sources will drive down profits, as per the following extract:
“On one side is an enormous wave of companies based in emerging markets. The most prominent have been operating as industrial giants for decades, but over the past ten to 15 years, they have reached massive scale in their home markets. Now they are expanding globally, just as their predecessors from Japan and South Korea did before them. On the other side, high-tech firms are introducing new business models and striking into new sectors. And the tech (and tech-enabled) firms giants themselves are not the only threat. Powerful digital platforms such as Alibaba and Amazon serve as launching pads for thousands of small and medium-sized enterprises, giving them the reach and resources to challenge larger companies.”
Interesting graphs from the report included those below. One shows the factors contributing to the rise in US corporate profits, as below.
click to enlarge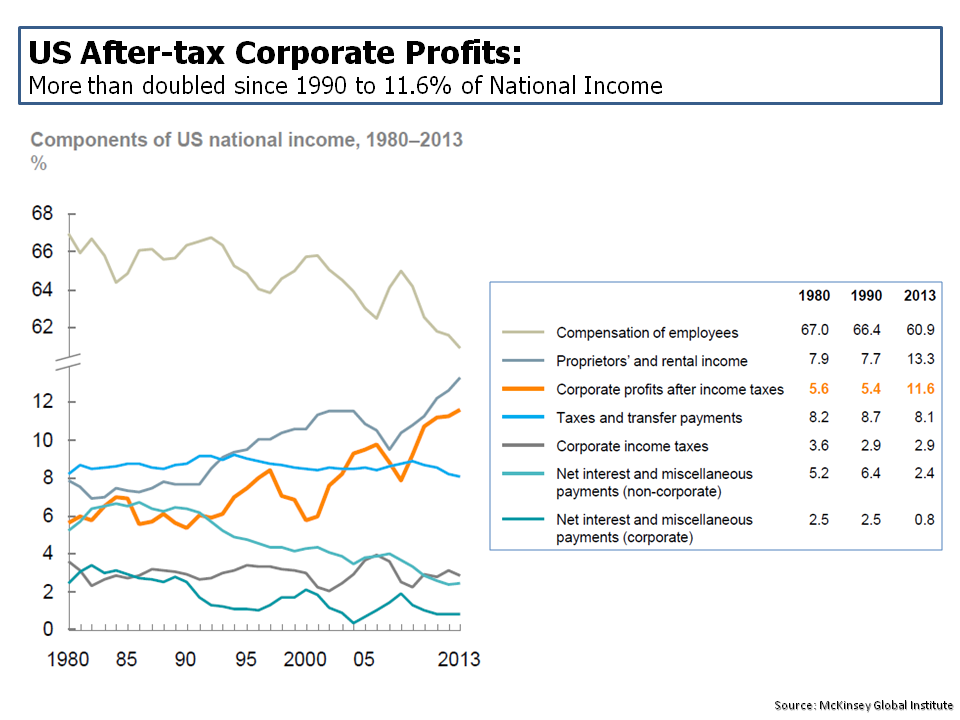
Another graph shows the variability and median return on invested capital (ROIC) from US firms from 1964 to 2013, as below.
click to enlarge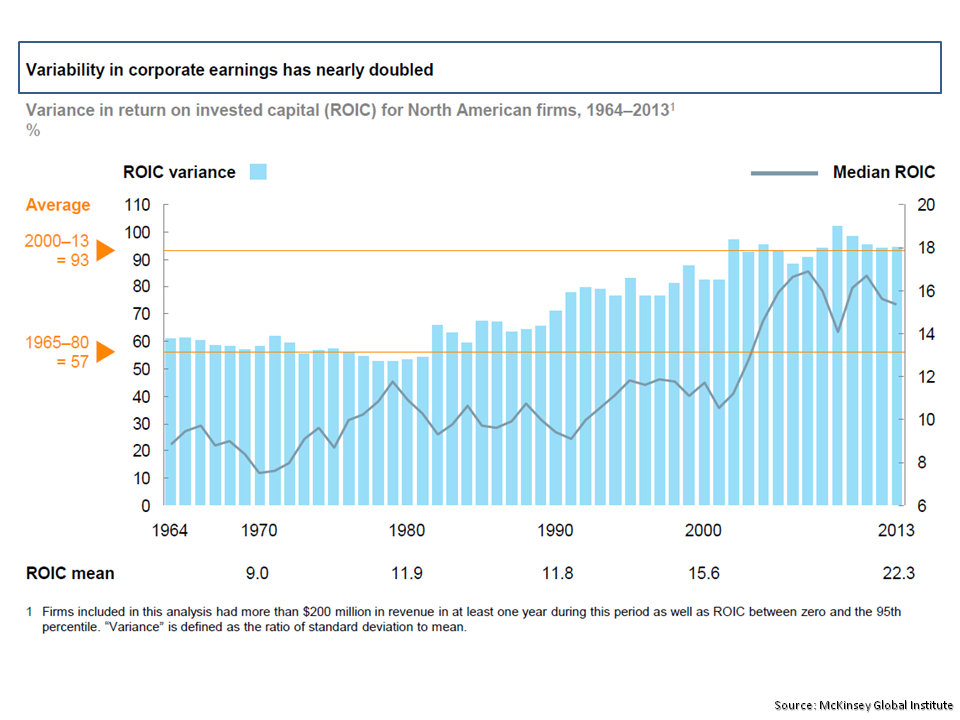
Another shows the reduction in labour inputs by country, as below.
click to enlarge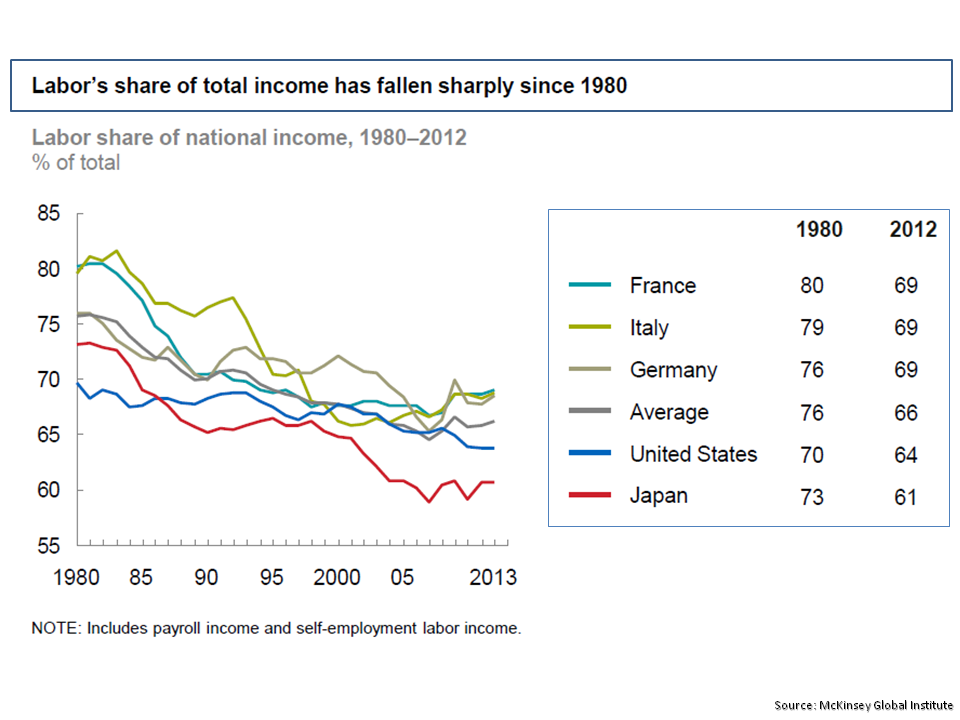
Another shows the growth in corporate sales by region from 1980 to 2013, as below.
click to enlarge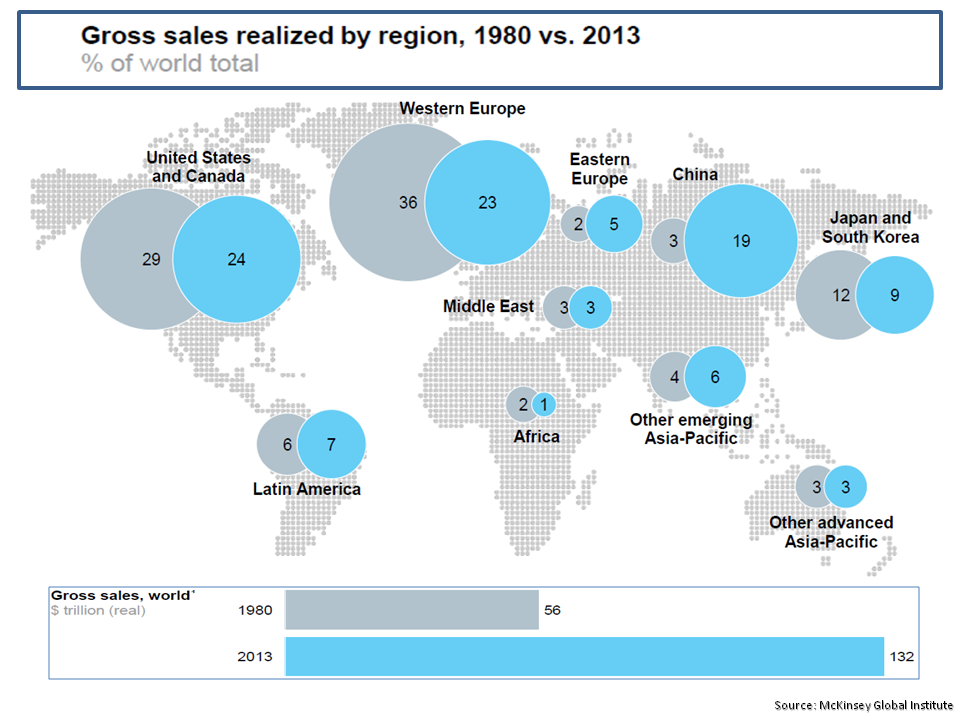
Another shows the ownership and the ROIC profile of the new competitors, as below.
click to enlarge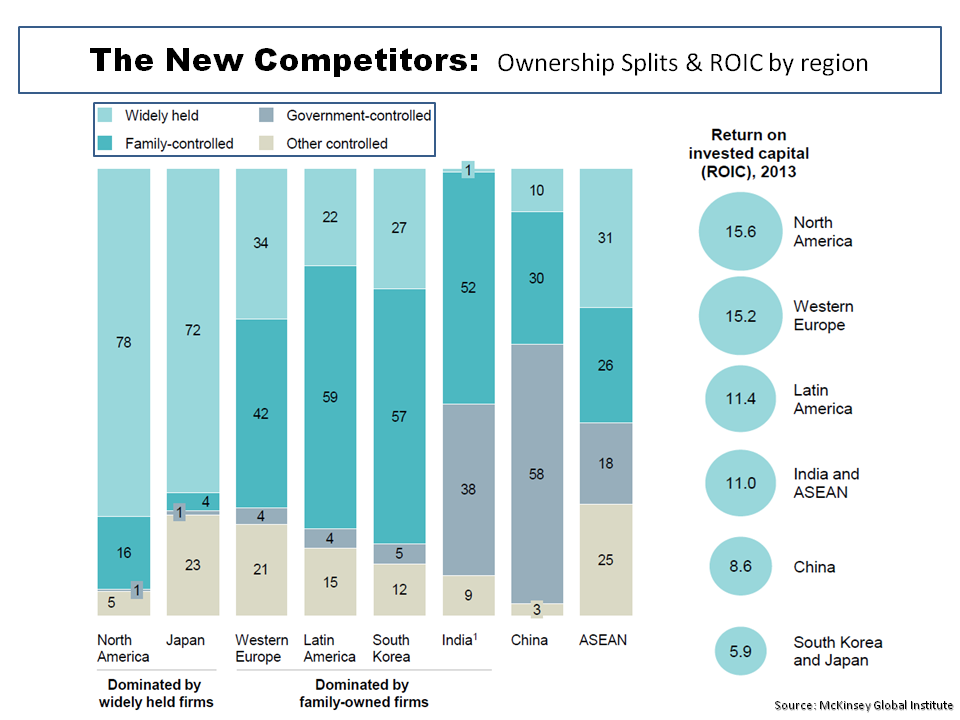
And finally the graph below shows McKinseys’ projections for EBITDA, EBIT, operating profit, and net income to 2025.
click to enlarge