Tag Archives: AIG

AIG: Better Days

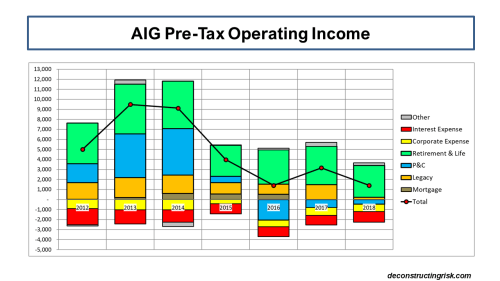
It’s been 2 years since I posted on AIG and it has been an eventful 2 years. A new management team (again) has been installed, led by industry veteran Brian Duperreault, to try to turn this stubborn ship around. The results, as below, show the scale of the task. Reduced investment returns, reducing legacy and asset balances, and poor reinsurance protections are just a few of the reasons behind the results, in addition to the obvious poor underwriting results.

click to enlarge

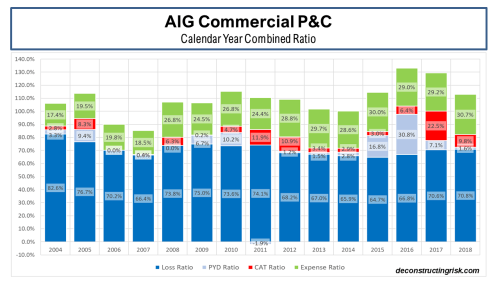
Oversize risks from the previous Go Large strategy have been disastrous for both the catastrophic losses and reserve strengthening on the commercial P&C business, as the results below show. Duperreault and his team have been busy working on refocusing the underwriting philosophy, modernizing systems and analytics, bringing in talent (including buying Validus), redesigning reinsurance protections and reshaping the portfolio.

click to enlarge

In their latest quarterly call, the new management team is boldly predicting an underwriting profit on the general insurance business (commercial and consumer) in 2019, assuming a catastrophe load of less than 5% and reductions in loss and expense ratios, which will require a +10% improvement in the 2018 result. In a sector where competitors have long since evolved (some use AI to optimise their portfolios and returns) and the alchemy of low return capital providers is ever present, they have set themselves an aggressive target.

click to enlarge

Given the current share price just below $42, its trading around 76% of the adjusted book value. If all things go well, and some recent headwinds (e.g. reserve strengthening) are tamed, I can see how a pre-tax income target of $3.5 billion to $4 billion and an adjusted income diluted EPS of $4.00 to $4.50 is achievable. These targets are roughly where analysts are for 2019, returning to EPS results achieved over 5 years ago. I concur on the targets but think the time-frame may be optimistic, another year of clean-up looks more likely.

It will be interesting to see how the year progresses.

Insurance M&A Pickup

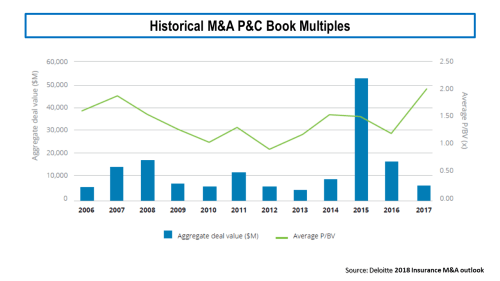
It’s been a while since I posted on the specialty insurance sector and I hope to post some more detailed thoughts and analysis when I get the time in the coming months. M&A activity has picked up recently with the XL/AXA and AIG/Validus deals being the latest examples of big insurers bulking up through M&A. Deloitte has an interesting report out on some of the factors behind the increased activity. The graph below shows the trend of the average price to book M&A multiples for P&C insurers.

click to enlarge

As regular readers will know, my preferred metric is price to tangible book value and the exhibit below shows that the multiples on recent deals are increasing and well above the standard multiple around 1.5X. That said, the prices are not as high as the silly prices of above 2X paid by Japanese insurers in 2015. Not yet anyway!

click to enlarge

Unless there are major synergies, either on the operating side or on the capital side (which seems to be AXA’s justification for the near 2X multiple on the XL deal), I just can’t see how a 2X multiple is justified in a mature sector. Assuming these firms can earn a 10% return on tangible assets over multiple cycles, a 2X multiple equates to 20X earnings!

Time will tell who the next M&A target will be….

A Tale of Two Insurers

My negativity on the operating prospects for the reinsurance and specialty insurance sector has been articulated many times previously in this blog. Many of the same factors are impacting the broader commercial insurance market. Pricing conditions in the US and globally can be seen in the graph below.

click to enlargeUS and Global Commercial Insurance Pricing

Two insurers, at different ends of the size scale, which I have previously posted on, are AIG (more recently here and here) and Lancashire (more recently here and here). Given that a lot has happened to each since I last posted on them, I thought a quick update on both would give an interesting insight into the current market.

First up is AIG who have been under a lot of pressure from shareholders to unlock value, including a break-up plan for the insurance giant from the opportunistic rascal Carl Icahn. The graph below shows a breakdown of recent operating results (as ever with AIG longer term comparisons are hampered by their ever changing reporting segments). The improvement in the UGC mortgage insurance business has been dwarfed by the poor non-life results which were impacted by a significant reserve strengthening charge.

click to enlargeAIG PreTax Operating Income 2012 to 2015

In January, Peter Hancock (the 5th CEO since Hank Greenberg left in 2005) announced a new strategic plan to the end of 2017, the main points of which are

  • Return at least $25 billion of capital to shareholders through dividends and share buy-backs from operating profits, divestitures and other actions such as monetizing future life profits by $4-5 billion through reinsurance purchases.
  • Enhance transparency by separating into an operating portfolio with a goal of over 10% return on equity and a legacy portfolio that will focus on return of capital. Reorganize into at least nine modular, more self-contained business units to enhance accountability, transparency, and strategic flexibility.
  • Reduce general operating expenses by $1.6 billion, 14 percent of the 2015 expenses.
  • Improve the commercial P&C accident year loss ratio by six points.
  • Pursue an active divestiture program, including initially the 20% IPO of UGC.

The non-life reserve charge in 2015 amounted to $3.6 billion. 60% of the charge came from the (mainly US) casualty business, 16% from financial lines (again mainly in the US) and 15% from the run-off business. After the last material reserve strengthening in 2010, the worrying aspect of the 2015 charge is that approximately two thirds comes from accident years not yet 10 years old (which is relatively immature for long tail casualty business particularly when 42% of the charge is on excess casualty business). The impact of the reserve hikes on the commercial P&C segment can be clearly seen in the graph below.

click to enlargeAIG Commercial P&C Combined Ratio Breakdown 2008 to 2015

Perhaps the most aggressive target, given current market conditions, in the strategic plan is the 6% improvement in the commercial P&C accident year loss ratio by the end of 2017. The plan includes exiting approximately $1 billion of US casualty business, including poorly performing excess casualty business, primary and excess auto liability, health-care and financial lines business. Growth of $0.5 billion is been targeted in multi-national, financial lines, property upper middle market and major accounts which involve specialist engineering capabilities, international casualty and emerging risks such as cyber and M&A insurance. AIG also recently announced a two year reinsurance deal with Swiss Re on their US casualty book (it looks like a 25% quota share). The scale of the task for AIG in meeting this target can be seen in the exhibit below which takes a number of slides from the strategy presentation.

click to enlargeAIG Commercial P&C Metrics

I was struck by a quote from the firm on their turnaround plan – “We will use the data and analytical tools we have invested in to significantly differentiate and determine where we should focus our resources.” I suspect that every significant insurer would claim to have, or at least aspire to have, similar analytical capabilities. Big data and analytical driven underwriting is undoubtedly the future for large insurers with access to large amounts of quality data. Fortune had an interesting recent article on the analytical firm Palantir who are working with some insurers on sharpening their underwriting criteria for the social media age. An analyst in Citi even suggested that Goggle should look at buying AIG as a fintech play. The entry of the big internet firms into the insurance sector seems inevitable in some form or other, although I doubt AIG will be part of any such strategy.

As to the benefits of staying a large composite insurer, AIG cited an analysis commissioned by consultants Oliver Wyman supporting the benefits of diversification between the life and non-life business of AIG. Using the S&P consolidated model as a proxy, Oliver Wyman estimate a $7.5 billion capital benefit to AIG compared to separate life and non-life businesses, as envisaged in Icahn’s plan.

So, can AIG achieve the aggressive operational targets they have set themselves for the P&C business? Current market conditions present a considerable challenge. Combined with their recent results, an end of 2017 target for a 6% improvement is extremely aggressive. Too aggressive for my liking. However, the P&C results should improve somewhat over the short term (particularly if there is no more big reserve charges) and actions such as expense reductions, monetizing future life profits and divestitures will give AIG the fire power to hand out sweeties to shareholders. For those willing to take the punt, the return of a chunk of the $25 billion target in dividends and share buy-backs over the next 2 years for a firm with a current market value of $61 billion, trading at a 0.72 multiple to book value (trading around 0.92 of book less AOCI and DTA), may be too tempting to resist. It does have a certain allure…..

Lancashire, a London market specialty insurer and reinsurer with a mantra of disciplined underwriting, is at the opposite end of the scale spectrum with a niche focus. Long cherished by investors for its shareholder friendly dividend policies, Lancashire has been under pressure of late due to the heavy competition in its niche markets. The energy insurance sector, for example, has been described by the broker Willis as dismal with capacity chasing a smaller premium pool due to the turmoil in the oil market. A number of recent articles (such as here and here) highlight the dangers. Alex Maloney, the firm’s CEO, described the current market as “one of the most difficult trading environments during the last twenty years”. In addition, Lancashire lost its founder, Richard Brindle, in 2014 plus the CEO, the CFO and some senior underwriters of its Lloyds’ Cathedral unit in 2015.

The graph below shows the breakdown of reported historical calendar year combined ratios plus the latest accident year net loss ratio and paid ratio.

click to enlargeLancashire Ratio Breakdown 2008 to 2015

The underwriting discipline that Lancashire professes can be seen in the recent accident year loss ratios and in the 30% drop in gross written premiums (GWP), as per the graph below. The drop is more marked in net written premiums at 35% due to the increase in reinsurance spend to 25% of GWP (from approx 10% in its early years).

click to enlargeLancashire GWP Breakdown 2008 to 2015

The timely and astute increase in reinsurance protection spend can be seen in the decrease in their peak US aggregate exposures. The latest probable maximum loss (PML) estimates for their US peak exposures are approximately $200 million compared to historical levels of $300-350 million. Given the lower net premium base, the PML figures in loss ratio terms have only dropped to 40% from 50-60% historically. Lancashire summed up their reinsurance purchasing strategy as follows:

“Our outwards reinsurance programme provides a breadth and depth of cover which has helped us to strengthen our position and manage volatility. This helps us to continue to underwrite our core portfolio through the challenges posed by the cycle.”

As with AIG, the temptation for shareholders is that Lancashire will continue with their generous dividends, as the exhibit below from their Q4 2015 presentation shows.

click to enlargeLancashire Dividend History 2015

The other attraction of Lancashire is that it may become a take-over target. It currently trades at 1.4 times tangible book level which is rich compared to its US and Bermudian competitors but low compared to its peers in Lloyds’ which trade between 1.58 and 2.0 times tangible book. Lancashire itself included the exhibit below on tangible book values in its Q4 2015 presentation.

click to enlargeInsurance Tangible Book Value Multiple 2012 to 2015

It is noteworthy that there has been little activity on the insurance M&A front since the eye boggling multiples achieved by Amlin and HCC from their diversification hungry Japanese purchasers. Many in the market thought the valuations signaled the top of the M&A frenzy.

Relatively, AIG looks more attractive than Lancashire in terms of the potential for shareholder returns. However, fundamentally I cannot get away from current market conditions. Risk premia is just too low in this sector and no amount of tempting upside through dividends, buy-backs or M&A multiples can get me comfortable with the downside potential that comes with this market. As per the sentiment expressed in previous posts, I am happy with zero investment exposure to the insurance sector right now. I will watch this one play out from the sidelines.

Divine Diversification

There have been some interesting developments in the US insurance sector on the issue of systemically important financial institutions (SIFIs). Metlife announced plans to separate some of their US life retail units to avoid the designation whilst shareholder pressure is mounting on AIG to do the same. These events are symptoms of global regulations designed to address the “too big to fail” issue through higher capital requirements. It is interesting however that these regulations are having an impact in the insurance sector rather than the more impactful issue within the banking sector (this may have to do with the situation where the larger banks will retain their SIFI status unless the splits are significant).

The developments also fly in the face of the risk management argument articulated by the insurance industry that diversification is the answer to the ills of failure. This is the case AIG are arguing to counter calls for a breakup. Indeed, the industry uses the diversification of risk in their defences against the sector being deemed of systemic import, as the exhibit below from a report on systemic risk in insurance from an industry group, the Geneva Association, in 2010 illustrates. Although the point is often laboured by the insurance sector (there still remains important correlations between each of the risk types), the graph does make a valid point.

click to enlargeEconomic Capital Breakdown for European Banks and Insurers

The 1st of January this year marked the introduction of the new Solvency II regulatory regime for insurers in Europe, some 15 years after work begun on the new regime. The new risk based solvency regime allows insurers to use their own internal models to calculate their required capital and to direct their risk management framework. A flurry of internal model approvals by EU regulators were announced in the run-up to the new year, although the amount of approvals was far short of that anticipated in the years running up to January 2016. There will no doubt be some messy teething issues as the new regime is introduced. In a recent post, I highlighted the hoped for increased disclosures from European insurers on their risk profiles which will result from Solvency II. It is interesting that Fitch came out his week and stated that “Solvency II metrics are not comparable between insurers due to their different calculation approaches and will therefore not be a direct driver of ratings” citing issues such as the application of transitional measures and different regulator approaches to internal model approvals.

I have written many times on the dangers of overtly generous diversification benefits (here, here, here, and here are just a few!) and this post continues that theme. A number of the large European insurers have already published details of their internal model calculations in annual reports, investor and analyst presentations. The graphic below shows the results from 3 large insurers and 3 large reinsurers which again illustrate the point on diversification between risk types.

click to enlargeInternal Model Breakdown for European Insurers and Reinsurers

The reinsurers show, as one would expect, the largest diversification benefit between risk types (remember there is also significant diversification benefits assumed within risk types, more on that later) ranging from 35% to 40%. The insurers, depending upon business mix, only show between 20% and 30% diversification across risk types. The impact of tax offsets is also interesting with one reinsurer claiming a further 17% benefit! A caveat on these figures is needed, as Fitch points out; as different firms use differing terminology and methodology (credit risk is a good example of significant differences). I compared the diversification benefits assumed by these firms against what the figure would be using the standard formula correlation matrix and the correlations assuming total independence between the risk types (e.g. square root of the sum of squares), as below.

click to enlargeDiversification Levels within European Insurers and Reinsurers

What can be seen clearly is that many of these firms, using their own internal models, are assuming diversification benefits roughly equal to that between those in the standard formula and those if the risk types were totally independent. I also included the diversification levels if 10% and 25% correlations were added to the correlation matrix in the standard formula. A valid question for these firms by investors is whether they are being overgenerous on their assumed diversification. The closer to total independence they are, the more sceptical I would be!

Assumed diversification within each risk type can also be material. Although I can understand arguments on underwriting risk types given different portfolio mixes, it is hard to understand the levels assumed within market risk, as the graph below on the disclosed figures from two firms show. Its hard for individual firms to argue they have material differing expectations of the interaction between interest rates, spreads, property, FX or equities!

click to enlargeDiversification Levels within Market Risk

Diversification within the life underwriting risk module can also be significant (e.g. 40% to 50%) particularly where firms write significant mortality and longevity type exposures. Within the non-life underwriting risk module, diversification between the premium, reserving and catastrophe risks also add-up. The correlations in the standard formula on diversification between business classes vary between 25% and 50%.

By way of a thought experiment, I constructed a non-life portfolio made up of five business classes (X1 to X5) with varying risk profiles (each class set with a return on equity expectation of between 10% and 12% at a capital level of 1 in 500 or 99.8% confidence level for each), as the graph below shows. Although many aggregate profiles may reflect ROEs of 10% to 12%, in my view, business classes in the current market are likely to have a more skewed profile around that range.

click to enlargeSample Insurance Portfolio Profile

I then aggregated the business classes at varying correlations (simple point correlations in the random variable generator before the imposition of the differing distributions) and added a net expense load of 5% across the portfolio (bringing the expected combined ratio from 90% to 95% for the portfolio). The different resulting portfolio ROEs for the different correlation levels shows the impact of each assumption, as below.

click to enlargePortfolio Risk Profile various correlations

The experiment shows that a reasonably diverse portfolio that can be expected to produce a risk adjusted ROE of between 14% and 12% (again at a 1 in 500 level)with correlations assumed at between 25% and 50% amongst the underlying business classes. If however, the correlations are between 75% and 100% then the same portfolio is only producing risk adjusted ROEs of between 10% and 4%.

As correlations tend to increase dramatically in stress situations, it highlights the dangers of overtly generous diversification assumptions and for me it illustrates the need to be wary of firms that claim divine diversification.

Quick check on AIG

My last post on AIG concluded that a target of $60-$70 per share over the medium term did not seem unreasonable. However, given the difficulty in predicting a number of moving items in their results and the competitive insurance market, AIG didn’t excite me enough to get involved. Based upon a quick review of the results over H1 2014, that remains my view.

Q2 results were flattered by a gain of over $2 billion on the aircraft leasing sale. Overall the operating results were steady for H1, as the graph below shows, trending towards an approximate $10 billion operating income for 2014. Core earnings from P&C and life & retirement have been steady at approximately $2.5 billion each for the year to date.

click to enlargeAIG OpIncome 2011 to 2014H1

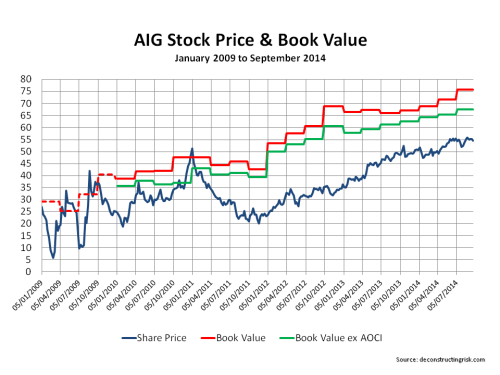
Analysts have an average EPS estimate of $4.62 for 2014, roughly the same as 2013, and $5.00 for 2015 which supports a target share price in the low to mid sixties. The AIG “discount” continues with the stock trading around 80% of book (excluding Accumulated Other Comprehensive Income), as per the graph below.

click to enlargeAIG Book Multiples 2009 to Sept2014

Some may argue that this discount is harsh given how far AIG has come. I’m not yet convinced that AIG deserves to come off the naughty step and get a more normal valuation.