Tag Archives: AIG book value

Oh AIG, where art thou?

In my last post on AIG, I expressed my doubts about the P&C targets outlined in their plan. After first announcing a $20 billion retroactive reinsurance deal with Berkshire covering long tail commercial P&C reserves for accident years prior to 2015 in January, AIG just announced another large commercial lines reserve charge of $5.6 billion principally from their US business. The graph below shows the impact upon their 2016 pre-tax operating income.

click to enlargeaig-pretax-operating-income-2012-to-2016

The latest reserve hit amounts to 12% of net commercial reserves at end Q3 2016 and compares to 7%, 8% and 6% for previous 2015, 2010, and 2009 commercial reserve charges. Whereas previously reserve strengthening related primarily to excess casualty and workers compensation (WC) business (plus an asbestos charge in 2010), this charge also covers primary casualty and WC business. The accident year vintage of the releases is also worryingly immature, as the graph below shows. After the 2016 charge, AIG have approx $7 billion of cover left on the Berkshire coverage.

click to enlargeaig-reserve-strengthening-accident-year-distribution

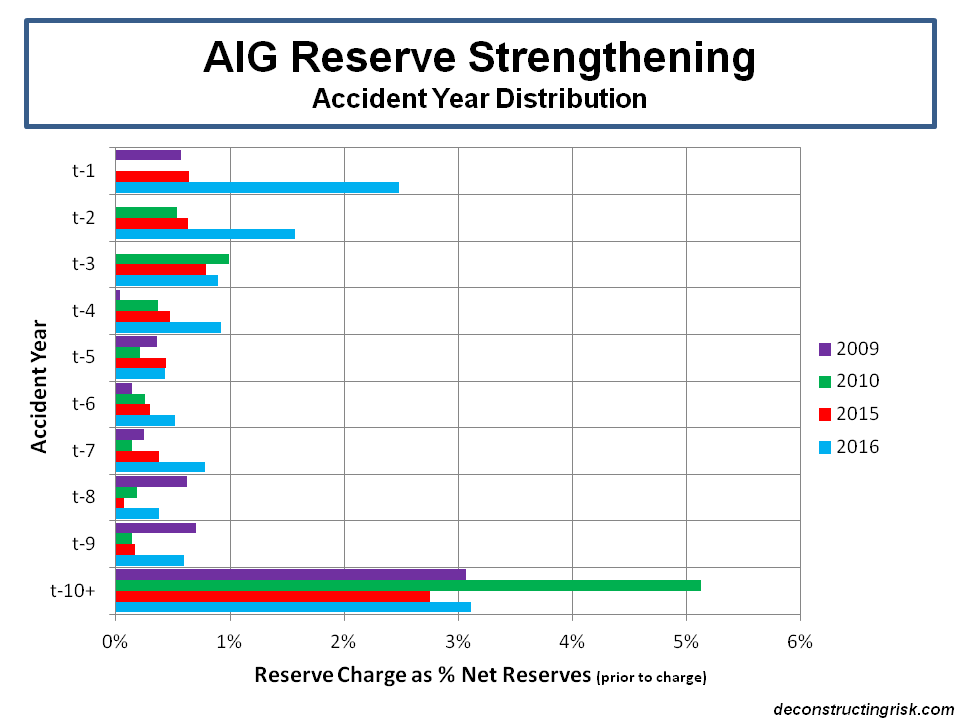
Although AIG have yet again made adjustments to business classifications, the graph below shows near enough the development of the accident year loss ratios on the commercial book over recent times.

click to enlargeaig-commercial-pc-accident-year-loss-ratios-2011-to-2016

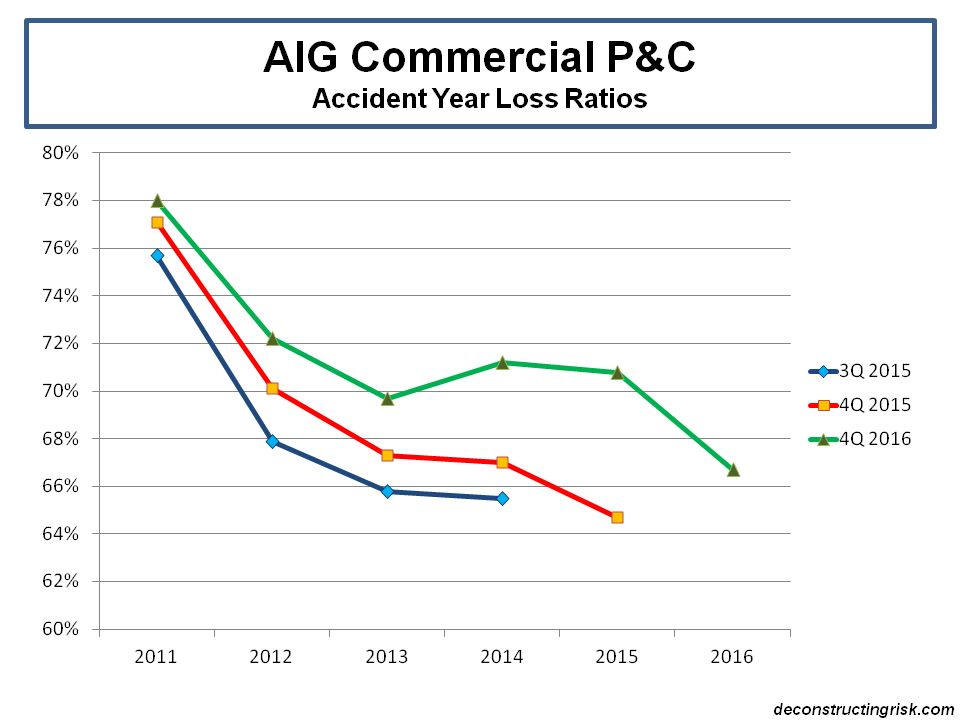
It is understandable that AIG missed their aggressive target against the pricing background of the past few years as illustrated by the latest Marsh report, as the exhibits below on global commercial rates and the US and European subsets show.

click to enlargeglobal-insurance-market-index

click to enlargeus-europe-insurance-market-index

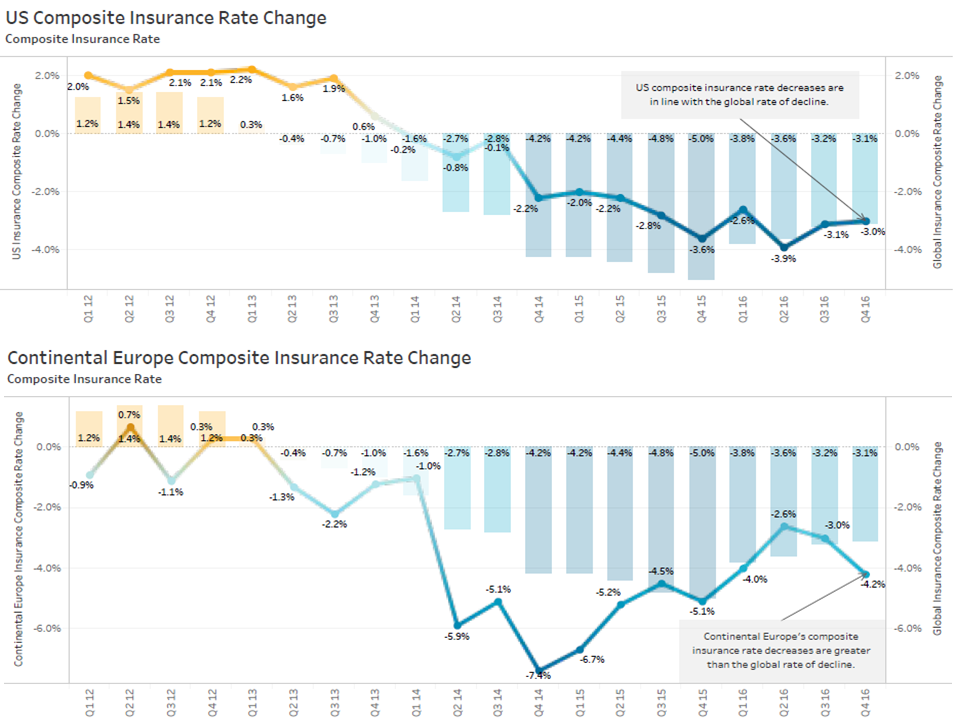
All of these factors would make me very skeptical on the targeted 62% exit run rate for the 2017 accident year loss ratio on the commercial book. And no big reinsurance deal with Berkshire (or with Swiss Re for that matter) or $5 billion of share buybacks (AIG shares outstanding is down nearly a third since the beginning of 2014 due to buybacks whilst the share price is up roughly 25% over that period), can impact the reality which AIG has now to achieve. No small ask.

Some may argue that AIG have kitchen-sinked the reserves to make the target of accident year loss ratios in the low 60’s more achievable. I hope for the firm’s sake that turns out to be true (against the odds). The alternative may be more disposals of profitable (life) businesses, possibly eventually leading to a sale of the rump and maybe the disappearance of AIG altogether.

Quick check on AIG

My last post on AIG concluded that a target of $60-$70 per share over the medium term did not seem unreasonable. However, given the difficulty in predicting a number of moving items in their results and the competitive insurance market, AIG didn’t excite me enough to get involved. Based upon a quick review of the results over H1 2014, that remains my view.

Q2 results were flattered by a gain of over $2 billion on the aircraft leasing sale. Overall the operating results were steady for H1, as the graph below shows, trending towards an approximate $10 billion operating income for 2014. Core earnings from P&C and life & retirement have been steady at approximately $2.5 billion each for the year to date.

click to enlargeAIG OpIncome 2011 to 2014H1

Analysts have an average EPS estimate of $4.62 for 2014, roughly the same as 2013, and $5.00 for 2015 which supports a target share price in the low to mid sixties. The AIG “discount” continues with the stock trading around 80% of book (excluding Accumulated Other Comprehensive Income), as per the graph below.

click to enlargeAIG Book Multiples 2009 to Sept2014

Some may argue that this discount is harsh given how far AIG has come. I’m not yet convinced that AIG deserves to come off the naughty step and get a more normal valuation.

AIG still below $50: an explanation

In a previous post on AIG I tried to unpick each of the main drivers of the business and predict a “normalised” net income for 2014. Well, my estimate of $7.25 billion of net income for 2013 was blown out of the water by over $4 billion for H2 bringing the 2013 total to $9 billion. This is a massive increase on the $3.4 billion from 2012. A follow-on post in October outlined how I was surprised by a $1 billion tax benefit in Q3.

At $49, the stock currently trades at a discount of 71% to book value (incl AOCI) and 76% to book value (excl AOCI). Given the 2013 results and the successful sale of the aircraft leasing business, why is AIG not trading well above $50? Well, one reason may be that outlined in the graphic below.

click to enlargeAIG Net Income 2013 10K vrs 2012 10K

After the amount of change that AIG has gone through, reinstatements were to be expected. However, you should expect AIGs’ numbers to have stabilized by now and to be more consistent than movements of between $1.6, $0.6 & $1 billion for 2009, 2010, and 2011 as reported between the 2012 and 2013 10Ks. And a staggering $6.4 billion for 2012! How can that be? To be honest, my desire to dig deeper and find an explanation evaporated by the simple fact that it should not happen and my conviction in AIG has dropped commensurate with by disbelief.

If you believe that the movements are for rational reasons and can be taken into account in future estimates, then good luck to you. The exhibits below represents what the latest 10K figures show.

The breakdown of “normalised” pre-tax income below (excluding items from AIA, ML III, aircraft leasing & debt restructures) shows consistent contributions from the “hodge-podge” of the mortgage business, GCM and DIB (combined up to $2.4 billion in 2013 from $2.2 billion in 2012). The P&C contribution is up considerably from 2011 & 2012 around $2 billion to over $5 billion. Life & retirement is also up to $6.5 billion in 2013 from under $4 billion in 2012 and approx $3 billion in 2011

click to enlargeAIG PreTax income 2001 to 2013

The P&C improvement in pre-tax income is primarily due to improvements in the US commercial & other business lines. The US commercial business benefited from a light 2013 catastrophe year whilst the other business segment had a lower underwriting loss and high investment income. The expense ratio, particularly in the international segment, remains high.

click to enlargeAIG Inc - P&C PreTax income 2001 to 2013

Life & retirement benefited from good top-line growth, a $1 billion legal settlement, and $2 billion of realized capital gains.

After taking the 2013 trends into account and taking out some 2013 one-offs and including an average US catastrophe year, my previous estimate of a “normalised” $6.5 billion of net income for 2014 and a $60-$70 price target over 12-18 months does not seem unreasonable. That’s if you have confidence in the reported 2013 figures. Which, based upon the first exhibit above, I don’t.