Tag Archives: risk premia

Bumpy Road

After referring to last year’s report in the previous post, the latest IMF Global Financial Stability Report called “A Bumpy Road Ahead” was released yesterday. Nothing earth-shattering from the report when compared to previous and current commentary. The following statements are typical:

“Many markets still have stretched valuations and may experience bouts of volatility in the period ahead, in the context of continued monetary policy normalization in some advanced countries. Investors and policymakers should be cognizant of the risks associated with rising interest rates after years of very easy financial conditions and take active steps to reduce these risks.”

and

“Valuations of risky assets are still stretched, with some late-stage credit cycle dynamics emerging, reminiscent of the pre-crisis period. This makes markets exposed to a sharp tightening in financial conditions, which could lead to a sudden unwinding of risk premiums and a repricing of risky assets. Moreover, liquidity mismatches and the use of financial leverage to boost returns could amplify the impact of asset price moves on the financial system.”

With the US 10 year breaking 2.9% today and concerns about a flattening yield curve, the IMF puts global debt at $164 trillion or 225% of GDP (obviously a different basis from the IIF’s estimate of global debt at $237 trillion or 318% of GDP) and warns about the US projected debt increase due to its “pro-cyclical policy actions”.

In a chapter the IMF calls “The Riskiness of Credit Allocations” it presents an interesting graph, as below, using its financial conditions index which uses multiple inputs constructed using a methodology that’s wonderfully econometrically complex, as is the IMF way.

click to enlarge

The IMF warn that “a variety of indicators point to vulnerabilities from financial leverage, a deterioration in underwriting standards, and ever more pronounced reaching for yield behaviour by investors in corporate and sovereign debt markets around the world”.

Hedge Blues

For many years Warren Buffet has been highlighting the benefits of investing in a low cost index fund over paying return sapping fees to professional “helpers”. In Buffet’s 2016 letter, released over the weekend, he estimates approx $100 billion in fees have been wasted by investors in the past decade in “the search by the elite for superior investment advice”.

The selected returns by hedge funds, specifically fund of funds, since 2008 in the letter make Buffet’s point strongly (those funds were selected by Ted Seides in the wager with Buffet). Although I have no love for the overpaid superheros of the hedge fund world, Buffet’s wager has the tail wind of a particularly bad run of returns from the hedgies of late. The graph below shows the average 10 year returns from the S&P500 (including dividends less 15 basis points for fees) against hedge fund returns, net of fees, from the BarclayHedge website (I only selected those categories with more than 99 funds included).

click to enlarge10-year-average-hedge-fund-returns-2006-to-2016

Clearly, the 10 year averages for the past 5 years haven’t been kind to the masters of the universe. That may be reflective of a permanent change in markets, due to anything from more regulation to the era of low risk premia to less leverage to size. Buffet puts it down to success attracting too much capital and managers subsequent addiction to fees. I do like the explanation given by Bill Ruane from Buffet’s letter in the following quote – “In investment management, the progression is from the innovators to the imitators to the swarming incompetents.”

One Direction

Goldman Sachs says “we have more potential for shocks right now”. Deutsche Bank and Bank of America Merrill Lynch predict a pick-up in volatility to hit equities. The ever positive Albert Edwards of Socgen points to a recent IMF report on debt and trashes the Fed with the quip “these dudes will never identify an asset bubble at least before the event!

In the IMF report referenced above, and other reports published by the IMF this month, there is some interesting analysis and a sample of the accompanying graphs are reproduced below.

All of these graphs show trends going inexorably in one direction. Add in dollops of (not unrelated) political risk particularly in the UK and across Europe, and that direction looks like trouble ahead.

click to enlargeimf-gross-global-debt-as-of-gdp

click to enlargeimf-private-debt-during-deleveraging-periods

click to enlargeimf-decomposition-of-equity-valuations-october-2016

click to enlargeimf-global-real-rates

click to enlargeimf-report-sovereign-bond-yields-and-term-premiums

click to enlargeimf-report-banking-sector

click to enlargeimf-report-pension-deficits

Pimping the Peers (Part 1)

Fintech is a much hyped term currently that covers an array of new financial technologies. It includes technology providers of financial services, new payment technologies, mobile money and currencies like bitcoin, robo-advisers, crowd funding and peer to peer (P2P) lending. Blockchain is another technology that is being hyped with multiple potential uses. I posted briefly on the growth in P2P lending and crowd-funding before (here and here) and it’s the former that is primarily the focus of this post.

Citigroup recently released an interesting report on the digital disruption impact of fintech on banking which covers many of the topics above. The report claims that $19 billion has been invested in fintech firms in 2015, with the majority focussed in the payments area. In terms of the new entrants into the provision of credit space, the report highlights that over 70% of fintech investments to date have being in the personal and SME business segments.

In the US, Lending Club and Prosper are two of the oldest and more established firms in the marketplace lending sector with a focus on consumer lending. Although each are growing rapidly and have originated loans in the multiple of billions in 2015, the firms have been having a rough time of late with rates being increased to counter poor credit trends. Public firms have suffered from the overall negative sentiment on banks in this low/negative interest rate environment. Lending Club, which went public in late 2014, is down about 70% since then whilst Prosper went for institutional investment instead of an IPO last year. In fact, the P2P element of the model has been usurped as most of the investors are now institutional yield seekers such as hedge funds, insurers and increasingly traditional banks. JP Morgan invested heavily in another US firm called OnDeck, an online lending platform for small businesses, late in 2015. As a result, marketplace lending is now the preferred term for the P2P lenders as the “peer” element has faded.

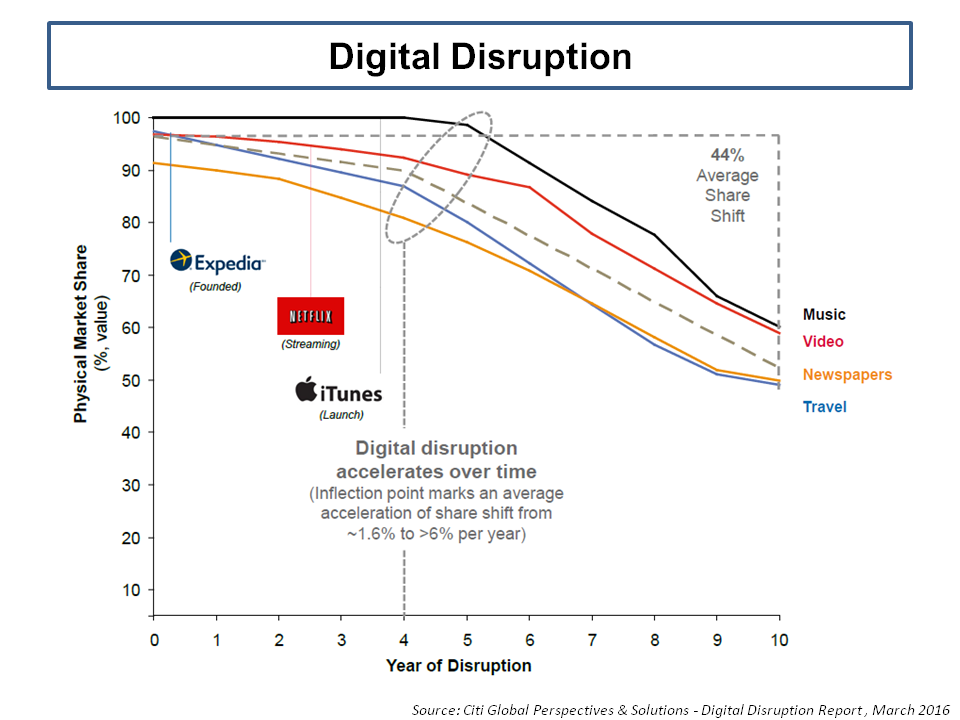
Just like other disruptive models in the technology age, eBay and Airbnb are examples, initially these models promised a future different from the past, the so called democratization of technology impact, but have now started to resemble new technology enabled distribution platforms with capital provided by already established players in their sectors. Time and time again, digital disruption has eroded distribution costs across many industries. The graphic from the Citi report below on digital disruption impact of different industries is interesting.

click to enlargeDigital Disruption

Marketplace lending is still small relative to traditional banking and only accounts for less than 1% of loans outstanding in the UK and the US (and even in China where its growth has been the most impressive at approx 3% of retail loans). Despite its tiny size, as with any new financial innovation, concerns are ever-present about the consequences of change for traditional markets.

Prosper had to radically change its underwriting process after a shaky start. One of their executives is recently quoted as saying that they “will soon be on our sixth risk model”. Marrying new technology with quality credit underwriting expertise (ignoring the differing cultures of each discipline) is a key challenge for these fledging upstarts. An executive in Kreditech, a German start-up, claimed that they are “a tech company who happens to be doing lending”. Critics point to the development of the sector in a benign default environment with low interest rates where borrowers can easily refinance and the churning of loans is prevalent. Adair Turner, the ex FSA regulator, recently stirred up the new industry with the widely reported comment that “the losses which will emerge from peer-to-peer lending over the next five to 10 years will make the bankers look like lending geniuses”. A split of the 2014 loan portfolio of Lending Club in the Citi report as below illustrates the concern.

click to enlargeLending Club Loan By Type

Another executive from the US firm SoFi, focused on student loans, claims that the industry is well aware of the limitations that credit underwriting solely driven by technology imbues with the comment that “my daughter could come up with an underwriting model based upon which band you like and it would work fine right now”.  Some of the newer technology firms make grand claims involving superior analytics which, combined with technologies like behavioural economics and machine learning, they contend will be able to sniff out superior credit risks.

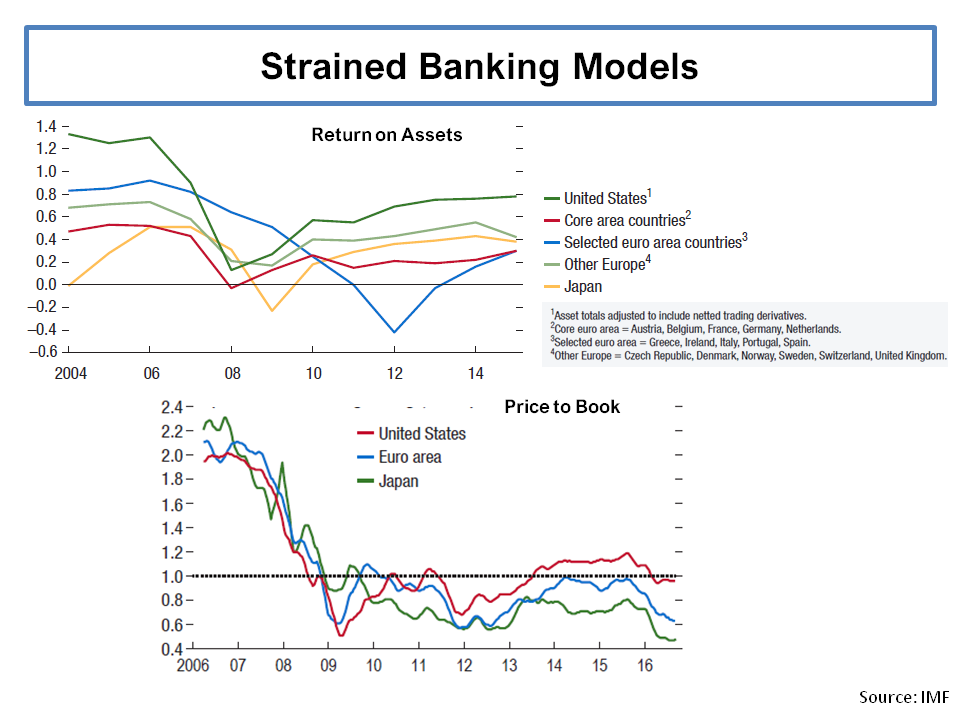
The real disruptive impact that may occur is that these newer technology driven firms will, as Antony Jenkins the former CEO of Barclays commented, “compel banks to significantly automate their business”. The Citigroup report has interesting statistics on the traditional banking model, as per the graphs below. 60% to 70% of employees in retail banking, the largest profit segment for European and US banks, are supposedly doing manual processing which can be replaced by automation.

click to enlargeBanking Sector Forecasts Citi GPS

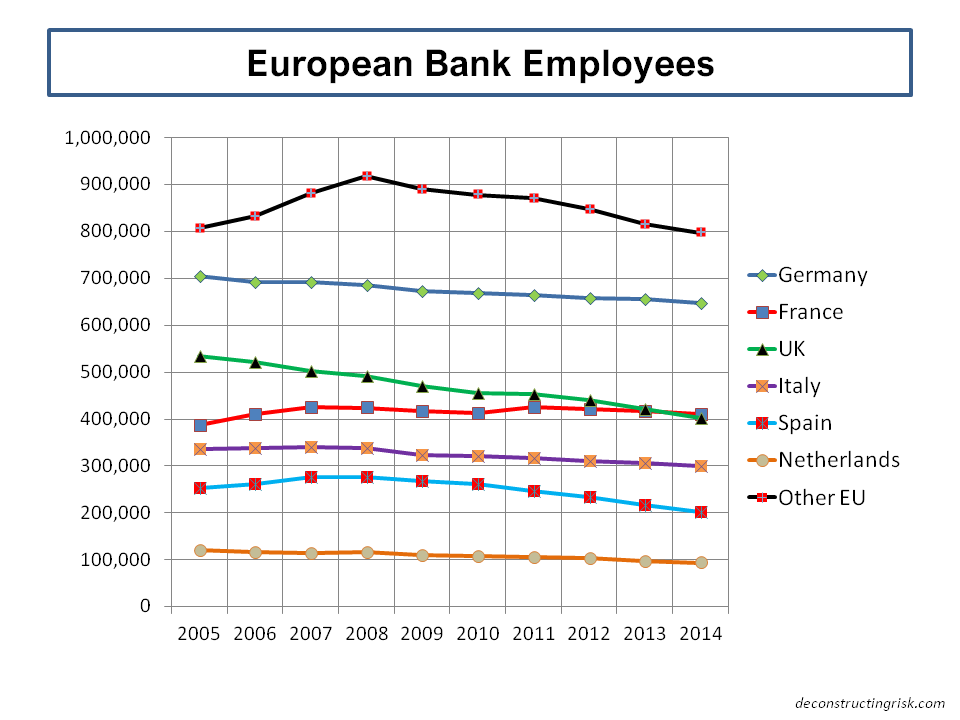
Another factor driving the need to automate the banks is the cyber security weaknesses in patching multiple legacy systems together. According to the Citigroup report, “the US banks on average appear to be about 5 years behind Europe who are in turn about a decade behind Nordic banks”. Within Europe, it is interesting to look at the trends in bank employee figures in the largest markets, as per the graph below. France in particular looks to be out of step with other countries.

click to enlargeEuropean Bank Employees

Regulators are also starting to pay attention. Just this week, after a number of scams involving online lenders, the Chinese central bank has instigated a crack down and constituted a multi-agency task force. In the US, there could be a case heard by the Supreme Court which may create significant issues for many online lenders. The Office of the Comptroller of the Currency recently issued a white paper to solicit industry views on how such new business models should be regulated. John Williams of the San Francisco Federal Reserve recently gave a speech at a recent marketplace lending conference which included the lucid point that “as a matter of principle, if it walks like a duck and quacks like a duck, it should be regulated like a duck”.

In the UK, regulators have taken a gentler approach whereby the new lending business models apply for Financial Conduct Authority authorisation under the 36H regulations, which are less stringent than the regimes which apply to more established activities, such as collective investment schemes. The FCA also launched “Project Innovate” last year where new businesses work together with the FCA on their products in a sandbox environment.

Back in 2013, I asked the question whether financial innovation always ended in lower risk premia in this post. In the reinsurance sector, the answer to that question is yes in relation to insurance linked securities (ILS) as this recent post on current pricing shows. It has occurred to me that the new collateralised ILS structures are not dissimilar in methodology to the 100% reserve banks, under the so-called Chicago plan, which economists such as Irving Fisher, Henry Simons and Milton Friedman proposed in the 1930s and 1940s. I have previously posted on my difficulty in understanding how the fully collaterised insurance model can possibly accept lower risk premia than the traditional “fractional” business models of traditional insurers (as per this post). The reduced costs of the ILS model or the uncorrelated diversification for investors cannot fully compensate for the higher capital required, in my view. I suspect that the reason is hiding behind a dilution of underwriting standards and/or leverage being used by investors to juice their returns. ILS capital is now estimated to make up 12% of overall reinsurance capital and its influence on pricing across the sector has been considerable. In Part 2 of this post, I will look into some of the newer marketplace insurance models being developed (it also needs a slick acronym – InsurTech).

Marketplace lending is based upon the same fully capitalized idea as ILS and 100% reserve banks. As can be seen by the Citigroup exhibits, there is plenty of room to compete with the existing banks on costs although nobody, not yet anyway, is claiming that such models have a lower cost of capital than the fractional reserve banks. It is important not to over exaggerate the impact of new models like marketplace lending on the banking sector given its current immaterial size. The impact of technology on distribution channels and on credit underwriting is likely to be of greater significance.

The indirect impact of financial innovation on underwriting standards prior to the crisis is a lesson that we must learn. To paraphrase an old underwriting adage, we should not let the sweet smell of shiny new technology distract us from the stink of risk, particularly where such risk involves irrational human behaviour. The now infamous IMF report in 2006 which stated that financial innovation had “increased the resilience of the financial system” cannot be forgotten.

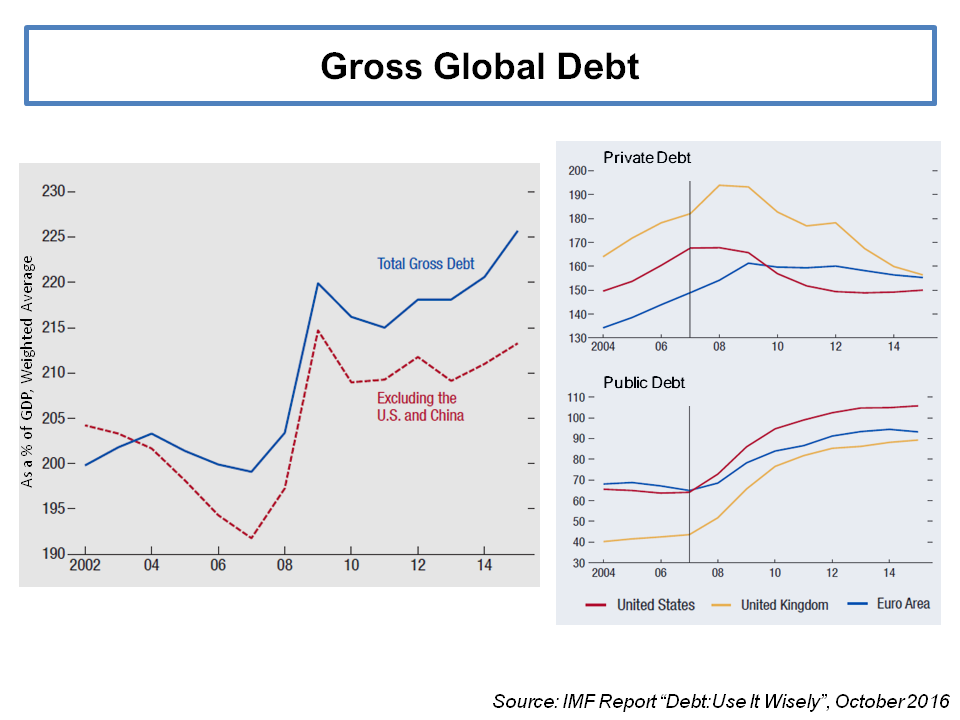
I am currently reading a book called “Between Debt and the Devil” by the aforementioned Adair Turner where he argues that private credit creation, if left solely to the free market under our existing frameworks, will overfund secured lending on existing real estate (which my its nature is finite), creating unproductive volatility and financial instability as oversupply meets physical constraints. Turner’s book covers many of the same topics and themes as Martin Wolf’s book (see this post). Turner concludes that we need to embrace policies which actively encourage a less credit intensive economy.

It is interesting to see that the contribution of the financial sector has not reduced significantly since the crisis, as the graph on US GDP mix below illustrates. The financialization of modern society does not seem to have abated much since the crisis. Indeed, the contribution to the value of the S&P500 from the financials has not decreased materially since the crisis either (as can be seen in the graph in this post).

click to enlargeUS GDP Breakdown 1947 to 2014

Innovation which makes business more efficient is a feature of the creative destruction capitalist system which has increased productivity and wealth across generations. However, financial innovation which results in changes to the structure of markets, particularly concerning banking and credit creation, has to be carefully considered and monitored. John Kay in a recent FT piece articulated the dangers of our interconnected financial world elegantly, as follow:

Vertical chains of intermediation, which channel funds directly from savers to the uses of capital, can break without inflicting much collateral damage. When intermediation is predominantly horizontal, with intermediaries mostly trading with each other, any failure cascades through the system.

When trying to understand the potential impacts of innovations like new technology driven underwriting, I like to go back to an exhibit I created a few years ago trying to illustrate how  financial systems have been impacted at times of supposed innovation in the past.

click to enlargeQuote Money Train

Change is inevitable and advances in technology cannot, nor should they, be restrained. Human behaviour, unfortunately, doesn’t change all that much and therefore how technological advances in the financial sector could impact stability needs to be ever present in our thoughts. That is particularly important today where global economies face such transformational questions over the future of the credit creation and money.

A Tale of Two Insurers

My negativity on the operating prospects for the reinsurance and specialty insurance sector has been articulated many times previously in this blog. Many of the same factors are impacting the broader commercial insurance market. Pricing conditions in the US and globally can be seen in the graph below.

click to enlargeUS and Global Commercial Insurance Pricing

Two insurers, at different ends of the size scale, which I have previously posted on, are AIG (more recently here and here) and Lancashire (more recently here and here). Given that a lot has happened to each since I last posted on them, I thought a quick update on both would give an interesting insight into the current market.

First up is AIG who have been under a lot of pressure from shareholders to unlock value, including a break-up plan for the insurance giant from the opportunistic rascal Carl Icahn. The graph below shows a breakdown of recent operating results (as ever with AIG longer term comparisons are hampered by their ever changing reporting segments). The improvement in the UGC mortgage insurance business has been dwarfed by the poor non-life results which were impacted by a significant reserve strengthening charge.

click to enlargeAIG PreTax Operating Income 2012 to 2015

In January, Peter Hancock (the 5th CEO since Hank Greenberg left in 2005) announced a new strategic plan to the end of 2017, the main points of which are

  • Return at least $25 billion of capital to shareholders through dividends and share buy-backs from operating profits, divestitures and other actions such as monetizing future life profits by $4-5 billion through reinsurance purchases.
  • Enhance transparency by separating into an operating portfolio with a goal of over 10% return on equity and a legacy portfolio that will focus on return of capital. Reorganize into at least nine modular, more self-contained business units to enhance accountability, transparency, and strategic flexibility.
  • Reduce general operating expenses by $1.6 billion, 14 percent of the 2015 expenses.
  • Improve the commercial P&C accident year loss ratio by six points.
  • Pursue an active divestiture program, including initially the 20% IPO of UGC.

The non-life reserve charge in 2015 amounted to $3.6 billion. 60% of the charge came from the (mainly US) casualty business, 16% from financial lines (again mainly in the US) and 15% from the run-off business. After the last material reserve strengthening in 2010, the worrying aspect of the 2015 charge is that approximately two thirds comes from accident years not yet 10 years old (which is relatively immature for long tail casualty business particularly when 42% of the charge is on excess casualty business). The impact of the reserve hikes on the commercial P&C segment can be clearly seen in the graph below.

click to enlargeAIG Commercial P&C Combined Ratio Breakdown 2008 to 2015

Perhaps the most aggressive target, given current market conditions, in the strategic plan is the 6% improvement in the commercial P&C accident year loss ratio by the end of 2017. The plan includes exiting approximately $1 billion of US casualty business, including poorly performing excess casualty business, primary and excess auto liability, health-care and financial lines business. Growth of $0.5 billion is been targeted in multi-national, financial lines, property upper middle market and major accounts which involve specialist engineering capabilities, international casualty and emerging risks such as cyber and M&A insurance. AIG also recently announced a two year reinsurance deal with Swiss Re on their US casualty book (it looks like a 25% quota share). The scale of the task for AIG in meeting this target can be seen in the exhibit below which takes a number of slides from the strategy presentation.

click to enlargeAIG Commercial P&C Metrics

I was struck by a quote from the firm on their turnaround plan – “We will use the data and analytical tools we have invested in to significantly differentiate and determine where we should focus our resources.” I suspect that every significant insurer would claim to have, or at least aspire to have, similar analytical capabilities. Big data and analytical driven underwriting is undoubtedly the future for large insurers with access to large amounts of quality data. Fortune had an interesting recent article on the analytical firm Palantir who are working with some insurers on sharpening their underwriting criteria for the social media age. An analyst in Citi even suggested that Goggle should look at buying AIG as a fintech play. The entry of the big internet firms into the insurance sector seems inevitable in some form or other, although I doubt AIG will be part of any such strategy.

As to the benefits of staying a large composite insurer, AIG cited an analysis commissioned by consultants Oliver Wyman supporting the benefits of diversification between the life and non-life business of AIG. Using the S&P consolidated model as a proxy, Oliver Wyman estimate a $7.5 billion capital benefit to AIG compared to separate life and non-life businesses, as envisaged in Icahn’s plan.

So, can AIG achieve the aggressive operational targets they have set themselves for the P&C business? Current market conditions present a considerable challenge. Combined with their recent results, an end of 2017 target for a 6% improvement is extremely aggressive. Too aggressive for my liking. However, the P&C results should improve somewhat over the short term (particularly if there is no more big reserve charges) and actions such as expense reductions, monetizing future life profits and divestitures will give AIG the fire power to hand out sweeties to shareholders. For those willing to take the punt, the return of a chunk of the $25 billion target in dividends and share buy-backs over the next 2 years for a firm with a current market value of $61 billion, trading at a 0.72 multiple to book value (trading around 0.92 of book less AOCI and DTA), may be too tempting to resist. It does have a certain allure…..

Lancashire, a London market specialty insurer and reinsurer with a mantra of disciplined underwriting, is at the opposite end of the scale spectrum with a niche focus. Long cherished by investors for its shareholder friendly dividend policies, Lancashire has been under pressure of late due to the heavy competition in its niche markets. The energy insurance sector, for example, has been described by the broker Willis as dismal with capacity chasing a smaller premium pool due to the turmoil in the oil market. A number of recent articles (such as here and here) highlight the dangers. Alex Maloney, the firm’s CEO, described the current market as “one of the most difficult trading environments during the last twenty years”. In addition, Lancashire lost its founder, Richard Brindle, in 2014 plus the CEO, the CFO and some senior underwriters of its Lloyds’ Cathedral unit in 2015.

The graph below shows the breakdown of reported historical calendar year combined ratios plus the latest accident year net loss ratio and paid ratio.

click to enlargeLancashire Ratio Breakdown 2008 to 2015

The underwriting discipline that Lancashire professes can be seen in the recent accident year loss ratios and in the 30% drop in gross written premiums (GWP), as per the graph below. The drop is more marked in net written premiums at 35% due to the increase in reinsurance spend to 25% of GWP (from approx 10% in its early years).

click to enlargeLancashire GWP Breakdown 2008 to 2015

The timely and astute increase in reinsurance protection spend can be seen in the decrease in their peak US aggregate exposures. The latest probable maximum loss (PML) estimates for their US peak exposures are approximately $200 million compared to historical levels of $300-350 million. Given the lower net premium base, the PML figures in loss ratio terms have only dropped to 40% from 50-60% historically. Lancashire summed up their reinsurance purchasing strategy as follows:

“Our outwards reinsurance programme provides a breadth and depth of cover which has helped us to strengthen our position and manage volatility. This helps us to continue to underwrite our core portfolio through the challenges posed by the cycle.”

As with AIG, the temptation for shareholders is that Lancashire will continue with their generous dividends, as the exhibit below from their Q4 2015 presentation shows.

click to enlargeLancashire Dividend History 2015

The other attraction of Lancashire is that it may become a take-over target. It currently trades at 1.4 times tangible book level which is rich compared to its US and Bermudian competitors but low compared to its peers in Lloyds’ which trade between 1.58 and 2.0 times tangible book. Lancashire itself included the exhibit below on tangible book values in its Q4 2015 presentation.

click to enlargeInsurance Tangible Book Value Multiple 2012 to 2015

It is noteworthy that there has been little activity on the insurance M&A front since the eye boggling multiples achieved by Amlin and HCC from their diversification hungry Japanese purchasers. Many in the market thought the valuations signaled the top of the M&A frenzy.

Relatively, AIG looks more attractive than Lancashire in terms of the potential for shareholder returns. However, fundamentally I cannot get away from current market conditions. Risk premia is just too low in this sector and no amount of tempting upside through dividends, buy-backs or M&A multiples can get me comfortable with the downside potential that comes with this market. As per the sentiment expressed in previous posts, I am happy with zero investment exposure to the insurance sector right now. I will watch this one play out from the sidelines.