Following up on the topic of the last post, I previously discussed the importance of looking at historical experience adjusted for today’s exposure. Roger Pielke Jr is one source that has looked to “normalise” historical hurricane insured losses through the prism of today’s building types and densities and I highlighted Pielke’s work in my June 2013 post.
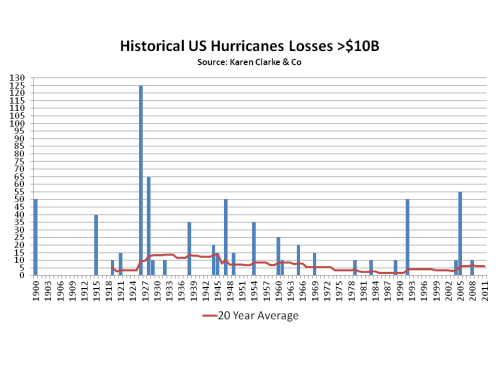
Another market expert is Karen Clark who used to work for one of the main catastrophe modelling firms, AIR Worldwide, and who now runs a consultancy firm. In August 2012, her firm published a report on the exposure adjusted insured cost of historical storms that would cost $10 billion or more. The graph below reproduces the results of the report showing the cost per year for hurricanes greater than $10 billion up to 2011, with the 20 year average loss cost.
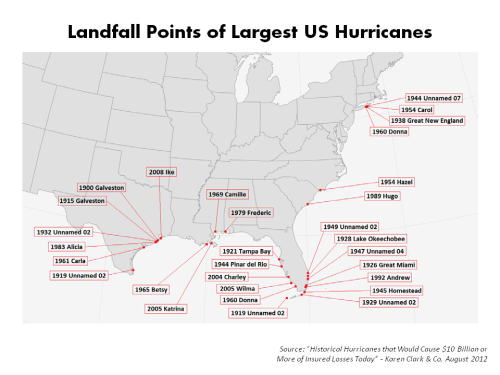
The graph below, also from the Karen Clark report, shows where the storms hit.
Roger Pielke continues to issue interesting insights on his blog and in a recent post he stated:
“We shouldn’t let the past 9 years of abnormally low hurricane activity lull us into a sense of complacency. It is only a matter of time before the long streak with no US Cat 3+ and Florida hurricanes is broken.”
That is a message that the current reinsurance market is happily ignoring.


Thanks for the update. Recency bias at its best. We didn’t see any severe hurricanes for a while so don’t expect any…
Eddie
Thanks great blogg