Monthly Archives: June 2014

Reluctant Bulls

There was a nice piece from Buttonword in the Economist where he concluded that despite all the indicators of the equity market being overvalued that “investors are reluctant bulls; there seems no alternative”. This seems like a rationale explanation for the relatively irrational behaviour of current markets.

He highlighted indicators like the high CAPE, figures from the Bureau for Economic Analysis (BEA) on the profit dip in Q1, high share buybacks, figures from SocGen’s Andrew Lapthorne that the ratio of corporate debt to assets is close to its 2009 peak, and a BoA Merrill Lynch poll which shows that 48% of institutional investors are overweight equities whilst a net 15% believe they are overvalued.

Despite the bearish indicators everywhere, investors seem frozen by central bank indecision on whether economies still need help by remaining accommodative or that the recovery has taken hold and monetary policy needs to start to tighten.

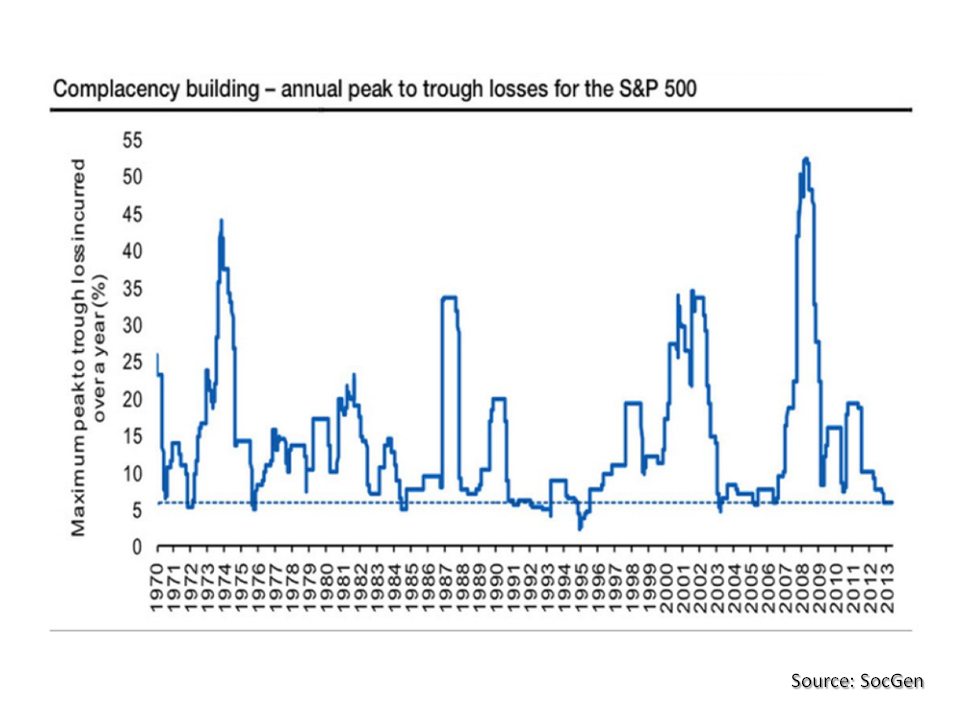
Andrew Lapthorne released some analysis earlier this month highlighting that a significant amount of the previous year’s earnings growth was down to M&A from Verizon and AT&T and concluded that EPS growth by M&A and from share buybacks is a classic end of cycle indicator. Lapthorne produced the graph below of historical peaks and troughs in the S&P500 and noted that the average historical 1% down days is 27 per year since 1969 an the S&P500 has only had 16 in the past 12 months and that we have gone through the 4th longest period on record without a market correction of 10% or more.

click to enlarge
SocGen peak to through

Albert Edwards, also at SocGen, points to the difference in the BEA profit statistics and those reported being down to the expiration of tax provisions for accelerated depreciation and he concludes that “the bottom line is that the U.S. profits margin cycle has begun to turn down at long last“.

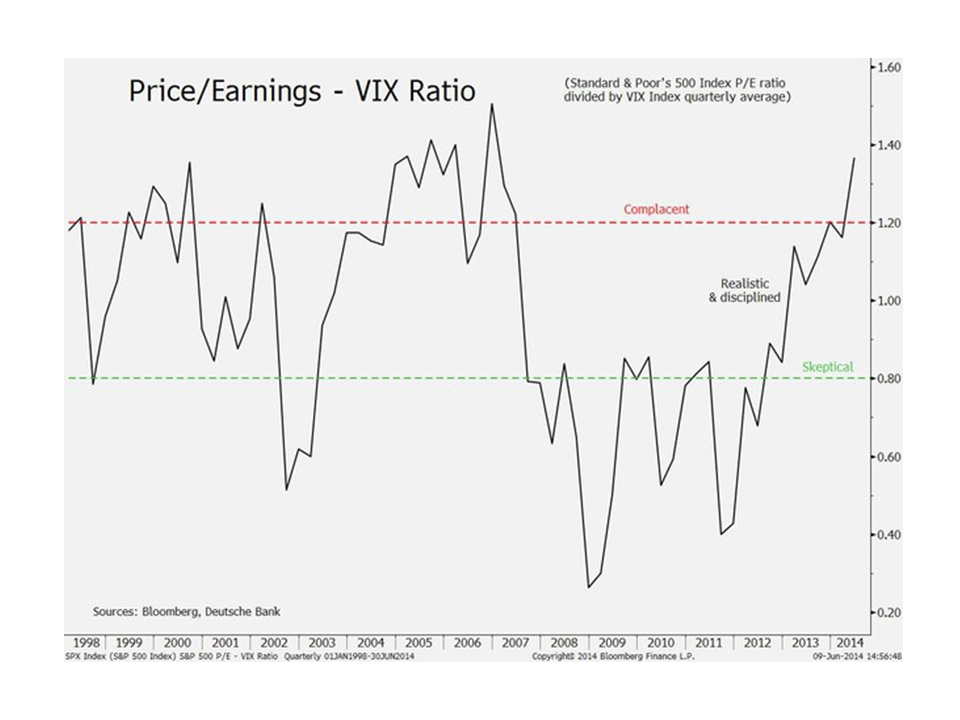
Even the perma-bull David Bianco of Deutsche Bank has cautioned against overvaluation calling the market complacent and moving into mania territory using their preferred measure of sentiment, namely the PE ratio divided by the VIX. The graph below from early June illustrates.

click to enlarge
DB Price Earnings VIX Ratio

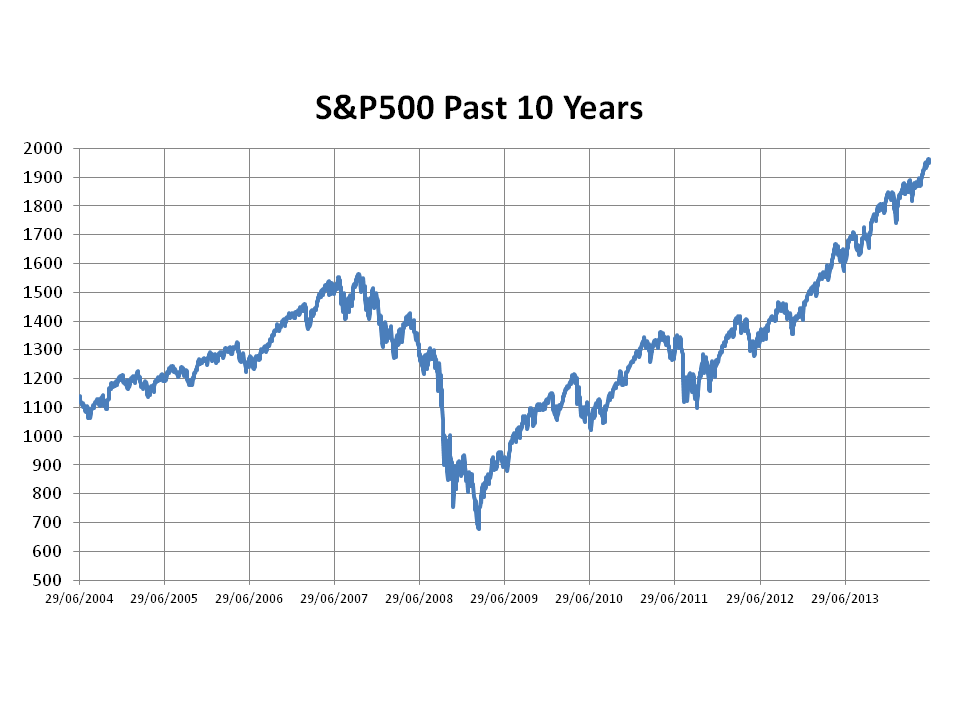
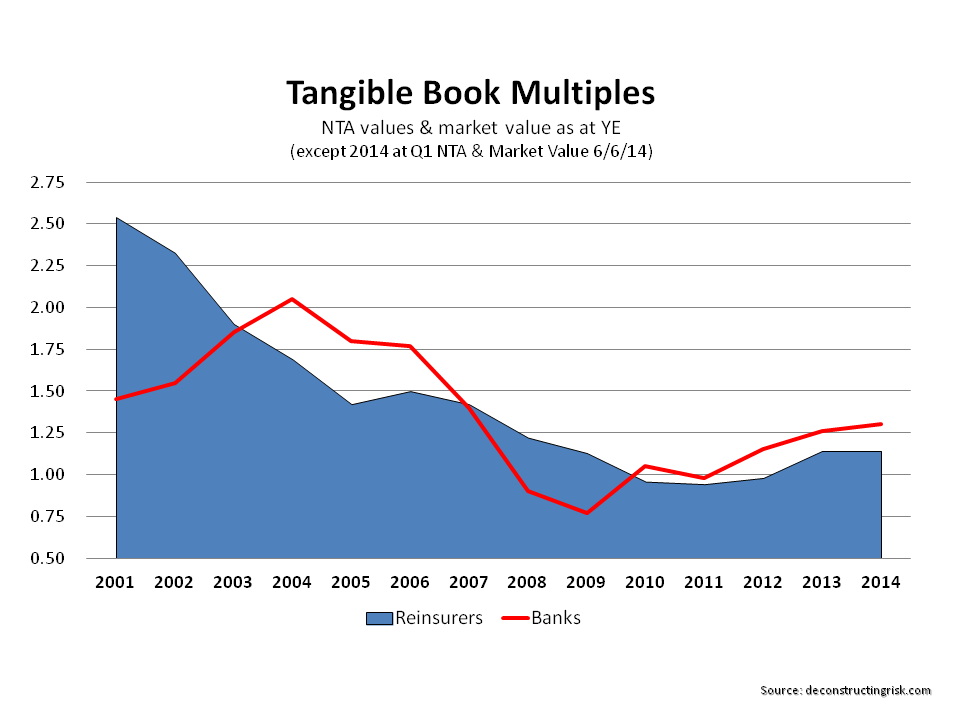
From my point of view, I think the chart of the S&P500 for the past 10 years tells its own story about where we are. As Louis Rukeyser said “trees don’t grow to the sky“. Nor do equity markets.

click to enlarge

S&P500 Past 10 Years

From tera to zetta and beyond to yotta

One of the great lessons of the internet crash was that the exponential growth in internet activity did not mean a similar level of growth in revenues for many of the new business models which were hyped. I can remember an insightful report before the crash which added up all the expected top-line growth projections and concluded that household expenditure on internet services would have to amount to 30% to 40% of household expenditures if projections were to be met!! Although on a personal basis household expenditure on internet access does seem to be growing all the time, it’s not at anything like the growth in our usage. Not yet anyway!

The graphs below shows the growth in global internet traffic from 2001 to 2012 according to Cisco, split by IP, fixed and mobile internet traffic. Although not on the same scale but in a similar vein, the lower graph shows the monthly peering traffic recorded over the Amsterdam Internet Exchange from July 2001 to May 2014

click to enlarge
Historical Internet Growth

For reference, gigabyte/terabyte/petabyte/exabyte/zettabyte/yottabyte is a kilobyte to the power of 3, 4, 5, 6, 7 and 8 respectively.

According to the latest projections from Cisco in their report this month “ The Zettabyte Era – Trends and Analysis”, global IP traffic will surpass the zettabyte threshold by the end of 2016 growing by approximately 20% per annum. Global IP traffic has increased fivefold over the past 5 years, and Cisco predicts an increase of threefold over the next 5 years.

click to enlarge
IP Growth Cisco June 2014 projections

The graph below illustrates the changes in devices used to access the internet behind Cisco’s projections.

click to enlarge
Connected Devices Cisco predictions June 2014

The report highlights a number of core trends including the following:
1) Transition to newer devices will alter network demand and usage.
2) M2M growth will drive the internet of everything.
3) Fixed broadband speeds will nearly triple by 2018.
4) Wi-Fi will dominate access technology.
5) Metro traffic will grow nearly twice as fast as long-haul traffic.
6) IP video will accelerate IP traffic growth through 2018.
7) Bottlenecks may result between peak and average demand times.

Bring on the yotta era!

A classy telecom marriage

Two of my favourites names in the telecom space – Level 3 (LVLT) and TW Telecom (TWTC) – have announced an agreement to merge. I have posted previously on both – here and here respectively. Overall, my initial reaction is positive on the deal as I believe that LVLT have bought a quality asset, albeit at a high multiple of 12.8 times TW’s 2014 estimated EBITDA (TW’s deep metro fiber business model has a high EBITDA margin of approx 35% with a high capex spend in the low to mid 20% range).

There is always execution risk in these deals particularly when taking over a tightly managed and focussed player like TW. LVLT’s successful integration of recent M&A and the new CEO’s focus on operational results mitigates the risks somewhat. My guess is that cultural issues may be the hardest issue to manage as it looks like TWTC’s management will exit after the deal. However, the businesses are very complementary and the sector is one where scale and depth is becoming increasingly important to compete for the demands of the growing bandwidth hungry enterprise sector.

On the financials, based upon my quick and dirty analysis, I estimate that the combined entity could generate approx. $9 billion of revenue and $3 billion of EBITDA by 2016. Despite taking on extra debt for the deal, I estimate that LVLT can meet its leverage target by getting net debt to EBITDA below 3.5 by the end of 2016. Maintaining the leverage target was emphasised by LVLT during the deal presentation. At an EV/EBITDA multiple of 8.5 (assuming 350 million shares after the deal and LVLT 2015 debt conversion), a target price for LVLT of $45 looks sensible to me. Been more positive, a 9.5 multiple gives a target price of $55. Those targets may disappoint LVLT shareholders given the stock was at $44 before the deal was announced and there was further upside potential from a standalone LVLT due to the virtuous cycle of operational efficiencies, reducing interest expense, and growing core revenues .

My view is that now is the opportune for LVLT to use their highly valued stock as currency to purchase a quality asset like TWTC. A classy bride does not come cheap but over the longer term the rewards should come. Either that or you end up broke!

Reinsurer & Bank TBV Multiples

Given the increase in the tangible book values (TBV) of reinsurers over the past few quarters, I wanted to quickly update the graphic shown in previous posts (like this one) to see how the share price changes (generally flat over 2014 since the run-ups in 2013) over that time have impacted multiples. The graphic below is based upon a limited pool of pure reinsurers only which doesn’t include the specialty insurers (who on the LSE generally have higher multiples than their European and Bermudian brothers, as a previous post shows). As it turns out, the mounting pricing pressures in reinsurance have impacted current market values and based on Q1 TBV the multiples are therefore relatively stable since the end of 2013.

I wanted to compare the change in TBV multiples for reinsurers against those for banks, particularly for the global banks, but have not been able to get the clean data on the banking sector. The red line below is based upon data on all publically traded banks up until 2010 with adjustments made on the data from 2011 to 2014. With both sets of data, it’s difficult to include a consistent set of firms given the structural shifts and business changes in both sectors. The current diversion in trends between US & European banks is a case in point. So a health warning applies on the data.

click to enlargeReinsurers & Banks NTA Multiples June 2014