Tag Archives: exponential growth

5G: Telecom Hype or Saviour

John Legere of T-Mobile is a canny operator and knows how to play the sycophant to Trump’s nationalist instincts in touting the ability of a combined T-Mobile & Sprint to invest in a super-charged 5G roll out, as per this presentation, playing the job creation and beat the Chinese technological advancement cards. Legere cites an Analysys Mason report commissioned by the US industry lobby group CTIA to back up such claims which in turn cites an Accenture report from 2017 on 5G in the US which claims that “telecom operators are expected to invest approximately $275 billion in infrastructure, which could create up to 3 million jobs and boost GDP by $500 billion”. In 2016, the European Commission in this report stated that 5G “investments of approximately €56.6 billion will be likely to create 2.3 million jobs in Europe”. An IHS Markit 2017 report commissioned by Qualcomm claims that in 2035, “5G will enable $12.3 trillion of global economic output” and “the global 5G value chain will generate $3.5 trillion in output and support 22 million jobs” on the basis that “the global 5G value chain will invest an average of $200 billion annually”.

These are fantastical figures. Many assumptions go into their computation including the availability, range and cost of spectrum plus infrastructure spend and policy in relation to streamlining procedures and fee structures for the deployment of the small shoe-box cell sites (between 10 to 100 more antenna are required for 5G than current networks). Larger issues such as privacy and security also need to be addressed before we enter a world of ubiquitous ultra-reliable low latency networks as envisaged by the reports referenced above. Those of us who lived through, and barely survived, the telecom boom of the late 1990s can be forgiven for having a jaundice view of a new technology saving the telecom industry. This blog illustrates some of the challenges facing the wired telecom sector and the graph below shows the pressures that the US mobile players are under in terms of recent trends in service revenues.

click to enlarge

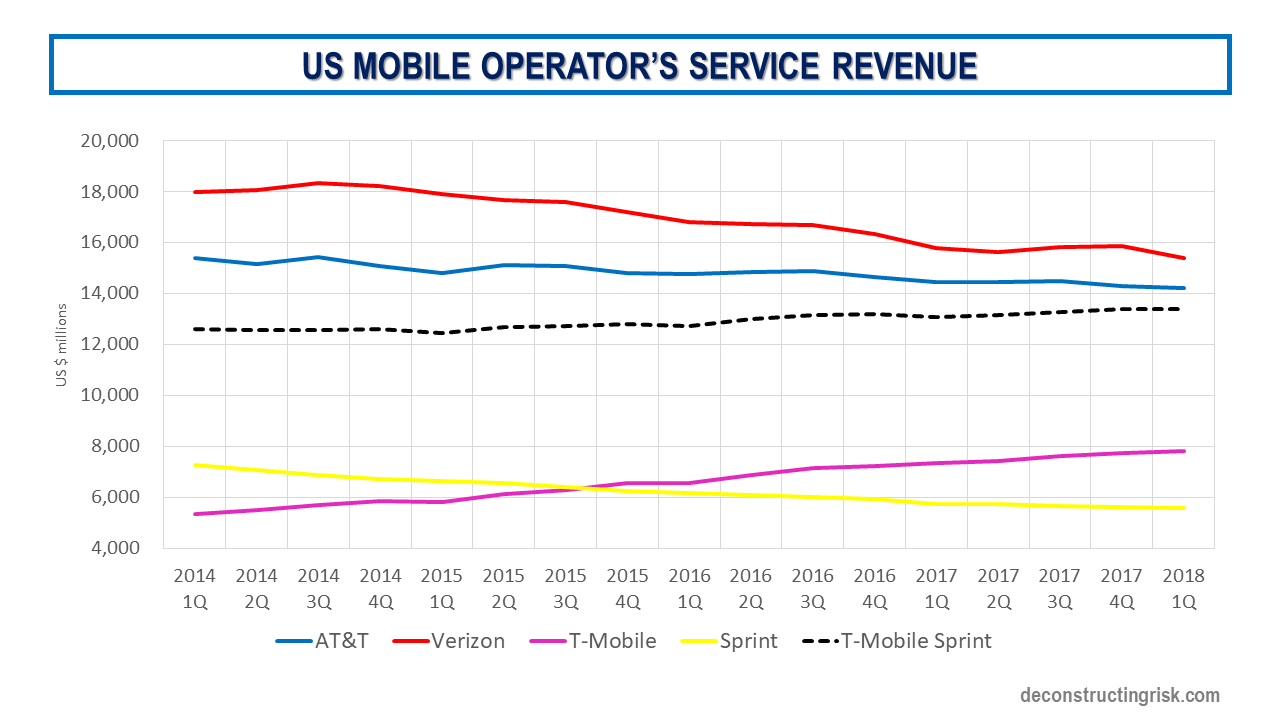
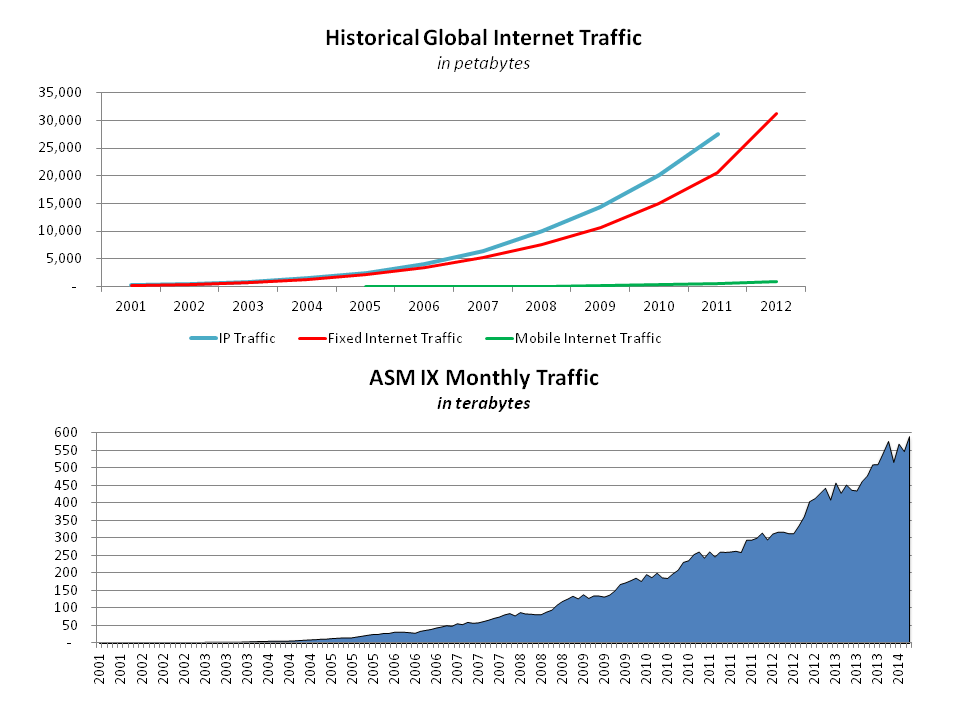
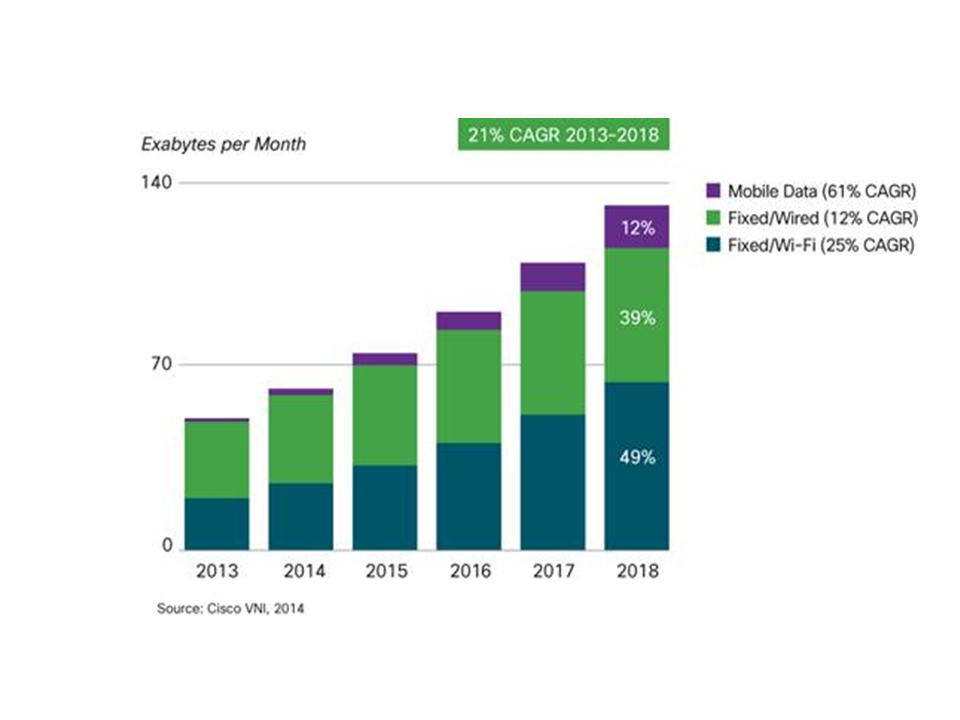
The mobile service revenues trends are remarkably similar to those in the enterprise and wholesale space. The graph above also shows the rationale for the T-Mobile/Sprint merger in terms of size as well as the impact of T-Mobile’s aggressive pricing strategy. All these trends are in the context of the insatiable increase in bandwidth traffic, as illustrated by the IP figures from Cisco below.

click to enlarge

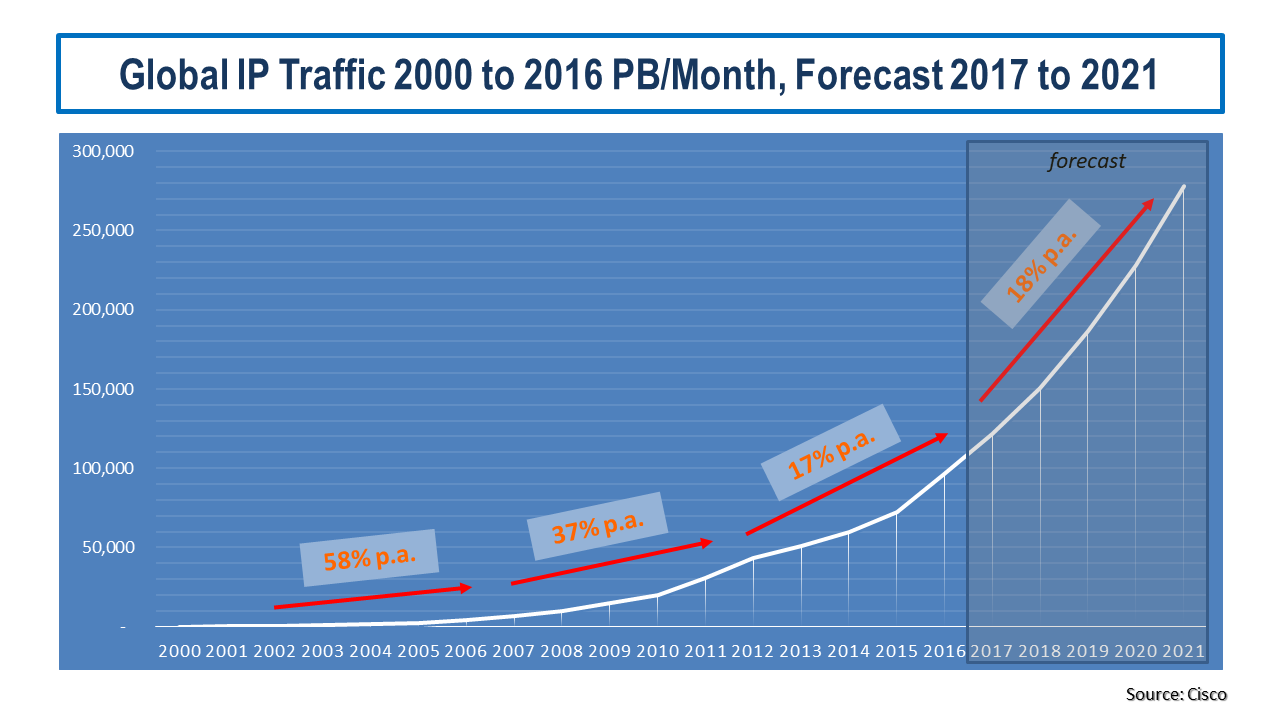
This report from 2017 by Oliver Wyman is one of the better ones and contains some illuminating context for the 5G era. It shows that in Europe despite a 40% annual increase in mobile subscribers and a 36% annual increase in European IP traffic from 2006 to 2016, mobile service revenue and total telecom service revenue decreased by 22% and 19% respectively, as per the graphic below.

click to enlarge

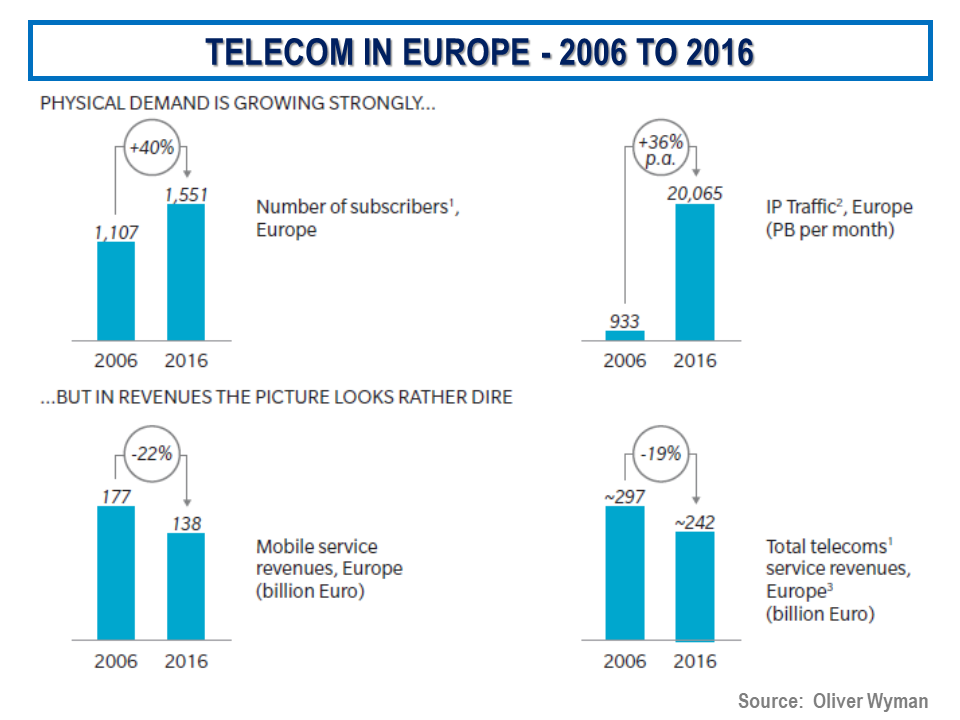
The Oliver Wyman report concludes as follows:

“In the next five to ten years, demand in fixed-line broadband bandwidth will grow exponentially, leading to speeds that can only be supplied by FTTH/B. Mobile broadband demand will follow in parallel. Virtual reality is the “killer app” that will drive massive demand. Mobile broadband supply will begin to reach its limits, with spectral efficiency gains and additional attractive spectrum in the current bands not growing as fast as they have in the past. High-frequency beam technology in 5G will be radically new and will be able to meet future demand. At the same time, however, it will create massive mobile backhaul demand. The outcome is likely to shake the industry, leading not only to a new balance of power between mobile-only and integrated/fixed-line operators, but also to new potential revenue growth for the first time in many years.”

Another interesting graphic from the report, as below, is the historical and projected broadband usage.

click to enlarge

This 2017 report from Deloitte argues that “5G, across both the core and radio access network, stands to have a potentially greater impact on the overall ecosystem than any previous wireless generation”. Deloitte sees a “convergence of supply between wireline and wireless broadband, as almost all devices become connected over short-range wireless”. Deloitte concludes that “with an increasingly converged ecosystem of network and content players, an increasingly software-managed and defined physical networking space, and the demands and needs of consumers becoming complex enough that they no longer can manage individually, 5G and its associated technologies may have the power to reset the wireless landscape”.

This paper from an Infinera executive called Jon Baldry highlights the need for “improvements to the overall network infrastructure in terms of performance, features and bandwidth” to support 5G “using software-defined networking (SDN) control and network functions virtualization (NFV) will play a major role in the optimization of the network”. I came across an interesting claim that SDN and network virtualisation can reduce opex and capex by 63% and 68% respectively compared to traditional telecom networking. Baldry concludes that “these improvements will drive new fiber builds, and fiber upgrades to an ever-growing number of cell sites, creating significant opportunity for cable MSOs and other wholesale operators to capture significant share of cell backhaul and fronthaul services for 4G and 5G mobile networks”.

Whether all these investments and resulting new networks will halt the declining revenue trend for the telecom sector or merely provide a survival avenue for certain telecoms is something I have yet to be convinced about. One thing seems certain however and that is that tradition telecom models will change beyond recognition in the forthcoming 5G era.

From tera to zetta and beyond to yotta

One of the great lessons of the internet crash was that the exponential growth in internet activity did not mean a similar level of growth in revenues for many of the new business models which were hyped. I can remember an insightful report before the crash which added up all the expected top-line growth projections and concluded that household expenditure on internet services would have to amount to 30% to 40% of household expenditures if projections were to be met!! Although on a personal basis household expenditure on internet access does seem to be growing all the time, it’s not at anything like the growth in our usage. Not yet anyway!

The graphs below shows the growth in global internet traffic from 2001 to 2012 according to Cisco, split by IP, fixed and mobile internet traffic. Although not on the same scale but in a similar vein, the lower graph shows the monthly peering traffic recorded over the Amsterdam Internet Exchange from July 2001 to May 2014

click to enlarge
Historical Internet Growth

For reference, gigabyte/terabyte/petabyte/exabyte/zettabyte/yottabyte is a kilobyte to the power of 3, 4, 5, 6, 7 and 8 respectively.

According to the latest projections from Cisco in their report this month “ The Zettabyte Era – Trends and Analysis”, global IP traffic will surpass the zettabyte threshold by the end of 2016 growing by approximately 20% per annum. Global IP traffic has increased fivefold over the past 5 years, and Cisco predicts an increase of threefold over the next 5 years.

click to enlarge
IP Growth Cisco June 2014 projections

The graph below illustrates the changes in devices used to access the internet behind Cisco’s projections.

click to enlarge
Connected Devices Cisco predictions June 2014

The report highlights a number of core trends including the following:
1) Transition to newer devices will alter network demand and usage.
2) M2M growth will drive the internet of everything.
3) Fixed broadband speeds will nearly triple by 2018.
4) Wi-Fi will dominate access technology.
5) Metro traffic will grow nearly twice as fast as long-haul traffic.
6) IP video will accelerate IP traffic growth through 2018.
7) Bottlenecks may result between peak and average demand times.

Bring on the yotta era!

Size of notional CDS market from 2001 to 2012

Sometime during early 2007 I recall having a conversation with a friend who was fretting about the dangers behind the exponential growth in the unregulated credit default swap (CDS) market. His concerns centred on the explosion in rampant speculation in the market by way of “naked” CDS trades (as opposed to covered CDS where the purchaser has an interest in the underlying instrument). The notional CDS market size was then estimated to be considerably higher than the whole of the global bond market (sovereign, municipal, corporate, mortgage and ABS). At the time, I didn’t appreciate what the growth in the CDS market meant. Obviously, the financial crisis dramatically demonstrated the impact!

More recently the London Whale episode at JP Morgan has again highlighted the thin line between the use of CDS for hedging and for speculation. Last week I tried to find a graph that illustrated what had happened to the size of the notional CDS market since the crisis and had to dig through data from the International Swaps and Derivatives Association (ISDA) to come up with the graph below.

click to enlarge

Size of notional CDS market 2001 to 2012

Comparing the size of the notional CDS market to the size of the bond market is a flawed metric as the notional CDS market figures are made up of buyers and sellers (in roughly equal measures) and many CDS can relate to the same underlying bond. Net CDS exposures are only estimated to be a few percent of the overall market today although that comparison ignores the not inconsiderable counterparty risk. Notwithstanding the validity of the comparison, the CDS market of $25 trillion as at the end of 2012 is still considerable compared to the approximate $100 trillion global bond market today. The dramatic changes in the size of both the CDS market (downward) and the bond market (upward) directly reflect the macroeconomic shifts as a result of the financial crisis.

The financial industry lobbied hard to ensure that CDS would not be treated as insurance under the Dodd-Frank reforms although standardized CDS are being moved to clearing houses under the regulations with approximately 10% of notional CDS being cleared in 2012 according to the ISDA. The other initiative to reduce systemic risk is portfolio compression exercises across the OTC swap market whereby existing trades are terminated and restructured in exchange for replacement trades with smaller notional sizes.

Although the industry argues that naked CDS increase the liquidity of the market and aid price discovery, there is mixed research on the topic from the academic world. In Europe, naked CDS on sovereign bonds was banned as a result of the volatility suffered by Greece during the Euro wobbles. The regulatory push of OTC markets to clearing houses does possibly raise new systemic risks associated with concentration of credit risk from clearing houses! Other unintended consequences of the Dodd Franks and Basel III regulatory changes is the futurization of swaps as outlined in Robert Litan’s fascinating article.

Anyway, before I say something silly on a subject I know little about, I just wanted to share the graph above. I had thought that the specialty insurance sector, particularly the property catastrophe reinsurers, may be suited for a variation on a capital structure arbitrage type trade, particularly when many such insurers are increasingly using sub-debt and hybrid instruments in their capital structures (with Solvency II likely to increase the trend) as a recent announcement by Twelve Capital illustrates. I wasn’t primarily focussed on a negative correlation type trade (e.g. long equity/short debt) but more as a way of hedging tail risk on particular natural catastrophe peak zones (e.g. by way of purchasing CDS on debt of a overexposed insurer to a particular zone). Unfortunately, CDS are not available on these mid sized firms (they are on the larger firms like Swiss and Munich Re) and even if they were they would not be available to a small time investor like me!