Tag Archives: systemic risk

Beautiful Models

It has been a while since I posted on dear old Solvency II (here). As highlighted in the previous post on potential losses, the insurance sector is perceived as having robust capital levels that mitigates against the current pricing and investment return headwinds. It is therefore interesting to look at some of detail emerging from the new Solvency II framework in Europe, including the mandatory disclosures in the new Solvency and Financial Condition Report (SFCR).

The June 2017 Financial Stability report from EIOPA, the European insurance regulatory, contains some interesting aggregate data from across the European insurance sector. The graph below shows solvency capital requirement (SCR) ratios, primarily driven by the standard formula, averaging consistently around 200% for non-life, life and composite insurers. The ratio is the regulatory capital requirement, as calculated by a mandated standard formula or a firm’s own internal model, divided by assets excess liabilities (as per Solvency II valuation rules). As the risk profile of each business model would suggest, the variability around the average SCR ratio is largest for the non-life insurers, followed by life insurers, with the least volatile being the composite insurers.

click to enlarge

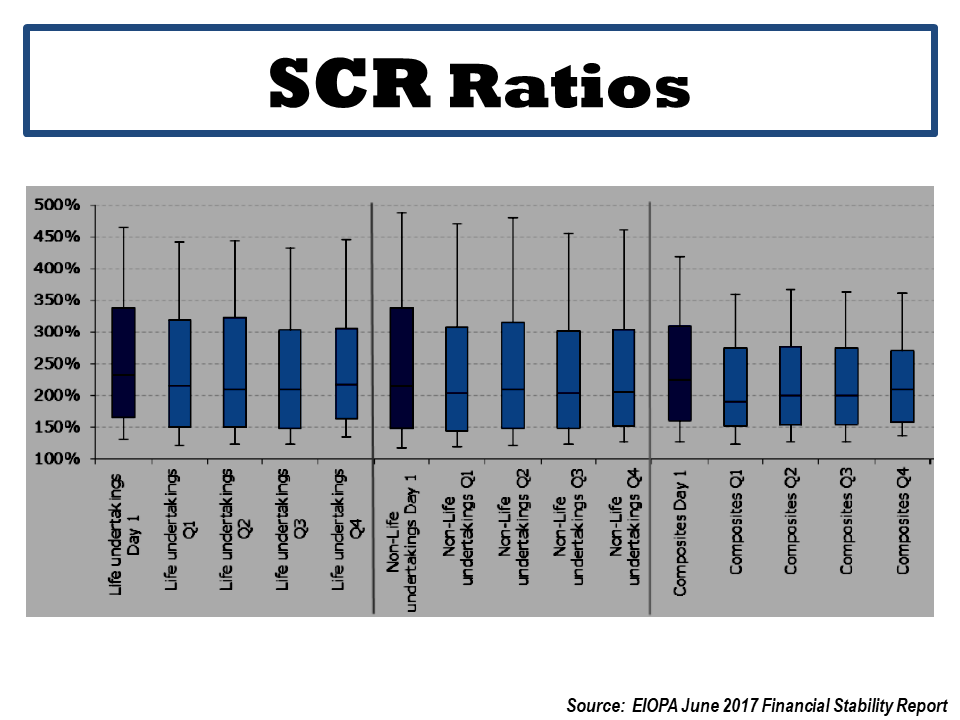
For some reason, which I can’t completely comprehend, the EIOPA Financial Stability report highlights differences in the SCR breakdown (as per the standard formula, expressed as a % of net basic SCR) across countries, as per the graph below, assumingly due to the different profiles of each country’s insurance sector.

click to enlarge

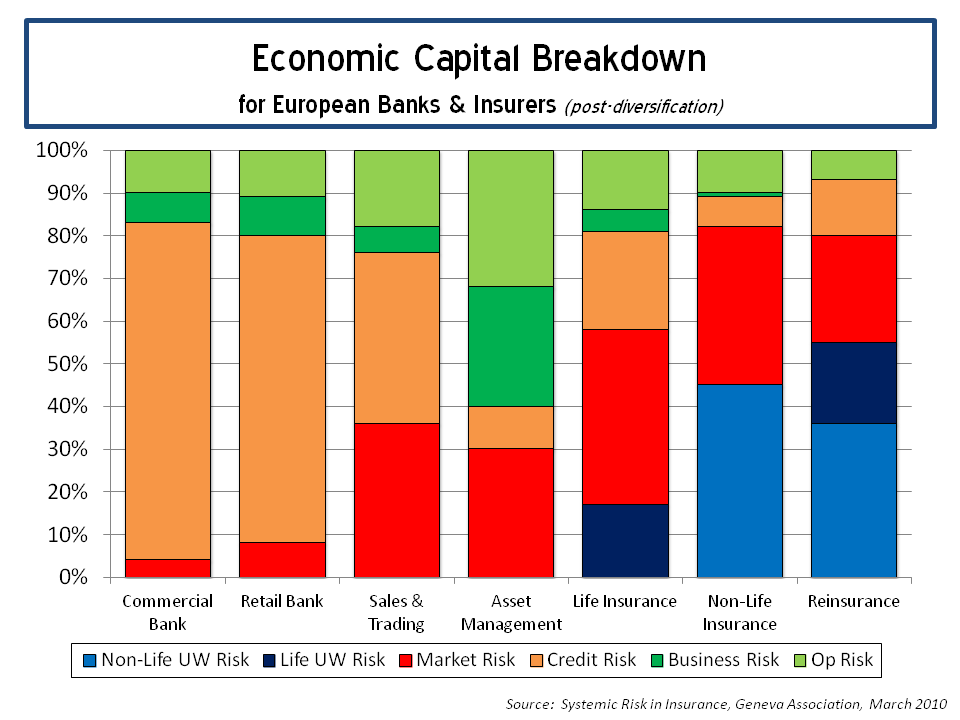
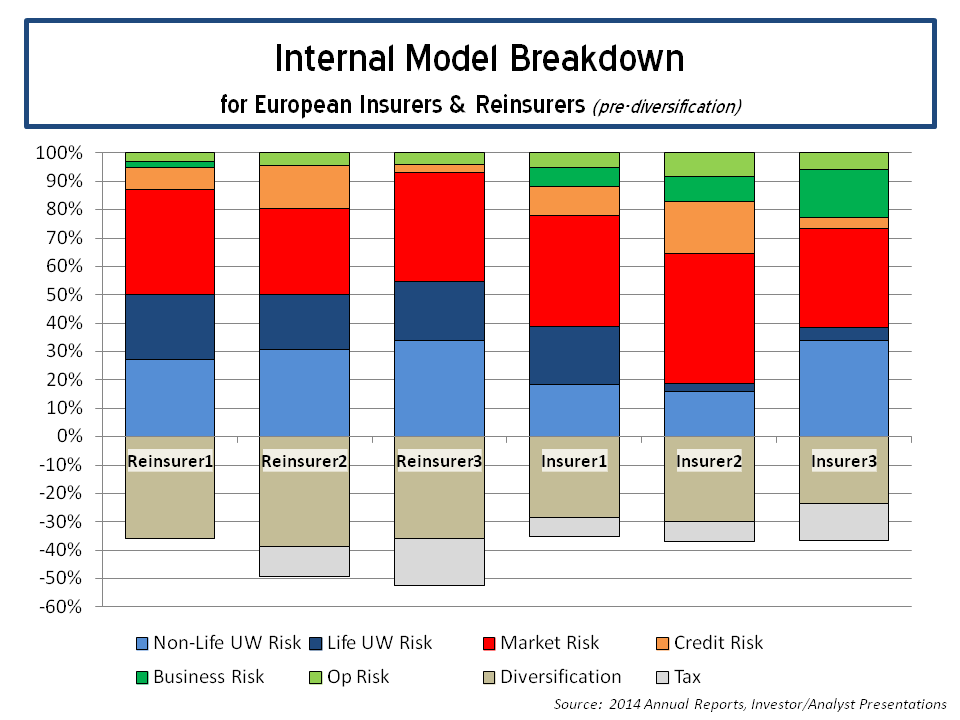
A review across several SFCRs from the larger European insurers and reinsurers who use internal models to calculate their SCRs highlights the differences in their risk profiles. A health warning on any such comparison should be stressed given the different risk categories and modelling methodologies used by each firm (the varying treatment of asset credit risk or business/operational risk are good examples of the differing approaches). The graph below shows each main risk category as a percentage of the undiversified total SCR.

click to enlarge

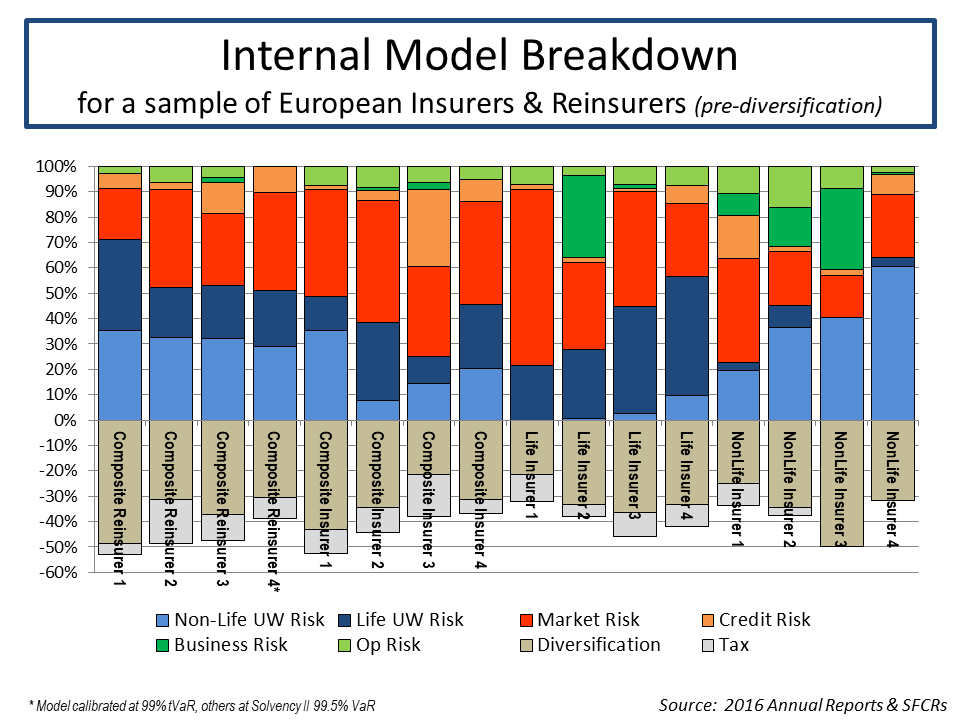
By way of putting the internal model components in context, the graph below shows the SCR breakdown as a percentage of total assets (which obviously reflects insurance liabilities and the associated capital held against same). This comparison is also fraught with difficulty as an (re)insurers’ total assets is not necessarily a reliable measure of extreme insurance exposure in the same way as risk weighted assets is for banks (used as the denominator in bank capital ratios). For example, some life insurers can have low insurance related liabilities and associated assets (e.g. for mortality related business) compared to other insurance products (e.g. most non-life exposures).

Notwithstanding that caveat, the graph below shows a marked difference between firms depending upon whether they are a reinsurer or insurer, or whether they are a life, non-life or composite insurer (other items such as retail versus commercial business, local or cross-border, specialty versus homogeneous are also factors).

click to enlarge

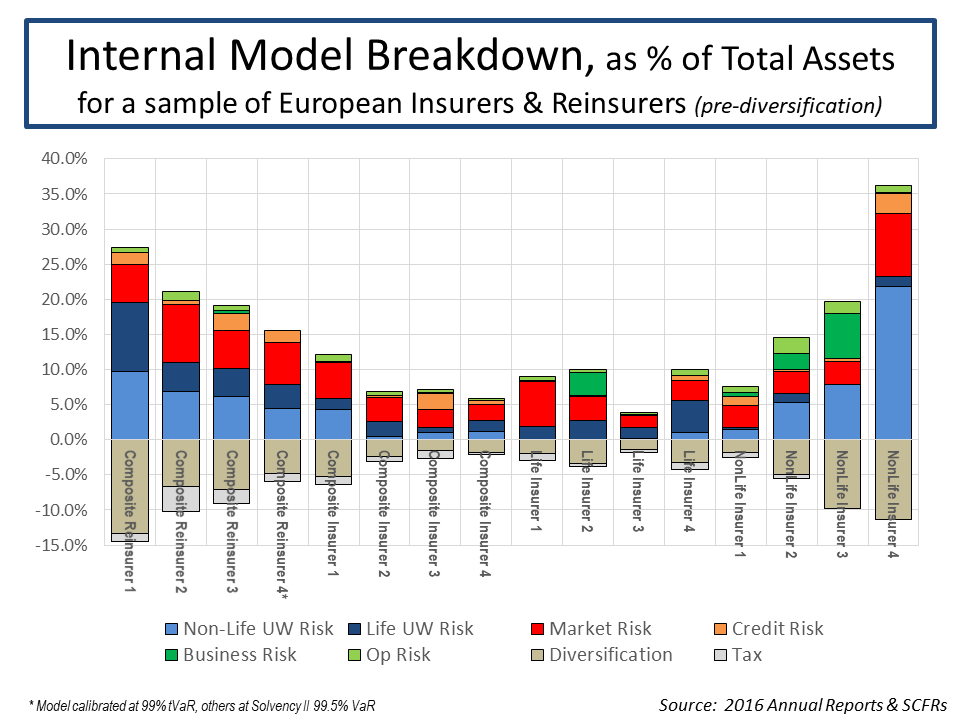
Initial reactions by commentators on the insurance sector to the disclosures by European insurers through SFCRs have been mixed. Some have expressed disappointment at the level and consistency of detail being disclosed. Regulators will have their hands full in ensuring that sufficiently robust standards relating to such disclosures are met.

Regulators will also have to ensure a fair and consistent approach across all European jurisdictions is adopted in calculating SCRs, particularly for those calculated using internal models, whilst avoiding the pitfall of forcing everybody to use the same assumptions and methodology. Recent reports suggest that EIOPA is looking for a greater role in approving all internal models across Europe. Systemic model risk under the proposed Basel II banking regulatory rules published in 2004 is arguably one of the contributors to the financial crisis.

Only time will tell if Solvency II has avoided the mistakes of Basel II in the handling of such beautiful models.

Divine Diversification

There have been some interesting developments in the US insurance sector on the issue of systemically important financial institutions (SIFIs). Metlife announced plans to separate some of their US life retail units to avoid the designation whilst shareholder pressure is mounting on AIG to do the same. These events are symptoms of global regulations designed to address the “too big to fail” issue through higher capital requirements. It is interesting however that these regulations are having an impact in the insurance sector rather than the more impactful issue within the banking sector (this may have to do with the situation where the larger banks will retain their SIFI status unless the splits are significant).

The developments also fly in the face of the risk management argument articulated by the insurance industry that diversification is the answer to the ills of failure. This is the case AIG are arguing to counter calls for a breakup. Indeed, the industry uses the diversification of risk in their defences against the sector being deemed of systemic import, as the exhibit below from a report on systemic risk in insurance from an industry group, the Geneva Association, in 2010 illustrates. Although the point is often laboured by the insurance sector (there still remains important correlations between each of the risk types), the graph does make a valid point.

click to enlargeEconomic Capital Breakdown for European Banks and Insurers

The 1st of January this year marked the introduction of the new Solvency II regulatory regime for insurers in Europe, some 15 years after work begun on the new regime. The new risk based solvency regime allows insurers to use their own internal models to calculate their required capital and to direct their risk management framework. A flurry of internal model approvals by EU regulators were announced in the run-up to the new year, although the amount of approvals was far short of that anticipated in the years running up to January 2016. There will no doubt be some messy teething issues as the new regime is introduced. In a recent post, I highlighted the hoped for increased disclosures from European insurers on their risk profiles which will result from Solvency II. It is interesting that Fitch came out his week and stated that “Solvency II metrics are not comparable between insurers due to their different calculation approaches and will therefore not be a direct driver of ratings” citing issues such as the application of transitional measures and different regulator approaches to internal model approvals.

I have written many times on the dangers of overtly generous diversification benefits (here, here, here, and here are just a few!) and this post continues that theme. A number of the large European insurers have already published details of their internal model calculations in annual reports, investor and analyst presentations. The graphic below shows the results from 3 large insurers and 3 large reinsurers which again illustrate the point on diversification between risk types.

click to enlargeInternal Model Breakdown for European Insurers and Reinsurers

The reinsurers show, as one would expect, the largest diversification benefit between risk types (remember there is also significant diversification benefits assumed within risk types, more on that later) ranging from 35% to 40%. The insurers, depending upon business mix, only show between 20% and 30% diversification across risk types. The impact of tax offsets is also interesting with one reinsurer claiming a further 17% benefit! A caveat on these figures is needed, as Fitch points out; as different firms use differing terminology and methodology (credit risk is a good example of significant differences). I compared the diversification benefits assumed by these firms against what the figure would be using the standard formula correlation matrix and the correlations assuming total independence between the risk types (e.g. square root of the sum of squares), as below.

click to enlargeDiversification Levels within European Insurers and Reinsurers

What can be seen clearly is that many of these firms, using their own internal models, are assuming diversification benefits roughly equal to that between those in the standard formula and those if the risk types were totally independent. I also included the diversification levels if 10% and 25% correlations were added to the correlation matrix in the standard formula. A valid question for these firms by investors is whether they are being overgenerous on their assumed diversification. The closer to total independence they are, the more sceptical I would be!

Assumed diversification within each risk type can also be material. Although I can understand arguments on underwriting risk types given different portfolio mixes, it is hard to understand the levels assumed within market risk, as the graph below on the disclosed figures from two firms show. Its hard for individual firms to argue they have material differing expectations of the interaction between interest rates, spreads, property, FX or equities!

click to enlargeDiversification Levels within Market Risk

Diversification within the life underwriting risk module can also be significant (e.g. 40% to 50%) particularly where firms write significant mortality and longevity type exposures. Within the non-life underwriting risk module, diversification between the premium, reserving and catastrophe risks also add-up. The correlations in the standard formula on diversification between business classes vary between 25% and 50%.

By way of a thought experiment, I constructed a non-life portfolio made up of five business classes (X1 to X5) with varying risk profiles (each class set with a return on equity expectation of between 10% and 12% at a capital level of 1 in 500 or 99.8% confidence level for each), as the graph below shows. Although many aggregate profiles may reflect ROEs of 10% to 12%, in my view, business classes in the current market are likely to have a more skewed profile around that range.

click to enlargeSample Insurance Portfolio Profile

I then aggregated the business classes at varying correlations (simple point correlations in the random variable generator before the imposition of the differing distributions) and added a net expense load of 5% across the portfolio (bringing the expected combined ratio from 90% to 95% for the portfolio). The different resulting portfolio ROEs for the different correlation levels shows the impact of each assumption, as below.

click to enlargePortfolio Risk Profile various correlations

The experiment shows that a reasonably diverse portfolio that can be expected to produce a risk adjusted ROE of between 14% and 12% (again at a 1 in 500 level)with correlations assumed at between 25% and 50% amongst the underlying business classes. If however, the correlations are between 75% and 100% then the same portfolio is only producing risk adjusted ROEs of between 10% and 4%.

As correlations tend to increase dramatically in stress situations, it highlights the dangers of overtly generous diversification assumptions and for me it illustrates the need to be wary of firms that claim divine diversification.

The Float Game Goes Into Overdrive

The IMF today warned about rising global financial stability risks. Amongst the risks, the IMF highlighted the “continued financial risk taking and search for yield keep stretching some asset valuations” and that “the low interest rate environment also poses challenges for long term investors, particularly for weaker life insurance companies in Europe”. The report states that “the roles and adequacy of existing risk-management tools should be re-examined to take into account the asset management industry’s role in systemic risk and the diversity of its products”.

In late March, Swiss Re issued a report which screamed that the “current high levels of financial repression create significant costs and lower long-term investors’ ability to channel funds into the real economy”. The financial repression, as Swiss Re calls it, has resulted in an estimated loss of $470 billion of interest income to US savers since the financial crisis which impacts both households and long-term investors such as insurance companies and pension funds.

Many market pundits, Stanley Druckenmiller for example, have warned of the destabilizing impacts of long term low interest rates. I have posted before on the trend of hedge funds using specialist insurance portfolios as a means to take on more risk on the asset side of the balance sheet in an attempt to copy the Warren Buffet insurance “float” investment model. My previous post highlighted Richard Brindle’s entry into this business model with a claim that they can dynamically adjust risk from one side of the balance sheet to the other. Besides the influx of hedge fund reinsurers, there are the established models of Fairfax and Markel who have successfully followed the “Buffet alpha” model in the past. A newer entry into this fold is the Chinese firm Fosun with their “insurance + investment twin-driver core strategy”.

The surprise entry by the Agnelli family’s investment firm EXOR into the Partner/AXIS marriage yesterday may be driven by a desire to use the reinsurer as a source of float for its investments according to this Artemis article on the analyst KBW’s reaction to the new offer. In the presentation on the offer from EXOR’s website, the firm cites as a rationale for a deal the “opportunity to exploit know-how synergies between EXOR investment activities” and the reinsurer’s investment portfolio.

Perhaps one of the most interesting articles on the current market in recent weeks is this one from the New York Times. The article cites the case of how the private equity firm Apollo Global Management purchased Aviva’s US life insurance portfolio, ran it through some legit regulatory and tax arbitrage structures with Goldman Sachs help, and ended up using some of the assets behind the insurance liabilities to prop up the struggling casino company behind Caesars and Harrah’s casinos. Now that’s a story that speaks volumes to me about where we are in the risk appetite spectrum today.

IOSCO Report on Corporate Bonds

Staff from IOSCO issued a report in April on the global corporate bond market. Although there was nothing earth shattering in the report, there was some interesting insights. The report highlighted 4 themes as below:

  1. Corporate bond markets have become bigger, more important for the real economy, and increasingly global in nature.
  2. Corporate bond markets have begun to fill an emerging gap in bank lending and long-term financing and are showing potential for servicing SME financing needs.
  3. A search for yield is driving investment in corporate bond markets. A changing interest rate environment will create winners and losers.
  4. Secondary markets are also transforming to adapt to a new economic and regulatory environment. Understanding the nature and reasons for this transformation is key in identifying future potential systemic risk issues and opportunities for market development.

The report also highlights the uncertainty that remains on secondary markets in the event of a interest rate shock and the $11 trillion worth of corporate debt (out of $50 trillion) due to mature in the next seven years.

Some interesting graphs in the report include the one below on the different characteristics of issuances pre- and post- 2007.

click to enlargeIOSCO Pre2007 and Post2007 Corporate Bond Issuance April 2014

Other interesting graphs highlight how corporate bonds are taking up the stagnation in bank credit in the US and the EU, and also highlight the boom in bank credit in China, as below.

click to enlargeIOSCO Bank Credit and Corporate Bond Markets April 2014

And finally the graphs below show the increase in non-financial corporate bond issuance and the modest growth in high yield issuance.

click to enlargeIOSCO Corporate Bond Markets April 2014


Size of notional CDS market from 2001 to 2012

Sometime during early 2007 I recall having a conversation with a friend who was fretting about the dangers behind the exponential growth in the unregulated credit default swap (CDS) market. His concerns centred on the explosion in rampant speculation in the market by way of “naked” CDS trades (as opposed to covered CDS where the purchaser has an interest in the underlying instrument). The notional CDS market size was then estimated to be considerably higher than the whole of the global bond market (sovereign, municipal, corporate, mortgage and ABS). At the time, I didn’t appreciate what the growth in the CDS market meant. Obviously, the financial crisis dramatically demonstrated the impact!

More recently the London Whale episode at JP Morgan has again highlighted the thin line between the use of CDS for hedging and for speculation. Last week I tried to find a graph that illustrated what had happened to the size of the notional CDS market since the crisis and had to dig through data from the International Swaps and Derivatives Association (ISDA) to come up with the graph below.

click to enlarge

Size of notional CDS market 2001 to 2012

Comparing the size of the notional CDS market to the size of the bond market is a flawed metric as the notional CDS market figures are made up of buyers and sellers (in roughly equal measures) and many CDS can relate to the same underlying bond. Net CDS exposures are only estimated to be a few percent of the overall market today although that comparison ignores the not inconsiderable counterparty risk. Notwithstanding the validity of the comparison, the CDS market of $25 trillion as at the end of 2012 is still considerable compared to the approximate $100 trillion global bond market today. The dramatic changes in the size of both the CDS market (downward) and the bond market (upward) directly reflect the macroeconomic shifts as a result of the financial crisis.

The financial industry lobbied hard to ensure that CDS would not be treated as insurance under the Dodd-Frank reforms although standardized CDS are being moved to clearing houses under the regulations with approximately 10% of notional CDS being cleared in 2012 according to the ISDA. The other initiative to reduce systemic risk is portfolio compression exercises across the OTC swap market whereby existing trades are terminated and restructured in exchange for replacement trades with smaller notional sizes.

Although the industry argues that naked CDS increase the liquidity of the market and aid price discovery, there is mixed research on the topic from the academic world. In Europe, naked CDS on sovereign bonds was banned as a result of the volatility suffered by Greece during the Euro wobbles. The regulatory push of OTC markets to clearing houses does possibly raise new systemic risks associated with concentration of credit risk from clearing houses! Other unintended consequences of the Dodd Franks and Basel III regulatory changes is the futurization of swaps as outlined in Robert Litan’s fascinating article.

Anyway, before I say something silly on a subject I know little about, I just wanted to share the graph above. I had thought that the specialty insurance sector, particularly the property catastrophe reinsurers, may be suited for a variation on a capital structure arbitrage type trade, particularly when many such insurers are increasingly using sub-debt and hybrid instruments in their capital structures (with Solvency II likely to increase the trend) as a recent announcement by Twelve Capital illustrates. I wasn’t primarily focussed on a negative correlation type trade (e.g. long equity/short debt) but more as a way of hedging tail risk on particular natural catastrophe peak zones (e.g. by way of purchasing CDS on debt of a overexposed insurer to a particular zone). Unfortunately, CDS are not available on these mid sized firms (they are on the larger firms like Swiss and Munich Re) and even if they were they would not be available to a small time investor like me!