
Sometime during early 2007 I recall having a conversation with a friend who was fretting about the dangers behind the exponential growth in the unregulated credit default swap (CDS) market. His concerns centred on the explosion in rampant speculation in the market by way of “naked” CDS trades (as opposed to covered CDS where the purchaser has an interest in the underlying instrument). The notional CDS market size was then estimated to be considerably higher than the whole of the global bond market (sovereign, municipal, corporate, mortgage and ABS). At the time, I didn’t appreciate what the growth in the CDS market meant. Obviously, the financial crisis dramatically demonstrated the impact!
More recently the London Whale episode at JP Morgan has again highlighted the thin line between the use of CDS for hedging and for speculation. Last week I tried to find a graph that illustrated what had happened to the size of the notional CDS market since the crisis and had to dig through data from the International Swaps and Derivatives Association (ISDA) to come up with the graph below.
click to enlarge
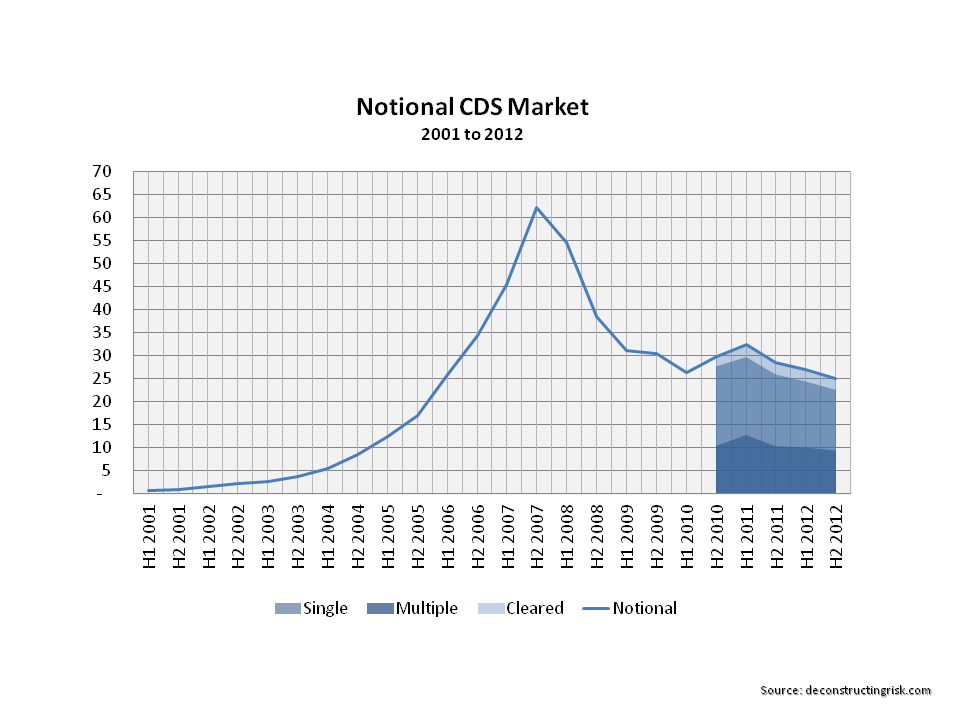
Comparing the size of the notional CDS market to the size of the bond market is a flawed metric as the notional CDS market figures are made up of buyers and sellers (in roughly equal measures) and many CDS can relate to the same underlying bond. Net CDS exposures are only estimated to be a few percent of the overall market today although that comparison ignores the not inconsiderable counterparty risk. Notwithstanding the validity of the comparison, the CDS market of $25 trillion as at the end of 2012 is still considerable compared to the approximate $100 trillion global bond market today. The dramatic changes in the size of both the CDS market (downward) and the bond market (upward) directly reflect the macroeconomic shifts as a result of the financial crisis.
The financial industry lobbied hard to ensure that CDS would not be treated as insurance under the Dodd-Frank reforms although standardized CDS are being moved to clearing houses under the regulations with approximately 10% of notional CDS being cleared in 2012 according to the ISDA. The other initiative to reduce systemic risk is portfolio compression exercises across the OTC swap market whereby existing trades are terminated and restructured in exchange for replacement trades with smaller notional sizes.
Although the industry argues that naked CDS increase the liquidity of the market and aid price discovery, there is mixed research on the topic from the academic world. In Europe, naked CDS on sovereign bonds was banned as a result of the volatility suffered by Greece during the Euro wobbles. The regulatory push of OTC markets to clearing houses does possibly raise new systemic risks associated with concentration of credit risk from clearing houses! Other unintended consequences of the Dodd Franks and Basel III regulatory changes is the futurization of swaps as outlined in Robert Litan’s fascinating article.
Anyway, before I say something silly on a subject I know little about, I just wanted to share the graph above. I had thought that the specialty insurance sector, particularly the property catastrophe reinsurers, may be suited for a variation on a capital structure arbitrage type trade, particularly when many such insurers are increasingly using sub-debt and hybrid instruments in their capital structures (with Solvency II likely to increase the trend) as a recent announcement by Twelve Capital illustrates. I wasn’t primarily focussed on a negative correlation type trade (e.g. long equity/short debt) but more as a way of hedging tail risk on particular natural catastrophe peak zones (e.g. by way of purchasing CDS on debt of a overexposed insurer to a particular zone). Unfortunately, CDS are not available on these mid sized firms (they are on the larger firms like Swiss and Munich Re) and even if they were they would not be available to a small time investor like me!
