I fear that the daily announcements on bankruptcies, specifically in the retail sector, is just the beginning of the journey into our new reality. Despite relatively positive noises from US banks about short term loan provisions and rebounding consumer spending, the real level of defaults, particularly in the SME sector, will not become clear until the sugar high of direct government stimulus is withdrawn. In the UK, for example, the furlough scheme is paying 80% of the wages of approximately 9 million workers and is currently costing the same in government spending monthly as the NHS. This UK subsidy is due to be withdrawn in October. In the US, the $600 weekly boost to unemployment payments is due to expire at the end of July.
The S&P forecasts for the default rate on US junk debt, as below, illustrates a current projection. There are many uncertainties on the course of the pandemic and the economic impacts over the coming months and quarters that will dictate which scenario is in our future.

It is therefore not surprising that the oft highlighted concerns about the leveraged loan market have been getting a lot of recent attention, as the following articles in the New Yorker and the Atlantic dramatically attest to – here and here. I would recommend both articles to all readers.
I must admit to initially feeling that the dangers have been exaggerated in these articles in the name of journalist license. After all, the risks associated with the leveraged loan market have been known for some time, as this post from last year illustrates, and therefore we should be assured that regulators and market participants are on top of the situation from a risk management perspective. Right? I thought I would dig a little further into the wonderful world of collateralized loan obligations, commonly referred to as CLOs, to find out.
First up is a report from the Bank of International Settlements (BIS) in September on the differences between collateralised debt obligations (CDOs) and CLOs. I was heartened to learn that “there are significant differences between the CLO market today and the CDO market prior to the great financial crisis”. The report highlighted the areas of difference as well as the areas of similarity as follows:
CLOs are less complex, avoiding the use of credit default swaps (CDS) and resecuritisations; they are little used as collateral in repo transactions; and they are less commonly funded by short-term borrowing than was the case for CDOs. In addition, there is better information about the direct exposures of banks. That said, there are also similarities between the CLO market today and the CDO market then, including some that could give rise to financial distress. These include the deteriorating credit quality of CLOs’ underlying assets; the opacity of indirect exposures; the high concentration of banks’ direct holdings; and the uncertain resilience of senior tranches, which depend crucially on the correlation of losses among underlying loans.
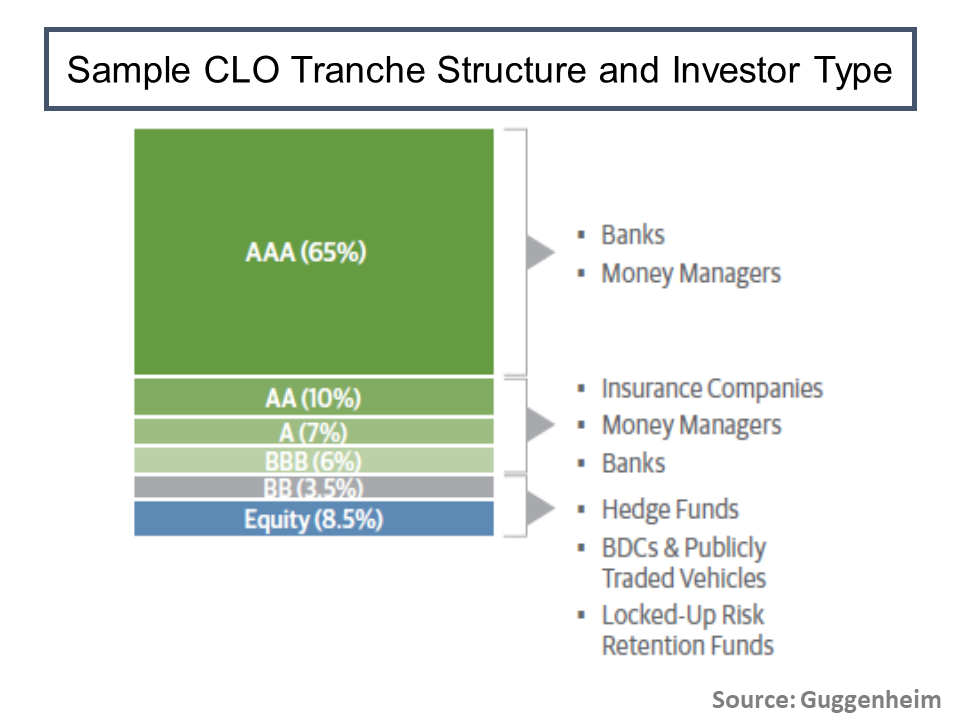
The phase “uncertain resilience of senior tranches” and the reference to correlation sent a cold shiver down my spine. According to BIS, the senior AAA tranches are higher up the structure (e.g. 65% versus 75%-80% in the bad old days), as this primer from Guggenheim illustrates:
As in the good old CDO days, the role of the rating agencies is critical to the CLO ecosystem. This May report from the European Securities and Markets Authority (ESMA) shows that EU regulators are focused on the practices the rating agencies are following in relation to their CLO ratings. I was struck by the paragraph below in the executive summary (not exactly the reassurance I was hoping for).
The future developments regarding the Covid 19 outbreak will be an important test for CLO methodologies, notably by testing: i) the approaches and the assumptions for the modelling of default correlation among the pool of underlying loans; and ii) the sensitivity of CLO credit ratings to how default and recovery rates are calibrated. Moreover, the surge of covenant-lite loans prevents lenders and investors from early warning indicators on the deterioration of the creditworthiness of the leveraged loans.
As regular readers will know, correlations used extensively in financial modelling is a source of much blog angst on my part (examples of previous posts include here, here and here). As I may have previously explained, I worked for over a decade in a quant driven firm back in the 1990’s that totally underestimated correlations in a tail event on assumed diverse risk portfolios. The firm I worked for did not survive long after the events of 9/11 and the increased correlation across risk classes that resulted. It was therefore with much bewilderment that I watched the blow-up in complex financial structures because of the financial crisis and the gross misunderstanding of tail correlations that were absent from historical data sets used to calibrate quant models. It is with some trepidation therefore when I see default correlation been discussed yet again in relation to the current COVID19 recession. To paraphrase Buffett, bad loans do not become better by simply repackaging them. Ditto for highly leveraged loans with the volume turned up to 11. As many commentators have highlighted in recent years and the Fed noted recently (see this post), the leverage in terms of debt to EBITDA ratios in leveraged loans has crept up to pre-financial crisis levels before the COVID19 global outbreak.
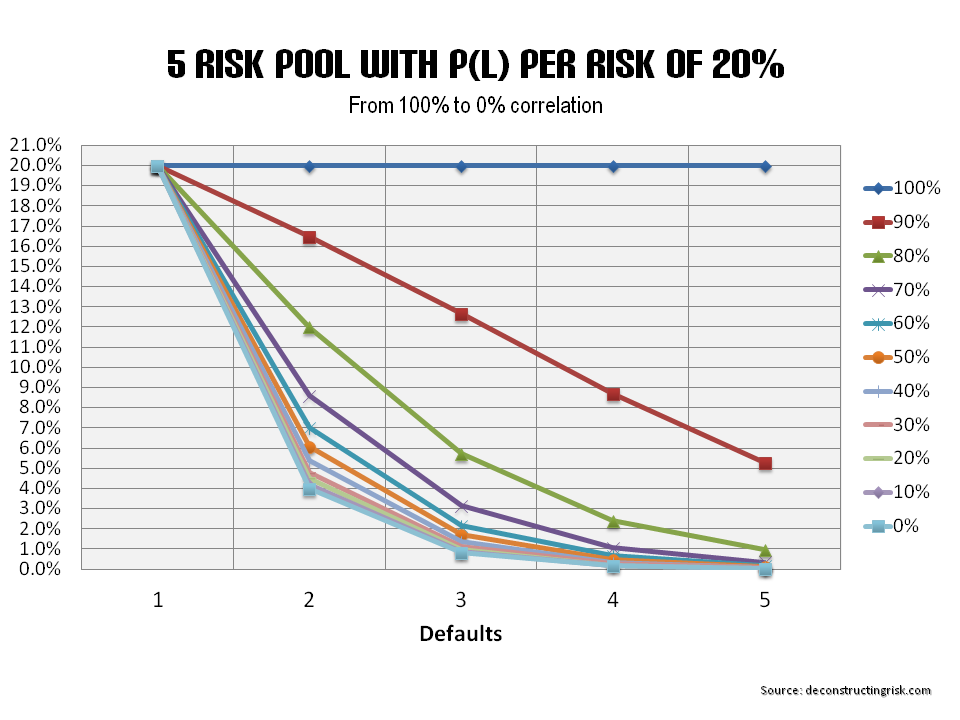
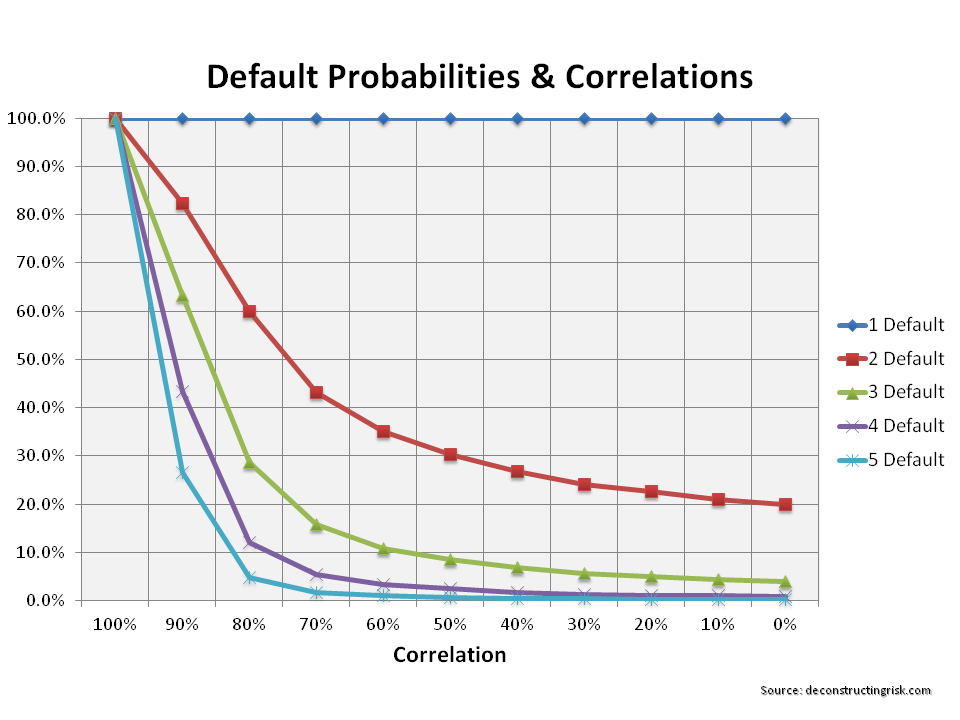
Next up, I found this blog from MSCI in early April insightful. By applying market implied default rates and volatilities from late March to MSCI’s CLO model of a sample 2019 CLO deal with 300 loans diversified across 10 industry sectors, they arrived at some disturbing results. Using 1-year default rates for individual risks of approximately 20% to 25% across most sectors (which does not seem outrageous to me when talking about leverage loans, they are after all highly leveraged!!), they estimated the probability of joint defaults using sample 2019 CLO deal at 1 and 3-year horizons as below.
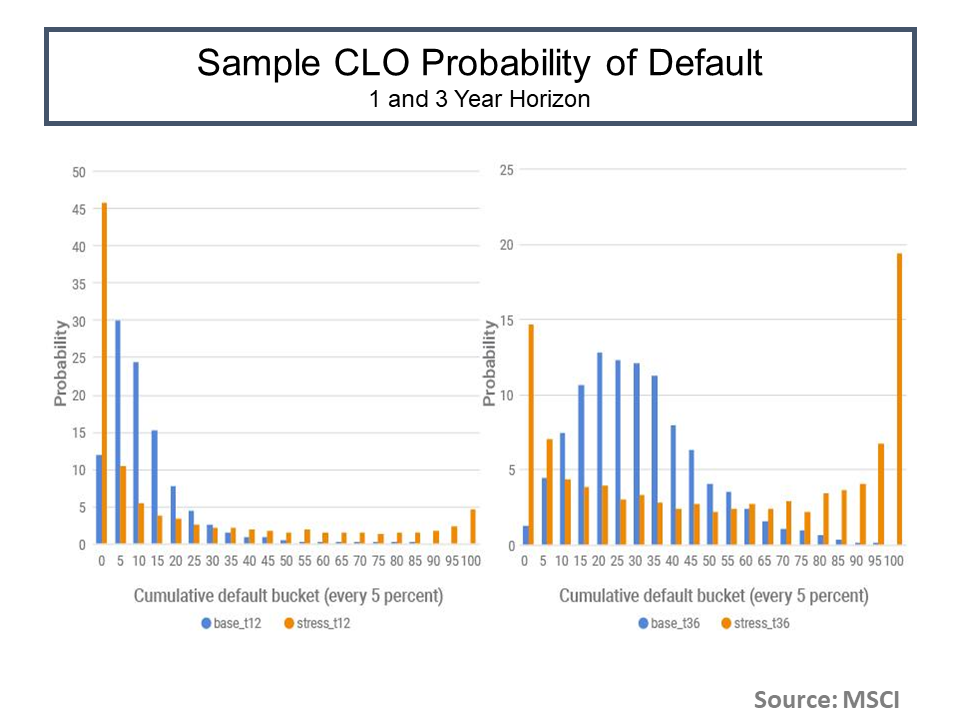
The MSCI analysis also showed the implied cross-sector default-rate correlations and a comparison with the correlations seen in the financial crisis, as below.
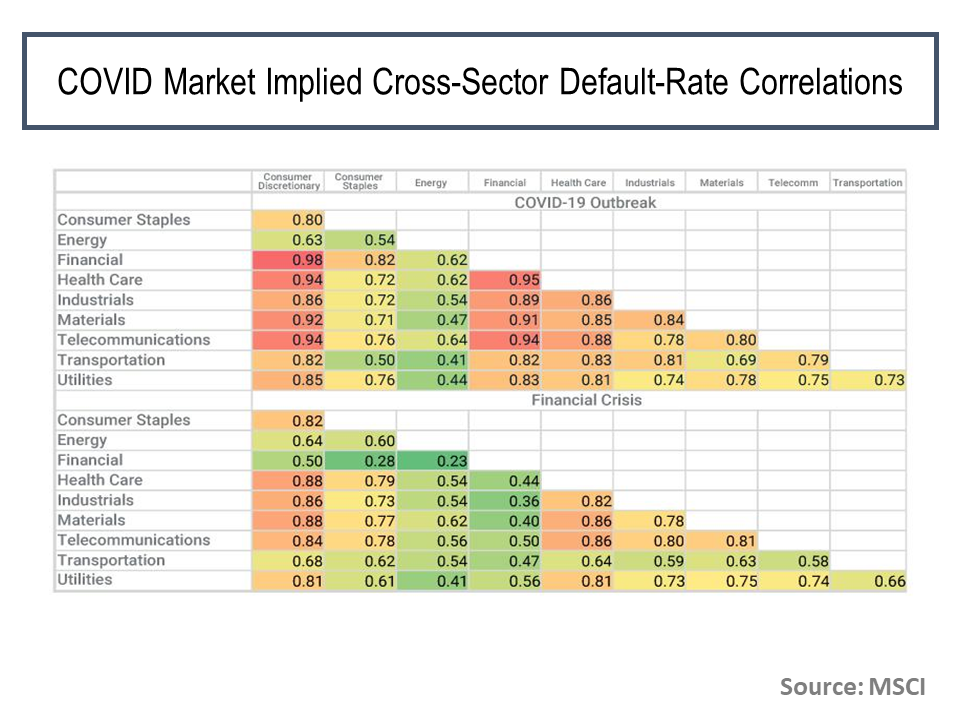
Even to me, some of these correlations (particularly those marked in red) look too elevated and the initial market reaction to COVID19 of shoot first and ask questions later may explain why. The MSCI article concludes with an emphasis on default correlation as below.
During periods of low default correlation, even with relatively high loan default rates, the tail probability of large total default is typically slim. If the current historically high default-rate correlations persist — combined with high loan default rates and default-rate volatility — our model indicates that a large portion of the examined pool may default and thereby threaten higher-credit tranches considered safe before the crisis
I decided to end my CLO journey by looking at what one rating agency was saying. S&P states that the factors which determine their CLO ratings are the weighted average rating of a portfolio, the diversity of the portfolio (in terms of obligors, industries, and countries), and the weighted average life of the portfolio. Well, we know we are dealing with highly leveraged loans, the junkiest if you like, with an average pre-COVID rating of B (although it is likely lower in today’s post-COVID environment) so I have focused on the portfolio diversity factor as the most important risk mitigant. Typically, CLOs have 100 to 300 loans which should give a degree of comfort although in a global recession, the number of loans matters less given the common risky credit profile of each. In my view, the more important differentiator in this recession is its character in terms of the split between sector winners and losers, as the extraordinary rally in the equity market of the technology giants dramatically illustrates.
S&P estimated that as at year end 2019, the average CLO contained approximately 200 loans and had an average industry diversity metric of 25. Its important to stress the word “average” as it can hid all sorts of misdemeanors. Focusing on the latter metric, I investigated further the industry sector classifications used by S&P. These classifications are different and more specific from the usual broad industry sectorial classifications used in equity markets given the nature of the leveraged loan market. There are 66 industry sectors in all used by S&P although 25 of the sectors make up 80% of the loans by size. Too many spurious variables are the myth that often lies at the quant portfolio diversification altar. To reflect the character of this recession, I judgmentally grouped the industry sectors into three exposure buckets – high, medium and low. By sector number the split was roughly equal to a third for each bucket. However, by loan amount the split was 36%, 46% and 18% for the high, medium and low sectors respectively. Over 80% in the high and medium buckets! That simplistic view of the exposure would make me very dubious about the real amount of diversification in these portfolios given the character of this recession. As a result, I would question the potential risk to the higher credit quality tranches of CLOs if their sole defense is diversification.
Maybe the New Yorker and Atlantic articles are not so sensationalist after all.