Tag Archives: AAPL

AAPL at $500 ($125 post-split)

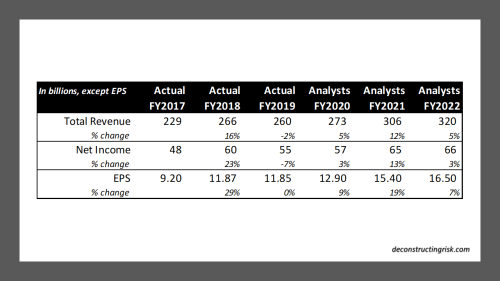
Back in early May, I postulated about AAPL’s future. In a heavily caveated post, I predicted iphone sales down from an assumed 188 million in FY2020 to 162 million and 180 million in FY2021 and FY2022 respectively. Well, AAPL stock is up 63% since that post, breaking past $400 ($100 post-split) at the start of August and now breaking through $500 ($125 post-split). I yet again totally called sentiment wrong on AAPL. The latest analyst estimates are below.

By my calculations, the average analyst estimates are assuming somewhere between 220 to 250 million iphone unit sales for FY2021 and FY2022, in addition to rejuvenated iPad and Mac sales plus strong services and other sales. Notwithstanding the growth in non-iphone items, revenues from iphone will still make up approximately 50% of the total in 2021 and 2022. In short, analysts are calling a monster super-cycle for AAPL on demand for their products as a result of our newly digitalised lives and 5G upgrades. I have been wrong enough times on my AAPL calls to accept these newly optimistic projections for the purposes of this post without comment. That said, the valuation of AAPL is clearly elevated as the following graph from a piece this week on Bloomberg from the ever-excellent John Authers shows.

My faithful AAPL chart on forward PE ratios excluding cash using current analysts estimates also illustrates the elevated valuation compared to recent history, as below.

This valuation is despite the risks that exist for AAPL. Navigating the full impacts of the COVID recession on employment and incomes is the obvious headwind. Other current risk includes potential pressure on margins from 5G phones, potential China disruptions from geopolitical tensions between the US and China (e.g. wechat ban), and potential pressure on apple store margins from developers (e.g. fornite/epic quarrel).

For what it is worth, accepting the sunny analyst projections and a heightened multiple around 20, I would put a sensible price around $340 ($85 post-split). Some mega-bulls on AAPL are raising their targets to $700 ($175 post-split). Given that I never thought we would again see the internet bubble behaviour of stocks rallying due to an upcoming stock split (as per AAPL and TSLA), AAPL is more likely to hit $700 ($175 post-split) than $340 ($85 post-split)!

Crazy silly stuff.

Musings on AAPL

In these weirdest of times, it is important to emphasis again Charlie Munger’s words of wisdom that “nobody knows what’s going to happen”. As developed countries across the world experiment with easing lock down measures, thoughts are moving to how economies can be re-opened. In what The Economist this week calls a 90% economy, they reflect upon a world where “the office is open but the pub is not”. A trite comment maybe but one that I think succinctly captures the new normal that those of us lucky enough to have our health can hope to be in for the next year.

Anyway, the point is that any projections in this environment are purely speculative. Add in my spotty record with AAPL, as this post in November attests to, and that AAPL have pulled guidance, highlights the likely futility of this post! Actually, I did dip my toe back in the water on AAPL around November after that post and when it shot up past $310 in January, I thanked the Gods and cashed out again (it went as high as $327 in February, daft!). The optimism about a new 5G iPhone super-cycle for next year that fed into that share price ramp has now been tempered by, well, the virus thing.

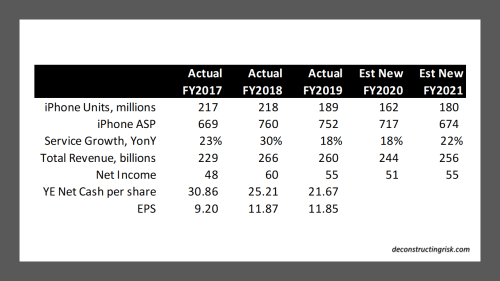
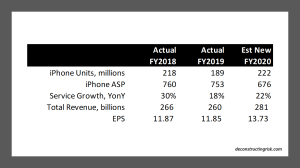
For my projections, I have assumed 26 million iPhone sales in the current quarter, down 27% on 2019, and 162 million for FY 2020, a 14% reduction from FY 2019. For FY 2021, I have assumed a pick-up in yearly unit iPhone sales due the launch of 5G iPhones, some in time for the holiday season, but at 180 units for FY 2021 it’s far short of the anticipated super-cycle refresh due to depressed consumer demand as the recession plays out next year. My assumptions are shown below:

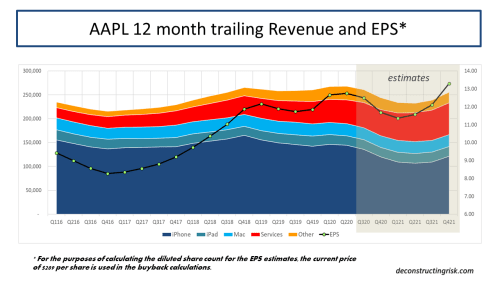
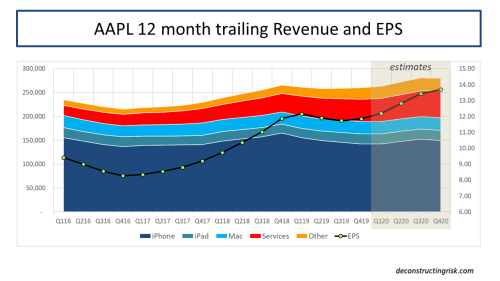
These assumptions are further illustrated in the trailing 12-month graph below.

Every great company needs an edge in the coming months and years to thrive. For AAPL, in addition to the quality of their products and their loyal installed base, their cash pile and their ability to manipulate share count through buy-backs has been a particular feature of their financial success in recent years, as the graph above clearly shows.

Although analysts were expecting a $75-100 billion increase in their buy-back programme in the Q2 quarter announcement last week, the announced $50 billion shows discipline and caution from management. I estimate that AAPL has spent approximately 130% of free cash-flow on dividends and buybacks in aggregate over the past 6 quarters, reducing their net cash balance by approximately $50 billion to $83 billion over those 6 quarters.

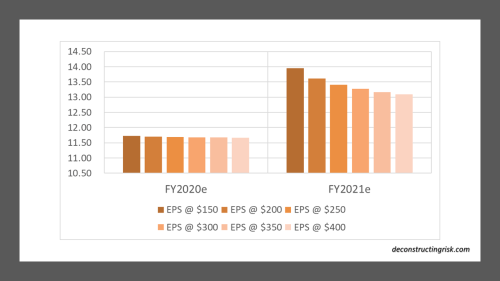
For the next 6 quarters to the end of FY 2021, I am assuming they return to shareholders, through both dividends and buy-backs, a similar amount of $126 billion to the previous 6 quarters, $105 billion through buy-backs alone. This shareholder return in terms of free cash-flow earned over the next 6 quarters would be an eye popping 200% according to my estimates. I further estimate a reduction in net cash on the balance sheet to approximately $40 billion by the end of FY 2021, an amount which I believe management, to be consistent with the firm’s DNA, should not feel comfortable going below for prudence sake (or to avail of further accretive M&A opportunities). One of the lessons of the COVID19 outbreak for well managed firms is surely the need for a contingency buffer against the unexpected. The resulting impact upon diluted share count and EPS of these assumptions at differing average buy-back share prices is shown below.

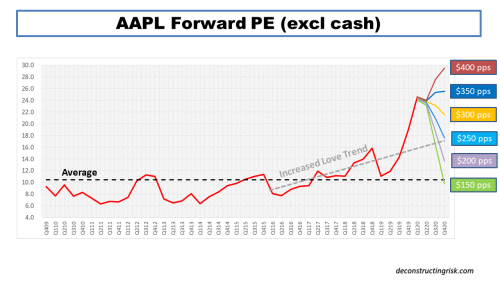
So, that just leaves the question of valuation. I will again warn that the subject matter in this post is based upon my assumptions which are highly speculative. I have proven myself to be hopelessly wrong in relation to AAPL at certain points in the past, so this time is unlikely to be any different! Using my preferred forward PE multiple excluding cash per share methodology, the graph below shows the forward multiples of my assumed performance over the next 6 quarters at share prices from $150 to $400, in increments of $50. The “increased love trend” is reflective of the higher multiple that AAPL has received as their service business has expanded and the hybrid hardware/software valuation has evolved.

Based upon this analysis, I would suggest that a share price below $250 should be considered as an entry point. Currently, I am uber bearish on equities and have exited 90%+ of my positions, taking advantage in recent weeks of this fairy tale rally (I mean, where is the upside from here?). Were AAPL to fall below $250, I would look closely at it again, albeit at a still heightened forward PE just below 18 based upon my estimates. Whether such an opportunity is afforded is anybody’s guess. As the man said, nobody knows.

Appletastic

Investing can be cruel. Every now and again I find it useful to look back at my investment decisions and try to learn from mistakes. At the beginning of his year, I was knocked sideways about the profit warning from Apple (AAPL) and exited one of my favourite stocks, and one of the most profitable over the previous 5 years, as per this post. If I had ignored all the negative news such as China worries or the implication of the dropping of the iPhone unit disclosures, and blindly held faith, I would have been rewarded by an increase of approximately 77% in the stock since the date of that post! Just shows how clueless this bogger is, dear reader!

In my defence, the graph below of the actual results for FY2019 illustrate how the issues that confronted AAPL at that time played out (more on the estimates for 2020 later).

click to enlarge

As can be seen clearly by the 12-month trailing revenue split, AAPL’s iPhone revenue plateaued in Q4 2018 and went into decline over FY2019 due to the failure of its strategy to push average iPhone prices higher. Even AAPL discovered that it is not immune to price elasticity. With the introduction of the iPhone 11 and the planned iPhone SE2, AAPL has now reverted its strategy back towards an ASP for the iPhone below $700 whilst it harvests its massive installed base for services. New cheaper handsets and the possibility of a new 5G super-cycle in 2020 has meant that AAPL is once again a market darling. Taking some of the current analyst projections for 2020 and the bullish Q1 2020 guidance from AAPL, I revised my 2020 estimates as below (I, like everybody else, must make my own estimates of handset unit sales each quarter).

click to enlarge

In terms of valuation, if I stick with my trusted AAPL valuation methodology of the forward PE excluding cash ratio analysis, using my EPS estimates for 2020, the stock is currently trading around a 17 PE, approximately 75% above the 10-year average! If I revert to the bull thesis (held before the meltdown late last year) that the market has recognised that AAPL is not purely a hardware firm any longer and deserves a hybrid hardware/software rating to reflect its growing services business, the current price is approximately 30% above the fitted trend line (as a proxy for the hybrid valuation), as below. I will have to come up with a better hybrid valuation methodology in the future but it’ll do for now (all ideas welcome on that front!).

click to enlarge

So, the bottom line is that AAPL is richly priced currently but waiting for a perfect entry point may be a mugs game for such a quality firm with the possibility of a new iPhone cycle just beginning. AAPL has yet again shown how it can adapt and change course when its strategy is clearly not working. Still, I’ll be a mug for a while longer to see how this market and overall valuations develop (there will likely be a host of upgrades for AAPL in the coming weeks). I do admit to missing having AAPL in my portfolio, so I will likely not wait too long before establishing an initial position again. If any of the hype around 5G becomes reality as 2020 develops, I can see AAPL being a big benefactor next year.

A naughty or nice 2019?

They say if you keep making the same prediction, at some stage it will come true. Well, my 2018 post a year ago on the return of volatility eventually proved prescient (I made the same prediction for 2017!). Besides the equity markets (multiple posts with the latest one here), the non-company specific topics covered in this blog in 2018 ranged from the telecom sector (here), insurance (here, here, and here), climate change (here and here), to my own favourite posts on artificial intelligence (here, here and here).

The most popular post (by far thanks to a repost by InsuranceLinked)) this year was on the Lloyds’ of London market (here) and I again undertake to try to post more on insurance specific topics in 2019. My company specific posts in 2018 centered on CenturyLink (CTL), Apple (AAPL), PaddyPowerBetfair (PPB.L), and Nvidia (NVDA). Given that I am now on the side-lines on all these names, except CTL, until their operating results justify my estimate of fair value and the market direction is clearer, I hope to widen the range of firms I will post on in 2019, time permitting. Although this blog is primarily a means of trying to clarify my own thoughts on various topics by means of a public diary of sorts, it is gratifying to see that I got the highest number of views and visitors in 2018. I am most grateful to you, dear reader, for that.

In terms of predictions for the 2019 equity markets, the graph below shows the latest targets from market analysts. Given the volatility in Q4 2018, it is unsurprising that the range of estimates for 2019 is wider than previously. At the beginning of 2018, the consensus EPS estimate for the S&P500 was $146.00 with an average multiple just below 20. Current 2018 estimates of $157.00 resulted in a multiple of 16 for the year end S&P500 number. The drop from 20 to 16 illustrates the level of uncertainty in the current market

click to enlarge

For 2019, the consensus EPS estimate is (currently) $171.00 with an average 2019 year-end target of 2,900 implying a 17 multiple. Given that this EPS estimate of 9% growth includes sectors such as energy with an assumed healthy 10% EPS growth projection despite the oil price drop, it’s probable that this EPS estimate will come down during the upcoming earnings season as firms err on the conservative side for their 2019 projections.

The bears point to building pressures on top-line growth and on record profit margins. The golden boy of the moment, Michael Wilson of Morgan Stanley, calls the current 2019 EPS estimates “lofty”. The bulls point to the newly established (as of last Friday) Powell Put and the likely resolution of the US-China trade spat (because both sides need it). I am still dubious on a significant or timely relaxation of global quantitative tightening and don’t feel particularly inclined to bet money on the Orange One’s negotiating prowess with China. My guess is the Chinese will give enough for a fudge but not enough to satisfy Trump’s narcissistic need (and political need?) for a visible outright victory. The NAFTA negotiations and his stance on the Wall show outcomes bear little relation to the rhetoric of the man. These issues will be the story of 2019. Plus Brexit of course (or as I suspect the lack thereof).

Until we get further insight from the Q4 earnings calls, my current base assumption of 4% EPS growth to $164 with a multiple of 15 to 16 implies the S&P500 will be range bound around current levels of 2,400 – 2,600. Hopefully with less big moves up or down!

Historically, a non-recessionary bear market lasts on average 7 months according to Ed Clissold of Ned Davis Research (see their 2019 report here). According to Bank of America, since 1950 the S&P 500 has endured 11 retreats of 12% or more in prolonged bull markets with these corrections lasting 8 months on average. The exhibit below suggests that such corrections only take 5 months to recover peak to trough.

click to enlarge

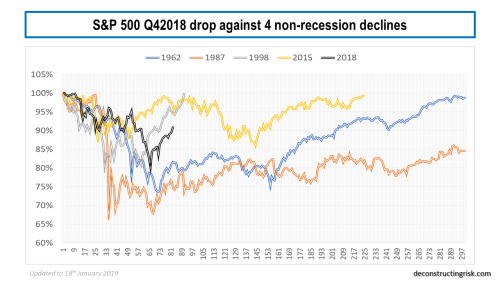
To get a feel for the possible direction of the S&P500 over 2019, I looked at the historical path of the index over 300 trading days after a peak for 4 non-recessionary and 4 recessionary periods (remember recessions are usually declared after they have begun), as below.

Note: These graphs have been subsequently updated for the S&P500 close to the 18th January 2019. 

click to enlarges&p500 q42018 drop compared to 4 nonrecession drops in 1962 1987 1998 & 2015 updated
 

click to enlarges&p500 q42018 drop compared to 4 recession drops in 1957 1974 1990 & 2000 updated


I will leave it to you, dear reader, to decide which path represents the most likely one for 2019. It is interesting that the 1957 track most closely matches the moves to date  (Ed: as per the date of the post, obviously not after that date!) but history rarely exactly rhymes. I have no idea whether 2019 will be naughty or nice for equity investors. I can predict with 100% certainty that it will not be dull….

Given that Brightwater’s pure Alpha fund has reportingly returned an impressive 14.6% for 2018 net of fees, I will leave the last word to Ray Dalio, who has featured regularly in this blog in 2018, as per his recent article (which I highly recommend):

Typically at this phase of the short-term debt cycle (which is where we are now), the prices of the hottest stocks and other equity-like assets that do well when growth is strong (e.g., private equity and real estate) decline and corporate credit spreads and credit risks start to rise. Typically, that happens in the areas that have had the biggest debt growth, especially if that happens in the largely unregulated shadow banking system (i.e., the non-bank lending system). In the last cycle, it was in the mortgage debt market. In this cycle, it has been in corporate and government debt markets.

When the cracks start to appear, both those problems that one can anticipate and those that one can’t start to appear, so it is especially important to identify them quickly and stay one step ahead of them.

So, it appears to me that we are in the late stages of both the short-term and long-term debt cycles. In other words, a) we are in the late-cycle phase of the short-term debt cycle when profit and earnings growth are still strong and the tightening of credit is causing asset prices to decline, and b) we are in the late-cycle phase of the long-term debt cycle when asset prices and economies are sensitive to tightenings and when central banks don’t have much power to ease credit.

A very happy and healthy 2019 to all.

Apple Crush

The news just keeps getting worse for Apple (AAPL) with all the negative rumours being confirmed by the top-line warning announced last night. In my last post on AAPL, I ruminated that the stock could fall as low as $160. Well, it was trading below that figure prior to last night’s warning and it looks set to possibly test $140 today. The only bright side of the announcement is that it quantifies the bad news which is the first step towards reaching a bottom. The enviable round of analyst downgrades means the next few weeks will likely be choppy for both AAPL and the market.

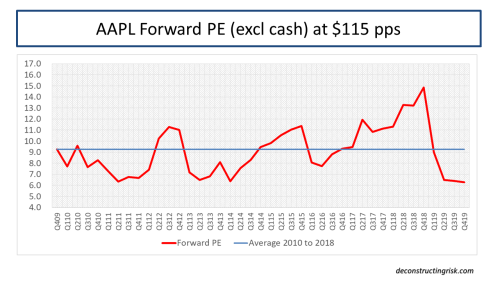
In the interim, I quickly revised some numbers in my model, as below.

click to enlarge

Based upon my historical forward multiples excluding cash, whilst reverting to a straight average multiple of 9 compared to an increasing multiple (that was in another era now!), my new estimate of how low AAPL can go is $115 per share, a near 30% drop from last night’s close.

click to enlarge

Whether I will be a buyer around the $120 level will depend upon what the overall market is doing. Best to wait on the side-lines for this drama to unfold.