They say if you keep making the same prediction, at some stage it will come true. Well, my 2018 post a year ago on the return of volatility eventually proved prescient (I made the same prediction for 2017!). Besides the equity markets (multiple posts with the latest one here), the non-company specific topics covered in this blog in 2018 ranged from the telecom sector (here), insurance (here, here, and here), climate change (here and here), to my own favourite posts on artificial intelligence (here, here and here).
The most popular post (by far thanks to a repost by InsuranceLinked)) this year was on the Lloyds’ of London market (here) and I again undertake to try to post more on insurance specific topics in 2019. My company specific posts in 2018 centered on CenturyLink (CTL), Apple (AAPL), PaddyPowerBetfair (PPB.L), and Nvidia (NVDA). Given that I am now on the side-lines on all these names, except CTL, until their operating results justify my estimate of fair value and the market direction is clearer, I hope to widen the range of firms I will post on in 2019, time permitting. Although this blog is primarily a means of trying to clarify my own thoughts on various topics by means of a public diary of sorts, it is gratifying to see that I got the highest number of views and visitors in 2018. I am most grateful to you, dear reader, for that.
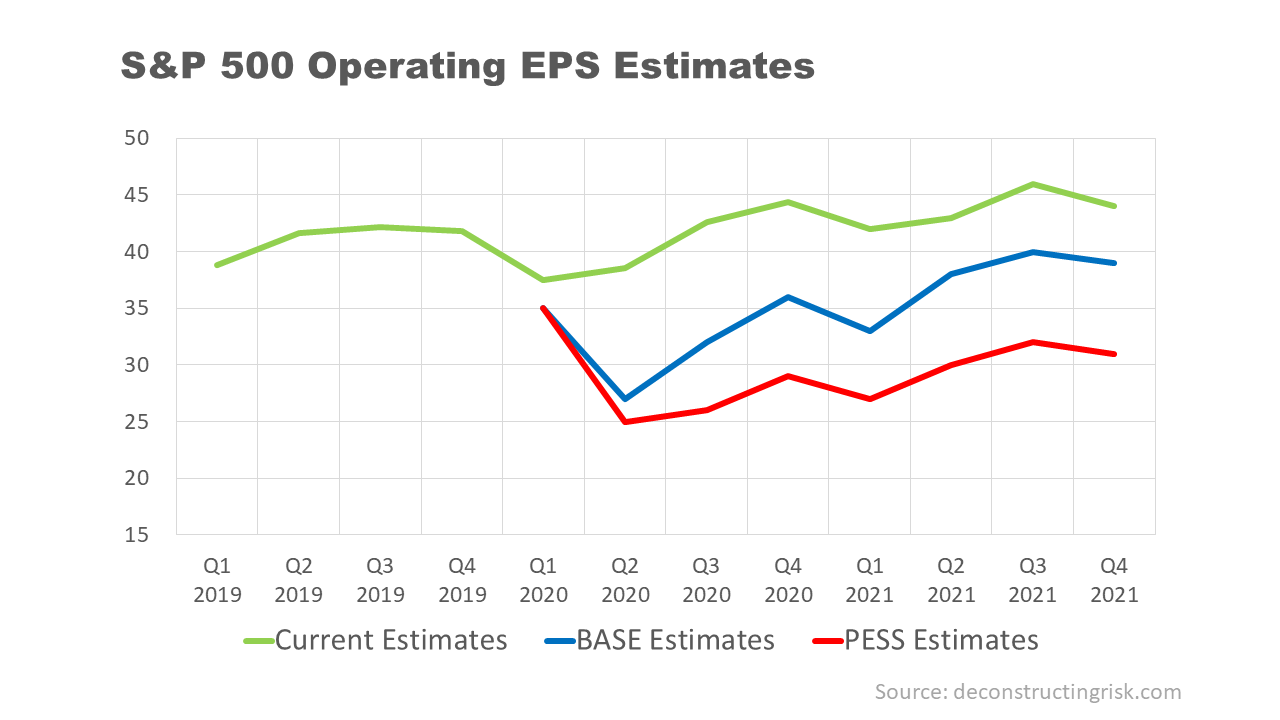
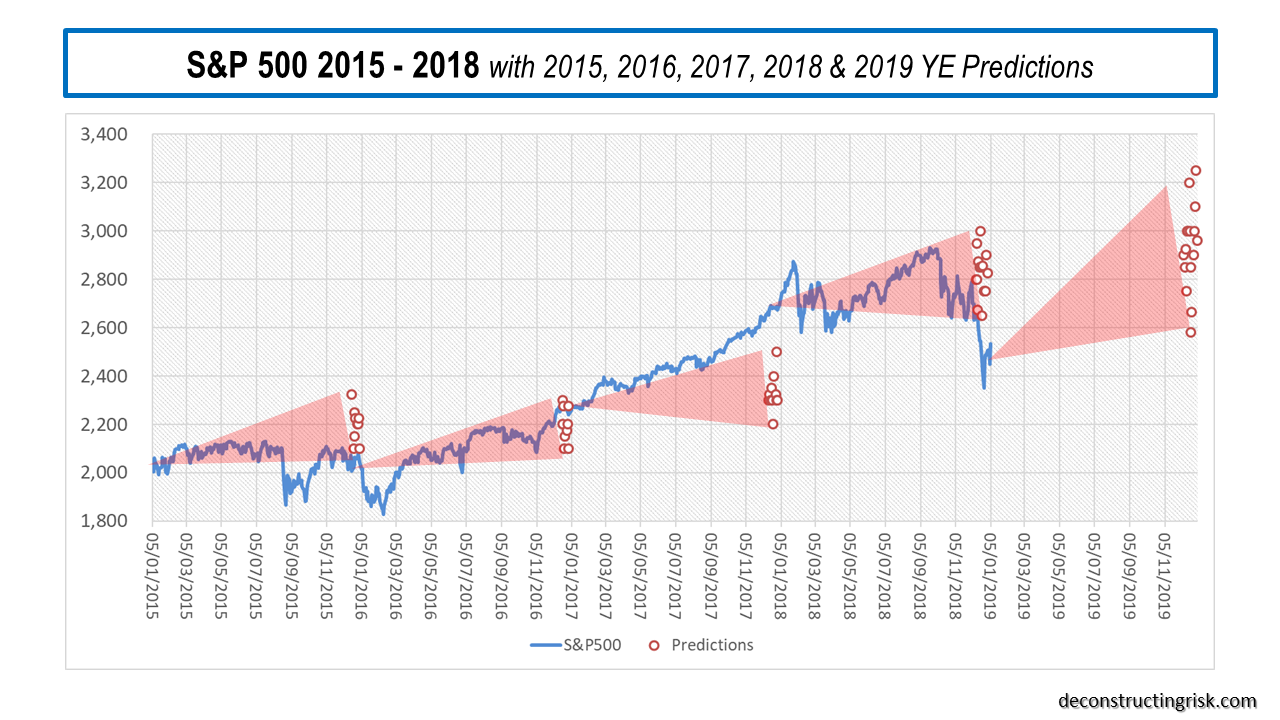
In terms of predictions for the 2019 equity markets, the graph below shows the latest targets from market analysts. Given the volatility in Q4 2018, it is unsurprising that the range of estimates for 2019 is wider than previously. At the beginning of 2018, the consensus EPS estimate for the S&P500 was $146.00 with an average multiple just below 20. Current 2018 estimates of $157.00 resulted in a multiple of 16 for the year end S&P500 number. The drop from 20 to 16 illustrates the level of uncertainty in the current market
click to enlarge

For 2019, the consensus EPS estimate is (currently) $171.00 with an average 2019 year-end target of 2,900 implying a 17 multiple. Given that this EPS estimate of 9% growth includes sectors such as energy with an assumed healthy 10% EPS growth projection despite the oil price drop, it’s probable that this EPS estimate will come down during the upcoming earnings season as firms err on the conservative side for their 2019 projections.
The bears point to building pressures on top-line growth and on record profit margins. The golden boy of the moment, Michael Wilson of Morgan Stanley, calls the current 2019 EPS estimates “lofty”. The bulls point to the newly established (as of last Friday) Powell Put and the likely resolution of the US-China trade spat (because both sides need it). I am still dubious on a significant or timely relaxation of global quantitative tightening and don’t feel particularly inclined to bet money on the Orange One’s negotiating prowess with China. My guess is the Chinese will give enough for a fudge but not enough to satisfy Trump’s narcissistic need (and political need?) for a visible outright victory. The NAFTA negotiations and his stance on the Wall show outcomes bear little relation to the rhetoric of the man. These issues will be the story of 2019. Plus Brexit of course (or as I suspect the lack thereof).
Until we get further insight from the Q4 earnings calls, my current base assumption of 4% EPS growth to $164 with a multiple of 15 to 16 implies the S&P500 will be range bound around current levels of 2,400 – 2,600. Hopefully with less big moves up or down!
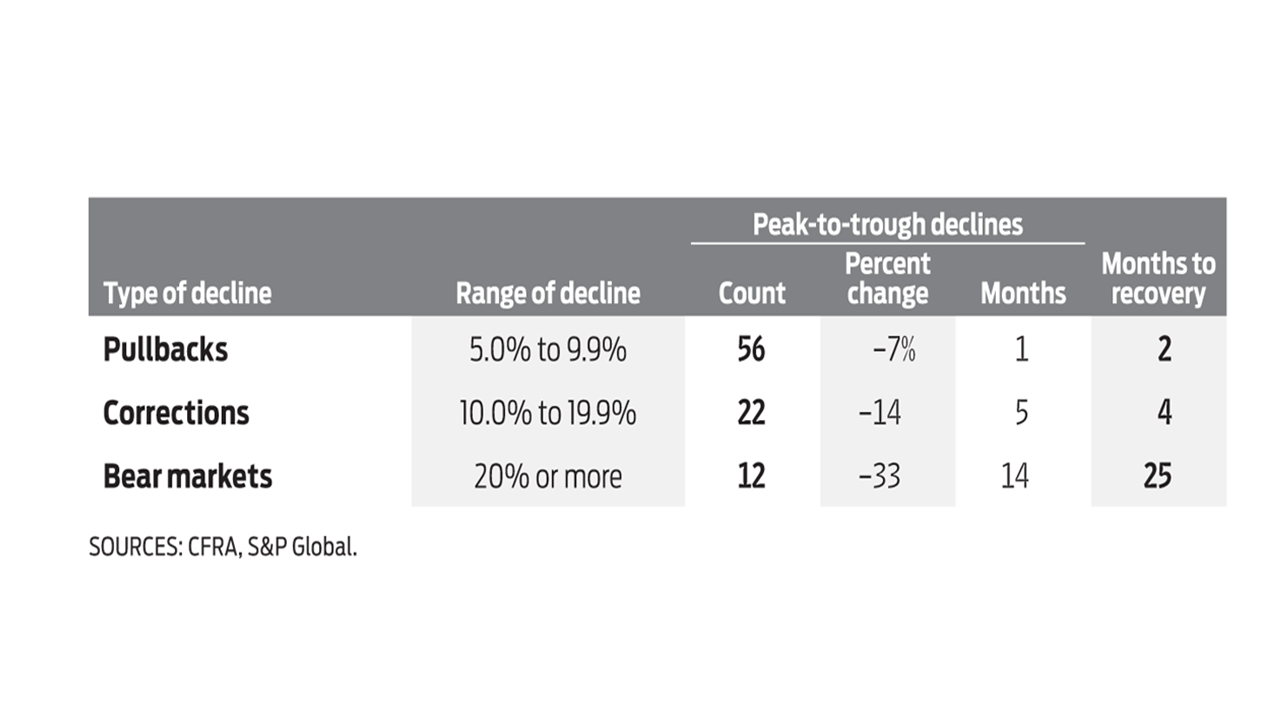
Historically, a non-recessionary bear market lasts on average 7 months according to Ed Clissold of Ned Davis Research (see their 2019 report here). According to Bank of America, since 1950 the S&P 500 has endured 11 retreats of 12% or more in prolonged bull markets with these corrections lasting 8 months on average. The exhibit below suggests that such corrections only take 5 months to recover peak to trough.
click to enlarge

To get a feel for the possible direction of the S&P500 over 2019, I looked at the historical path of the index over 300 trading days after a peak for 4 non-recessionary and 4 recessionary periods (remember recessions are usually declared after they have begun), as below.
Note: These graphs have been subsequently updated for the S&P500 close to the 18th January 2019.
click to enlarge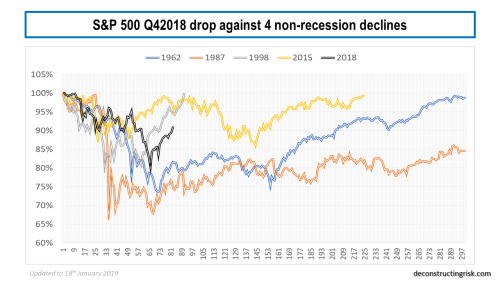
click to enlarge
I will leave it to you, dear reader, to decide which path represents the most likely one for 2019. It is interesting that the 1957 track most closely matches the moves to date (Ed: as per the date of the post, obviously not after that date!) but history rarely exactly rhymes. I have no idea whether 2019 will be naughty or nice for equity investors. I can predict with 100% certainty that it will not be dull….
Given that Brightwater’s pure Alpha fund has reportingly returned an impressive 14.6% for 2018 net of fees, I will leave the last word to Ray Dalio, who has featured regularly in this blog in 2018, as per his recent article (which I highly recommend):
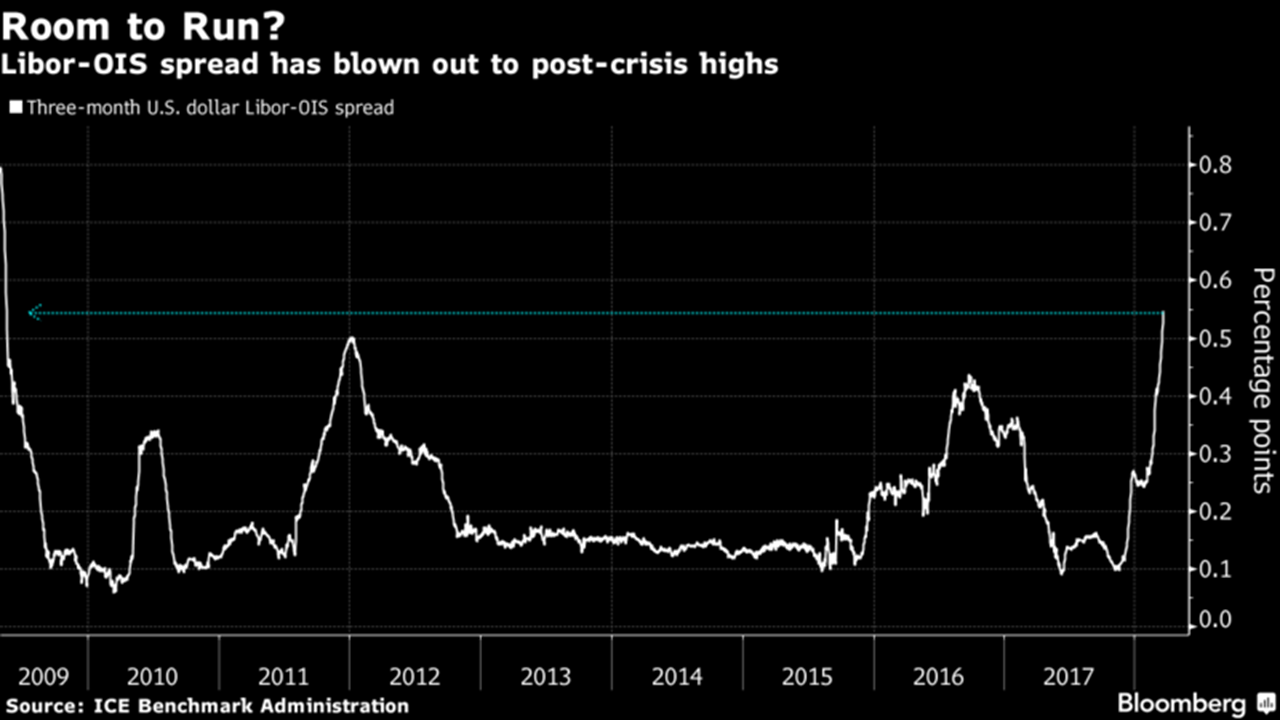
Typically at this phase of the short-term debt cycle (which is where we are now), the prices of the hottest stocks and other equity-like assets that do well when growth is strong (e.g., private equity and real estate) decline and corporate credit spreads and credit risks start to rise. Typically, that happens in the areas that have had the biggest debt growth, especially if that happens in the largely unregulated shadow banking system (i.e., the non-bank lending system). In the last cycle, it was in the mortgage debt market. In this cycle, it has been in corporate and government debt markets.
When the cracks start to appear, both those problems that one can anticipate and those that one can’t start to appear, so it is especially important to identify them quickly and stay one step ahead of them.
So, it appears to me that we are in the late stages of both the short-term and long-term debt cycles. In other words, a) we are in the late-cycle phase of the short-term debt cycle when profit and earnings growth are still strong and the tightening of credit is causing asset prices to decline, and b) we are in the late-cycle phase of the long-term debt cycle when asset prices and economies are sensitive to tightenings and when central banks don’t have much power to ease credit.
A very happy and healthy 2019 to all.