Technology is omnipresent. The impacts of technology on markets and market structures are a topic of much debate recently. Some point to its influence to explain the lack of volatility in equity markets (ignoring this week’s wobble). Marko Kolanovic, a JPMorgan analyst, has been reported to have estimated that a mere 10% US equity market trading is now conducted by discretionary human traders.
The first wave of high frequency trading (HFT) brought about distortive practises by certain players such as front running and spoofing, as detailed in Michael Lewis’s bestselling exposé Flash Boys. Now HFT firms are struggling to wring profits from the incremental millisecond, as reported in this FT article, with 2017 revenues for HFT firms trading US stocks falling below $1 billion in 2017 from over $7 billion in 2009, according to the consultancy Tabb Group. According to Doug Duquette of Vertex Analytics “it has got to the point where the speed is so ubiquitous that there really isn’t much left to get”.
The focus now is on the impact of various rules-based automatic investment systems, ranging from exchange traded funds (ETFs) to computerised high-speed trading programs to new machine learning and artificial intelligence (AI) innovations. As Tom Watson said about HFT in 2011, these new technologies have the potential to give “Adam Smith’s invisible hand a bionic upgrade by making it better, stronger and faster like Steve Austin in the Six Million Dollar Man”.
As reported in another FT article, some experts estimate that computers are now generating around 50% to 70% of trading in equity markets, 60% of futures and more than 50% of treasuries. According to Morningstar, by year-end 2017 the total assets of actively managed funds stood at $11.4 trillion compared with $6.7 trillion for passive funds in the US.
Although the term “quant fund” covers a multitude of mutual and hedge fund strategies, assuming certain classifications are estimated to manage around $1 trillion in assets out of total assets under management (AUM) invested in mutual funds globally of over $40 trillion. It is believed that machine learning or AI only drives a small subset of quant funds’ trades although such systems are thought to be used as investment tools for developing strategies by an increasing number of investment professionals.
Before I delve into these issues further, I want to take a brief detour into the wonderful world of quantitative finance expert Paul Wilmott and his recent book, with David Orrell, called “The Money Formula: Dodgy Finance, Pseudo Science, and How Mathematicians Took Over the Markets”. I am going to try to summarize the pertinent issues highlighted by the authors in the following sequence of my favourite quotes from the book:
“If anybody can flog an already sick horse to death, it is an economist.”
“Whenever a model becomes too popular, it influences the market and therefore tends to undermine the assumptions on which it was built.”
“Real price data tend to follow something closer to a power-law distribution and are characterized by extreme events and bursts of intense volatility…which are typical of complex systems that are operating at a state known as self-organized criticality…sometimes called the edge of chaos.”
“In quantitative finance, the weakest links are the models.”
“The only half decent, yet still toy, models in finance are the lognormal random walk models for those instruments whose level we don’t care about.”
“The more apparently realistic you make a model, the less useful it often becomes, and the complexity of the equations turns the model into a black box. The key then is to keep with simple models, but make sure that the model is capturing the key dynamics of the system, and only use it within its zone of validity.”
“The economy is not a machine, it is a living, organic system, and the numbers it produces have a complicated relationship with the underlying reality.”
“Calibration is a simple way of hiding model risk, you choose the parameters so that your model superficially appears to value everything correctly when really, it’s doing no such thing.”
“When their [quants] schemes, their quantitative seizing – cratered, the central banks stepped in to fill the hole with quantitative easing.”
“Bandwagons beget bubbles, and bubbles beget crashes.”
“Today, it is the risk that has been created by high speed algorithms, all based on similar models, all racing to be the first to do the same thing.”
“We have outsourced ethical judgments to the invisible hand, or increasingly to algorithms, with the result that our own ability to make ethical decisions in economic matters has atrophied.”
According to Morningstar’s annual fund flow report, flows into US mutual funds and ETFs reached a record $684.6 billion in 2017 due to massive inflows into passive funds. Among fund categories, the biggest winners were passive U.S. equity, international equity and taxable bond funds with each having inflows of more than $200 billion. “Indexing is no longer limited to U.S. equity and expanding into other asset classes” according to the Morningstar report.
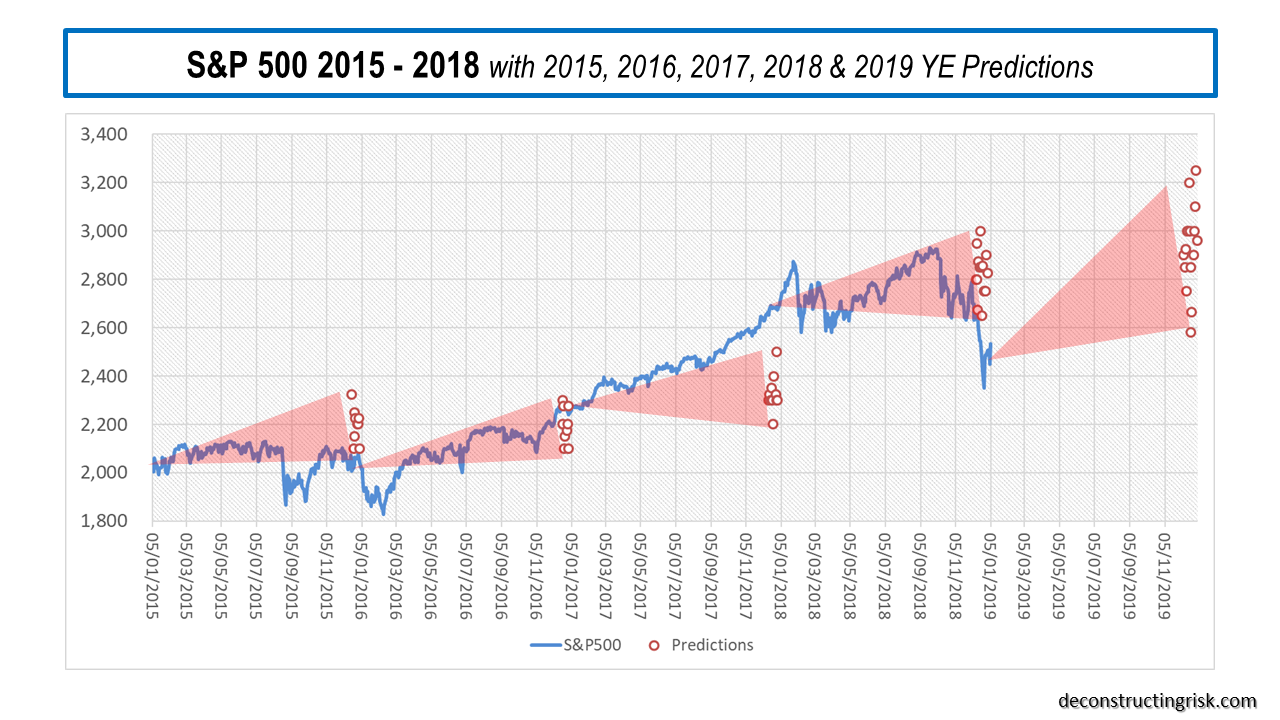
click to enlarge
Paul Singer of Elliott hedge fund, known for its aggressive activism and distressed debt focus (famous for its Argentine debt battles), dramatically said “passive investing is in danger of devouring capitalism” and called it “a blob which is destructive to the growth-creating and consensus-building prospects of free market capitalism”.
In 2016, JP Morgan’s Nikolaos Panagirtzoglou stated that “the shift towards passive funds has the potential to concentrate investments to a few large products” and “this concentration potentially increases systemic risk making markets more susceptible to the flows of a few large passive products”. He further stated that “this shift exacerbates the market uptrend creating more protracted periods of low volatility and momentum” and that “when markets eventually reverse, the correction becomes deeper and volatility rises as money flows away from passive funds back towards active managers who tend to outperform in periods of weak market performance”.
The International Organization of Securities Commissions (IOSCO), proving that regulators are always late to the party (hopefully not too late), is to broaden its analysis on the ETF sector in 2018, beyond a previous review on liquidity management, to consider whether serious market distortions might occur due to the growth of ETFs, as per this FT article. Paul Andrews, a veteran US regulator and secretary general of IOSCO, called ETFs “financial engineering at its finest”, stated that “ETFs are [now] a critical piece of market infrastructure” and that “we are on autopilot in many respects with market capitalisation-weighted ETFs”.
Artemis Capital Management, in this report highlighted in my previous post, believe that “passive investing is now just a momentum play on liquidity” and that “large capital flows into stocks occur for no reason other than the fact that they are highly liquid members of an index”. Artemis believes that “active managers serve as a volatility buffer” and that if such a buffer is withdrawn then “there is no incremental seller to control overvaluation on the way up and no incremental buyer to stop a crash on the way down”.
Algorithmic trading (automated trading, black-box trading, or simply algo-trading) is the process of using computers programmed to follow a defined set of instructions for placing a trade in order to generate profits at a speed and frequency that is impossible for a human trader.
Machine learning uses statistical techniques to infer relationships between data. The artificial intelligence “agent” does not have an algorithm to tell it which relationships it should find but infers, or learns if you like, from the data using statistical analysis to revise its hypotheses. In supervised learning, the machine is presented with examples of input data together with the desired output. The AI agent works out a relationship between the two and uses this relationship to make predictions given further input data. Supervised learning techniques, such as Bayesian regression, are useful where firms have a flow of input data and would like to make predictions.
Unsupervised learning, in contrast, does without learning examples. The AI agent instead tries to find relationships between input data by itself. Unsupervised learning can be used for classification problems determining which data points are similar to each other. As an example of unsupervised learning, cluster analysis is a statistical technique whereby data or objects are classified into groups (clusters) that are similar to one another but different from data or objects in other clusters.
Firms like Bloomberg use cluster analysis in their liquidity assessment tool which aims to cluster bonds with sufficiently similar behaviour so their historical data can be shared and used to make general predictions for all bonds in that cluster. Naz Quadri of Bloomberg, with the wonderful title of head of quant engineering and research, said that “some applications of clustering were more useful than others” and that their analysis suggests “clustering is most useful, and results are more stable, when it is used with a structural market impact model”. Market impact models are widely used to minimise the effect of a firm’s own trading on market prices and are an example of machine learning in practise.
In November 2017, the Financial Stability Board (FSB) released a report called “Artificial Intelligence and Machine Learning in Financial Services”. In the report the FSB highlighted some of the current and potential use cases of AI and machine learning, as follows:
- Financial institutions and vendors are using AI and machine learning methods to assess credit quality, to price and market insurance contracts, and to automate client interaction.
- Institutions are optimising scarce capital with AI and machine learning techniques, as well as back-testing models and analysing the market impact of trading large positions.
- Hedge funds, broker-dealers, and other firms are using AI and machine learning to find signals for higher (and uncorrelated) returns and optimise trading execution.
- Both public and private sector institutions may use these technologies for regulatory compliance, surveillance, data quality assessment, and fraud detection.
The FSB report states that “applications of AI and machine learning could result in new and unexpected forms of interconnectedness” and that “the lack of interpretability or ‘auditability’ of AI and machine learning methods has the potential to contribute to macro-level risk”. Worryingly they say that “many of the models that result from the use of AI or machine learning techniques are difficult or impossible to interpret” and that “many AI and machine learning developed models are being ‘trained’ in a period of low volatility”. As such “the models may not suggest optimal actions in a significant economic downturn or in a financial crisis, or the models may not suggest appropriate management of long-term risks” and “should there be widespread use of opaque models, it would likely result in unintended consequences”.
With increased use of machine learning and AI, we are seeing the potential rise of self-driving investment vehicles. Using self-driving cars as a metaphor, Artemis Capital highlights that “the fatal flaw is that your driving algorithm has never seen a mountain road” and that “as machines trade with against each other, self-reflexivity is amplified”. Others point out that machine learning in trading may involve machine learning algorithms learning the behaviour of other machine learning algorithms, in a regressive loop, all drawing on the same data and the same methodology. 13D Research opined that “when algorithms coexist in complex systems with subjectivity and unpredictability of human behaviour, unforeseen and destabilising downsides result”.
It is said that there is nothing magical about quant strategies. Quantitative investing is an approach for implementing investment strategies in an automated (or semi-automated) way. The key seems to be data, its quality and its uniqueness. A hypothesis is developed and tested and tested again against various themes to identify anomalies or inefficiencies. Jim Simons of Renaissance Technologies (called RenTec), one of the oldest and most successful quant funds, said that the “efficient market theory is correct in that there are no gross inefficiencies” but “we look at anomalies that may be small in size and brief in time. We make our forecast. Then, shortly thereafter, we re-evaluate the situation and revise our forecast and our portfolio. We do this all-day long. We’re always in and out and out and in. So we’re dependent on activity to make money“. Simons emphasised that RenTec “don’t start with models” but “we start with data” and “we don’t have any preconceived notions”. They “look for things that can be replicated thousands of times”.
The recently departed co-CEO Robert Mercer of RenTec [yes the Mercer who backs Breitbart which adds a scary political Big Brother surveillance angle to this story] has said “RenTec gets a trillion bytes of data a day, from newspapers, AP wire, all the trades, quotes, weather reports, energy reports, government reports, all with the goal of trying to figure out what’s going to be the price of something or other at every point in the future… The information we have today is a garbled version of what the price is going to be next week. People don’t really grasp how noisy the market is. It’s very hard to find information, but it is there, and in some cases it’s been there for a long long time. It’s very close to science’s needle in a haystack problem”
Kumesh Aroomoogan of Accern recently said that “quant hedge funds are buying as much data as they can”. The so-called “alternative data” market was worth about $200 million in the US in 2017 and is expected to double in four years, according to research and consulting firm Tabb Group. The explosion of data that has and is becoming available in this technological revolution should keep the quants busy, for a while.
However, what’s scaring me is that these incredibly clever people will inevitably end up farming through the same data sets, coming to broadly similar conclusions, and the machines who have learned each other’s secrets will all start heading for the exits at the same time, in real time, in a mother of all quant flash crashes. That sounds too much like science fiction to ever happen though, right?