Tag Archives: McKinsey

Heterogeneous Future

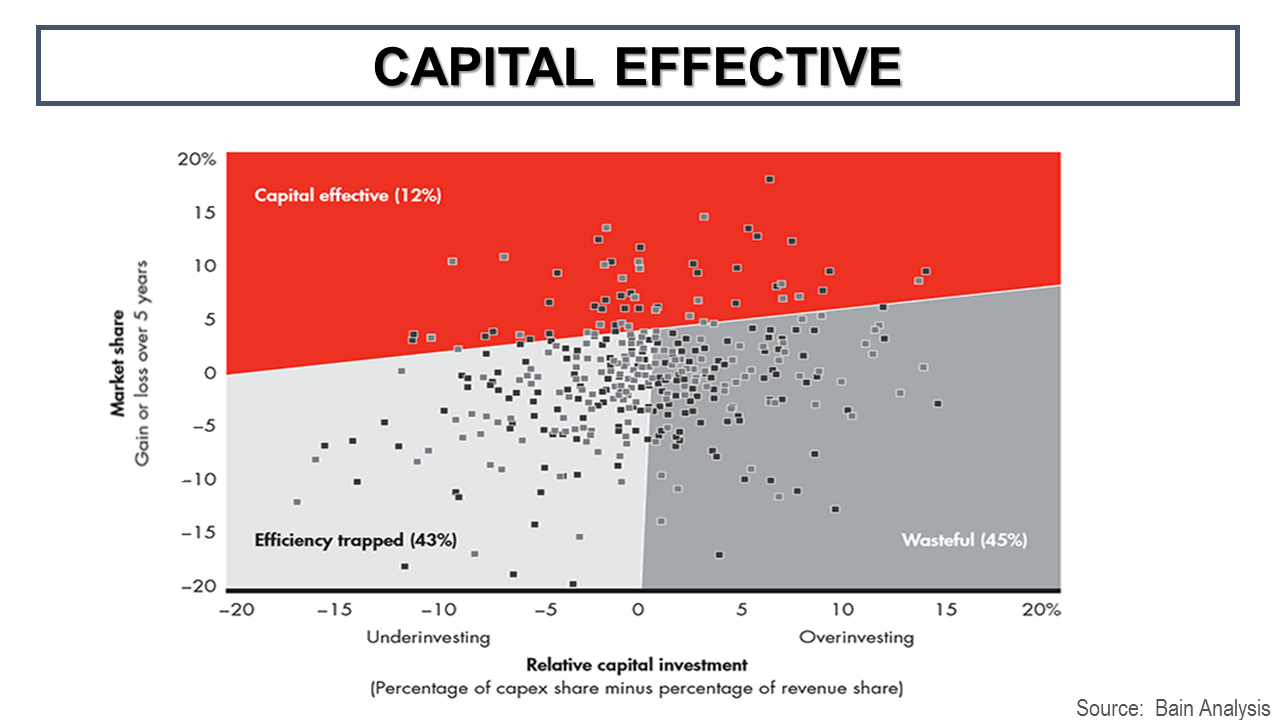
It seems like wherever you look these days there is references to the transformational power of artificial intelligence (AI), including cognitive or machine learning (ML), on businesses and our future. A previous post on AI and insurance referred to some of the changes ongoing in financial services in relation to core business processes and costs. This industry article highlights how machine learning (specifically multi-objective genetic algorithms) can be used in portfolio optimization by (re)insurers. To further my understanding on the topic, I recently bought a copy of a new book called “Advances in Financial Machine Learning” by Marcos Lopez de Prado, although I suspect I will be out of my depth on the technical elements of the book. Other posts on this blog (such as this one) on the telecom sector refer to the impact intelligent networks are having on telecom business models. One example is the efficiencies Centurylink (CTL) have shown in their capital expenditure allocation processes from using AI and this got me thinking about the competitive impact such technology will have on costs across numerous traditional industries.

AI is a complex topic and in its broadest context it covers computer systems that can sense their environment, think, and in some cases learn, and take applicable actions according to their objectives. To illustrate the complexity of the topic, neural networks are a subset of machine learning techniques. Essentially, they are AI systems based on simulating connected “neural units” loosely modelling the way that neurons interact in the brain. Neural networks need large data sets to be “trained” and the number of layers of simulated interconnected neurons, often numbering in their millions, determine how “deep” the learning can be. Before I embarrass myself in demonstrating how little I know about the technicalities of this topic, it’s safe to say AI as referred to in this post encompasses the broadest definition, unless a referenced report or article specifically narrows the definition to a subset of the broader definition and is highlighted as such.

According to IDC (here), “interest and awareness of AI is at a fever pitch” and global spending on AI systems is projected to grow from approximately $20 billion this year to $50 billion in 2021. David Schubmehl of IDC stated that “by 2019, 40% of digital transformation initiatives will use AI services and by 2021, 75% of enterprise applications will use AI”. By the end of this year, retail will be the largest spender on AI, followed by banking, discrete manufacturing, and healthcare. Retail AI use cases include automated customer service agents, expert shopping advisors and product recommendations, and merchandising for omni channel operations. Banking AI use cases include automated threat intelligence and prevention systems, fraud analysis and investigation, and program advisors and recommendation systems. Discrete manufacturing AI use cases including automated preventative maintenance, quality management investigation and recommendation systems. Improved diagnosis and treatment systems are a key focus in healthcare.

In this April 2018 report, McKinsey highlights numerous use cases concluding that ”AI can most often be adopted and create value where other analytics methods and techniques are also creating value”. McKinsey emphasis that “abundant volumes of rich data from images, audio, and video, and large-scale text are the essential starting point and lifeblood of creating value with AI”. McKinsey’s AI focus in the report is particularly in relation to deep learning techniques such as feed forward neural networks, recurrent neural networks, and convolutional neural networks.

Examples highlighted by McKinsey include a European trucking company who reduced fuel costs by 15 percent by using AI to optimize routing of delivery traffic, an airline who uses AI to predict congestion and weather-related problems to avoid costly cancellations, and a travel company who increase ancillary revenue by 10-15% using a recommender system algorithm trained on product and customer data to offer additional services. Other specific areas highlighted by McKinsey are captured in the following paragraph:

“AI’s ability to conduct preventive maintenance and field force scheduling, as well as optimizing production and assembly processes, means that it also has considerable application possibilities and value potential across sectors including advanced electronics and semiconductors, automotive and assembly, chemicals, basic materials, transportation and logistics, oil and gas, pharmaceuticals and medical products, aerospace and defense, agriculture, and consumer packaged goods. In advanced electronics and semiconductors, for example, harnessing data to adjust production and supply-chain operations can minimize spending on utilities and raw materials, cutting overall production costs by 5 to 10 percent in our use cases.”

McKinsey calculated the value potential of AI from neural networks across numerous sectors, as per the graph below, amounting to $3.5 to $5.8 trillion. Value potential is defined as both in the form of increased profits for companies and lower prices or higher quality products and services captured by customers, based off the 2016 global economy. They did not estimate the value potential of creating entirely new product or service categories, such as autonomous driving.

click to enlarge

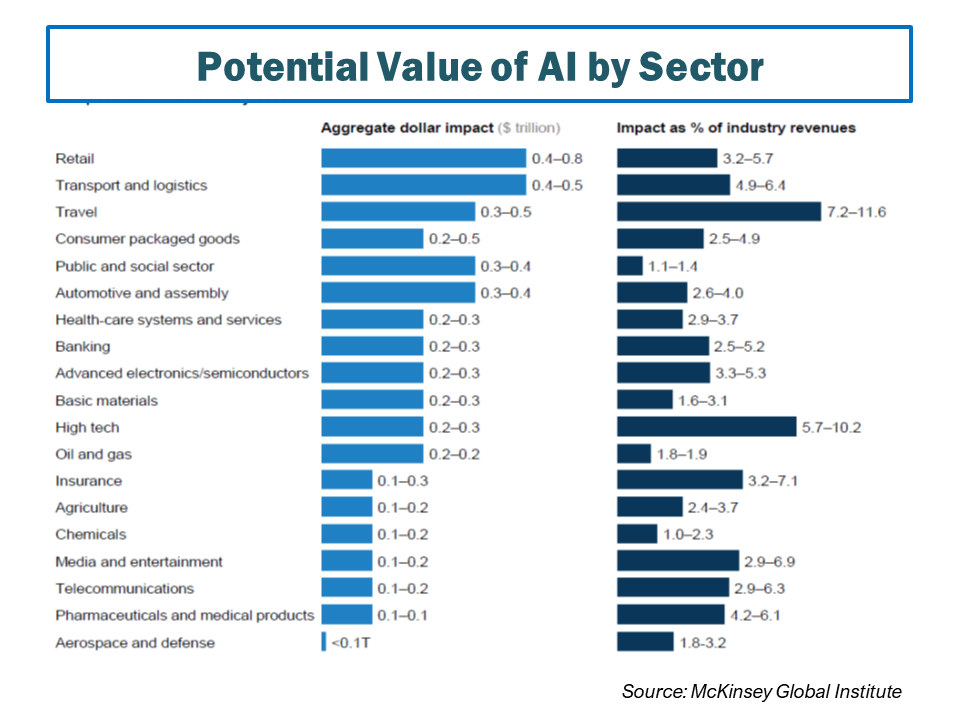
McKinsey identified several challenges and limitations with applying AI techniques, as follows:

  • Making an effective use of neural networks requires labelled training data sets and therefore data quality is a key issue. Ironically, machine learning often requires large amounts of manual effort in “teaching” machines to learn. The experience of Microsoft with their chatter bot Tay in 2016 illustrates the shortcoming of learning from bad data!
  • Obtaining data sets that are sufficiently large and comprehensive to be used for comprehensive training is also an issue. According to the authors of the book “Deep Learning”, a supervised deep-learning algorithm will generally achieve acceptable performance with around 5,000 labelled examples per category and will match or exceed human level performance when trained with a data set containing at least 10 million labelled examples.
  • Explaining the results from large and complex models in terms of existing practices and regulatory frameworks is another issue. Product certifications in health care, automotive, chemicals, aerospace industries and regulations in the financial services sector can be an obstacle if processes and outcomes are not clearly explainable and auditable. Some nascent approaches to increasing model transparency, including local-interpretable-model-agnostic explanations (LIME), may help resolve this explanation challenge.
  • AI models continue to have difficulties in carrying their experiences from one set of circumstances to another, applying a generalisation to learning. That means companies must commit resources to train new models for similar use cases. Transfer learning, in which an AI model is trained to accomplish a certain task and then quickly applies that learning to a similar but distinct activity, is one area of focus in response to this issue.
  • Finally, one area that has been the subject of focus is the risk of bias in data and algorithms. As bias is part of the human condition, it is engrained in our behaviour and historical data. This article in the New Scientist highlights five examples.

In 2016, Accenture estimated that US GDP could be $8.3 trillion higher in 2035 because of AI, doubling growth rates largely due to AI induced productivity gains. More recently in February this year, PwC published a report on an extensive macro-economic impact of AI and projected a baseline scenario that global GDP will be 14% higher due to AI, with the US and China benefiting the most. Using a Spatial Computable General Equilibrium Model (SCGE) of the global economy, PwC quantifies the total economic impact (as measured by GDP) of AI on the global economy via both productivity gains and consumption-side product enhancements over the period 2017-2030. The impact on the seven regions modelled by 2030 can be seen below.

click to enlarge

PwC estimates that the economic impact of AI will be driven by productivity gains from businesses automating processes as well as augmenting their existing labour force with AI technologies (assisted, autonomous and augmented intelligence) and by increased consumer demand resulting from the availability of personalised and/or higher-quality AI-enhanced products and services.

In terms of sectors, PwC estimate the services industry that encompasses health, education, public services and recreation stands to gain the most, with retail and wholesale trade as well as accommodation and food services also expected to see a large boost. Transport and logistics as well as financial and professional services will also see significant but smaller GDP gains by 2030 because of AI although they estimate that the financial service sector gains relatively quickly in the short term. Unsurprisingly, PwC finds that capital intensive industries have the greatest productivity gains from AI uptake and specifically highlight the Technology, Media and Telecommunications (TMT) sector as having substantial marginal productivity gains from uptaking replacement and augmenting AI. The sectoral gains estimated by PwC by 2030 are shown below.

click to enlarge

A key element of these new processes is the computing capabilities needed to process so much data that underlies AI. This recent article in the FT highlighted how the postulated demise of Moore’s law after its 50-year run is impacting the micro-chip sector. Mike Mayberry of Intel commented that “the future is more heterogeneous” when referring to the need for the chip industry to optimise chip design for specific tasks. DARPA, the US defence department’s research arm, has allocated $1.5 billion in research grants on the chips of the future, such as chip architectures that combine both power and flexibility using reprogrammable “software-defined hardware”. This increase in focus from the US is a direct counter against China’s plans to develop its intellectual and technical abilities in semiconductors over the coming years beyond simple manufacturing.

One of the current leaders in specialised chip design is Nvidia (NVDA) who developed software lead chips for video cards in the gaming sector through their graphics processing unit (GPU). The GPU accelerates applications running on standard central processing units (CPU) by offloading some of the compute-intensive and time-consuming portions of the code whilst the rest of the application still runs on the CPU. The chips developed by NVDA for gamers have proven ideal in handling the huge volumes of data needed to train deep learning systems that are used in AI. The exhibit below from NVDA illustrates how they assert that new processes such as GPU can overcome the slowdown in capability from the density limitation of Moore’s Law.

click to enlarge

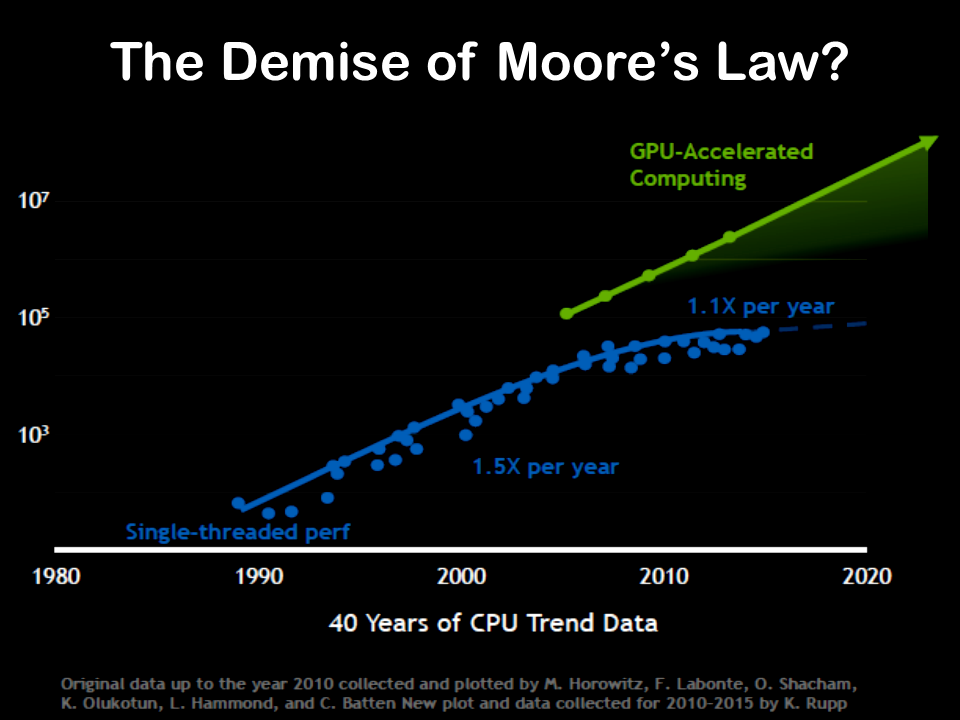
NVDA, whose stock is up over 400% in the past 24 months, has been a darling of the stock market in recent years and reported strong financial figures for their quarter to end April, as shown below. Their quarterly figures to the end of July are eagerly expected next month. NVDA has been range bound in recent months, with the trade war often cited as a concern with their products sold approximately 20%, 20%, and 30% into supply chains in China, other Asia Pacific countries, and Taiwan respectively

click to enlarge

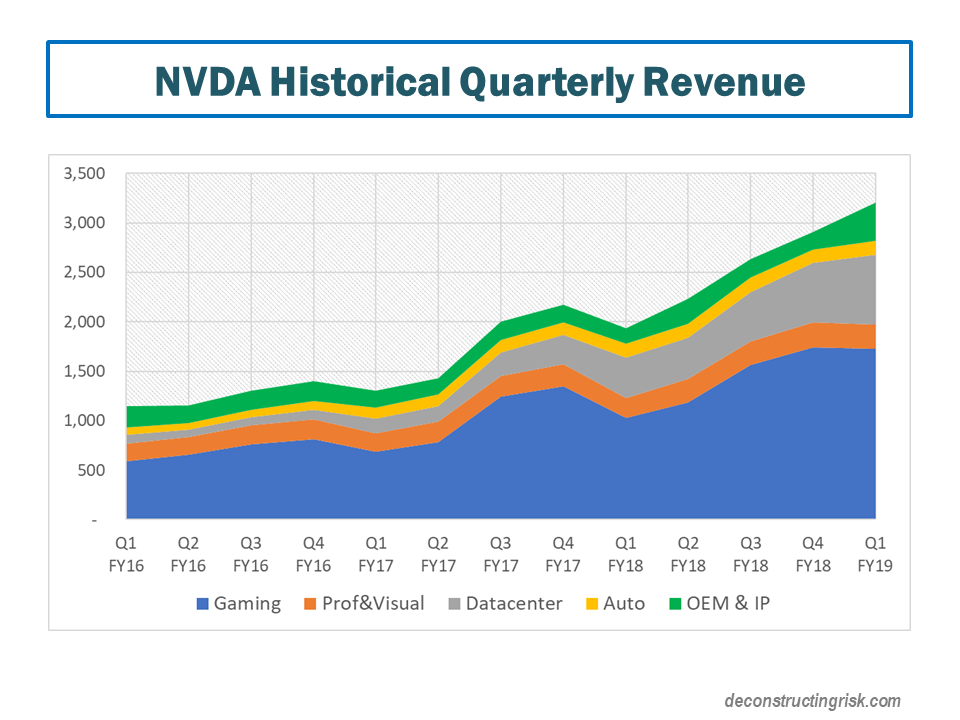
Although seen as the current leader, NVDA is not alone in this space. AMD recently reported strong Q1 2018 results, with revenues up 40%, and has a range of specialised chip designs to compete in the datacentre, auto, and machine learning sectors. AMD’s improved results also reduce risk on their balance sheet with leverage decreasing from 4.6X to 3.4X and projected to decline further. AMD’s stock is up approximately 70% year to date. AMD’s 7-nanonmeter product launch planned for later this year also compares favourably against Intel’s delayed release date to 2019 for its 10-nanometer chips.

Intel has historically rolled out a new generation of computer chips every two years, enabling chips that were consistently more powerful than their predecessors even as the cost of that computing power fell. But as Intel has run up against the limits of physics, they have reverted to making upgrades to its aging 14nm processor node, which they say performs 70% better than when initially released four years ago. Despite advances by NVDA and AMD in data centres, Intel chips still dominate. In relation to the AI market, Intel is focused on an approach called field-programmable gate array (FPGA) which is an integrated circuit designed to be configured by a customer or a designer after manufacturing. This approach of domain-specific architectures is seen as an important trend in the sector for the future.

Another interesting development is Google (GOOG) recently reported move to commercially sell, through its cloud-computing service, its own big-data chip design that it has been using internally for some time. Known as a tensor processing unit (TPU), the chip was specifically developed by GOOG for neural network machine learning and is an AI accelerator application-specific integrated circuit (ASIC). For example, in Google photos an individual TPU can process over 100 million photos a day. What GOOG will do with this technology will be an interesting development to watch.

Given the need for access to large labelled data sets and significant computing infrastructure, the large internet firms like Google, Facebook (FB), Microsoft (MSFT), Amazon (AMZN) and Chinese firms like Baidu (BIDU) and Tencent (TCEHY) are natural leaders in using and commercialising AI. Other firms highlighted by analysts as riding the AI wave include Xilinx (XLNX), a developer of high-performance FPGAs, and Yext (YEXT), who specialise in managing digital information relevant to specific brands, and Twilio (TWLO), a specialist invoice and text communication analysis. YEXT and TWLO are loss making. All of these stocks, possibly excluding the Chinese ones, are trading at lofty valuations. If the current wobbles on the stock market do lead to a significant fall in technology valuations, the stocks on my watchlist will be NVDA, BIDU and GOOG. I’d ignore the one trick ponys, particularly the loss making ones! Specifically, Google is one I have been trying to get in for years at a sensible value and I will watch NVDA’s results next month with keen interest as they have consistently broken estimates in recent quarters. Now, if only the market would fall from its current heights to allow for a sensible entry point…….maybe enabled by algorithmic trading or a massive trend move by the passives!

Remember deleveraging?

There is a lot of interesting stuff in the latest IMF Financial Stability Report. After much research on global debts levels (as per this post in 2014 and this one in 2015) over the past few years, the graph below on G20 gross debt levels from the IMF shows how little progress has been made.

click to enlarge

When looked at by advanced economy, the trend in gross debt from 2006 to 2016 looks startling, particularly for government debt.

click to enlarge

As the IMF state, “one lesson from the global financial crisis is that excessive debt that creates debt servicing problems can lead to financial strains” and “another lesson is that gross liabilities matter”.

The question does arise as to the economic impact of these debt levels if interest rates start to rise across advanced economies?

Telecoms’ troubles

The telecom industry is in a funk. S&P recently said that their “global 2017 base-case forecast is for flat revenues” and other analysts are predicting little growth in traditional telecom’s top line over the coming years across most developed markets. This recent post shows that wireless revenue by the largest US firms has basically flatlined with growth of only 1% from 2015 to 2016. Cord cutting in favour of wireless has long been a feature of incumbent wireline firms but now wireless carrier’s lunch is increasingly being eaten by disruptive new players such as Facebook’s messenger, Apple’s FaceTime, Googles’ Hangouts, Skype, Tencent’s QQ or WeChat, and WhatsApp. These competitors are called over the top (OTT) providers and they use IP networks to provide communications (e.g. voice & SMS), content (e.g. video) and cloud-based (e.g. compute and storage) offerings. The telecom industry is walking a fine line between enabling these competitors whilst protecting their traditional businesses.

The graph below from a recent TeleGeography report provides an illustration of what has happened in the international long-distance business.

click to enlarge

A recent McKinsey article predicts that in an aggressive scenario the share of messaging, fixed voice, and mobile voice revenue provided by OTT players could be within the ranges as per the graph below by 2018.

click to enlarge

Before the rapid rise of the OTT player, it was expected that telecoms could recover the loss of revenue from traditional services through increased data traffic over IP networks. Global IP traffic has exploded from 26 exabytes per annum in 2005 to 1.2 zettabytes in 2016 and is projected to grow, by the latest Cisco estimates here, at a CAGR of 24% to 2012. See this previous post on the ever-expanding metrics used for IP traffic (for reference, gigabyte/terabyte/petabyte/exabyte/zettabyte/yottabyte is a kilobyte to the power of 3, 4, 5, 6, 7 and 8 respectively).

According to the 2017 OTT Video Services Study conducted by Level 3 Communications, viewership of OTT video services, including Netflix, Hulu and Amazon Prime, will overtake traditional broadcast TV within the next five years, impacting cable firms and traditional telecom’s TV services alike. With OTT players eating telecom’s lunch, Ovum estimate a drop in spending on traditional communication services by a third over the next ten years.

Telecom and cable operators have long complained of unfair treatment given their investments in upgrading networks to handle the vast increase in data created by the very OTT players that are cannibalizing their revenue. For example, Netflix is estimated to consume as much as a third of total network bandwidth in the U.S. during peak times. Notwithstanding their growth, it’s important to see these OTT players as customers of the traditional telecoms as well as competitors and increasingly telecoms are coming to understand that they need to change and digitalise their business models to embrace new opportunities. The graphic below, not to scale, on changing usage trends illustrates the changing demands for telecoms as we enter the so called “digital lifestyle era”.

click to enlarge

The hype around the internet of things (IoT) is getting deafening. Just last week, IDC predicted that “by 2021, global IoT spending is expected to total nearly $1.4 trillion as organizations continue to invest in the hardware, software, services, and connectivity that enable the IoT”.

Bain & Co argue strongly in this article in February that telecoms, particularly those who have taken digital transformation seriously in their own operating models, are “uniquely qualified to facilitate the delivery of IoT solutions”. The reasons cited include their experience of delivering scale connectivity solutions, of managing extensive directories and the life cycles of millions of devices, and their strong position developing and managing analytics at the edge of the network across a range of industries and uses.

Upgrading network to 5G is seen as being necessary to enable the IoT age and the hype around 5G has increased along with the IoT hype and the growth in the smartphone ecosystem. But 5G is in a development stage and technological standards need to be finalised. S&P commented that “we don’t expect large scale commercial 5G rollout until 2020”.

So what can telecoms do in the interim about declining fundamentals? The answer is for telecoms to rationalise and digitalize their business. A recent McKinsey IT benchmarking study of 80 telecom companies worldwide found that top performers had removed redundant platforms, automated core processes, and consolidated overlapping capabilities. New technologies such as software-defined networks (SDN) and network-function virtualization (NFV) mean telecoms can radically reshape their operating models. Analytics can be used to determine smarter capital spending, machine learning can be used to increase efficiency and avoid overloads, back offices can be automated, and customer support can be digitalized. This McKinsey article claims that mobile operators could double their operating cashflow through digital transformation.

However, not all telecoms are made the same and some do not have a culture that readily embraces transformation. McKinsey say that “experience shows that telcoms have historically only found success in transversal products (for example, security, IoT, and cloud services for regional small and medium-size segments)” and that in other areas, “telcoms have developed great ideas but have failed to successfully execute them”.

Another article from Bain & Co argues that only “one out of eight providers could be considered capital effective, meaning that they have gained at least 1 percentage point of market share each year over the past five years without having spent significantly more than their fair share of capital to do so”. As can be seen below, the rest of the sector is either caught in an efficiency trap (e.g. spent less capital than competitors but not gaining market share) or are just wasteful wit their capex spend.

click to enlarge

So, although there are many challenges for this sector, there is also many opportunities. As with every enterprise in this digital age, it will be those firms who can execute at scale that will likely to be the big winners. Pure telecommunications companies could become extinct or so radically altered in focus and diversity of operations that telecoms as a term may be redundant. Content production could be mixed with delivery to make joint content communication giants. Or IT services such as security, cloud services, analytics, automation and machine learning could be combined with next generation intelligent networks. Who knows! One thing is for sure though, the successful firms will be the ones with management teams that can execute a clear strategy profitably in a fast changing competitive sector.

Still Dancing

The latest market wobble this week comes under the guise of the endless Trump soap opera and the first widespread use of the impeachment word. I doubt it will be the last time we hear that word! The bookies are now offering even odds of impeachment. My guess is that Trump’s biggest stumble will come over some business conflict of interest and/or a re-emergence of proof of his caveman behaviour towards woman. The prospect of a President Pence is unlikely to deeply upset (the non-crazy) republicans or the market. The issue is likely “when not if” and the impact will depend upon whether the republicans still control Congress.

Despite the week’s wobble, the S&P500 is still up over 6% this year. May is always a good month to assess market valuation and revisit the on-going debate on whether historical metrics or forward looking metrics are valid in this low interest rate/elevated profit margin world. Examples of recent posts on this topic include this post one highlighted McKinsey’s work on the changing nature of earnings and this post looked at the impact of technology on profit profiles.

The hedge fund guru Paul Tudor Jones recently stated that a chart of the market’s value relative to US GDP, sometimes called the Buffet indicator as below, should be “terrifying” to central bankers and an indicator that investors are unrealistically valuing future growth in the economy.

click to enlarge

Other historical indicators such as the S&P500 trailing 12 month PE or the PE10 (aka Shiller CAPE) suggest the market is 60% to 75% overvalued (this old post outlines some of the on-going arguments around CAPE).

click to enlarge

So, it was fascinating to see a value investor as respected as Jeremy Grantham of GMO recently issue a piece called “This time seems very very different” stating that “the single largest input to higher margins, though, is likely to be the existence of much lower real interest rates since 1997 combined with higher leverage” and that “pre-1997 real rates averaged 200 bps higher than now and leverage was 25% lower”. Graham argues that low interest rates, relative to historical levels, are here for some time to come due to structural reasons including income inequality and aging populations resulting in more aged savers and less younger spenders. Increased monopoly, political, and brand power in modern business models have, according to Graham, reduced the normal competitive pressures and created a new stickiness in profits that has sustained higher margins.

The ever-cautious John Hussman is disgusted that such a person as Jeremy Grantham would dare join the “this time it’s different” crowd. In a rebuttal piece, Hussman discounts interest rates as the reason for elevated profits (he points out that debt of U.S. corporations as a ratio to revenues is more than double its historical median) and firmly puts the reason down to declining labour compensation as a share of output prices, as illustrated by the Hussman graph below.

click to enlarge

Hussman argues that labour costs and profit margins are in the process of being normalised as the labour market tightens. Bloomberg had an interesting article recently on wage growth and whether the Phillips Curve is still valid. Hussman states that “valuations are now so obscenely elevated that even an outcome that fluctuates modestly about some new, higher average [profit margin] would easily take the S&P 500 35-40% lower over the completion of the current market cycle”. Hussman favoured valuation metric of the ratio of nonfinancial market capitalization to corporate gross value-added (including estimated foreign revenues), shown below, predicts a rocky road ahead.

click to enlarge

The bulls point to a growing economy and ongoing earnings growth, as illustrated by the S&P figures below on operating EPS projections, particularly in the technology, industrials, energy, healthcare and consumer sectors.

click to enlarge

Taking operating earnings as a valid valuation metric, the S&P figures show that EPS estimates for 2017 and 2018 (with a small haircut increasing in time to discount the consistent over optimism of analyst forward estimates) support the bull argument that current valuations will be justified by earnings growth over the coming quarters, as shown below.

click to enlarge

The IMF Global Financial Stability report from April contains some interesting stuff on risks facing the corporate sector. They highlight that financial risk taking (defined as purchases of financial assets, M&A and shareholder pay-outs) has averaged $940 billion a year over the past three years for S&P 500 firms representing more than half of free corporate cash flow, with the health care and information technology sectors being the biggest culprits. The IMF point to elevated leverage levels, as seen in the graph below, reflective of a mature credit cycle which could end badly if interest rates rise above the historical low levels of recent times.

click to enlarge

The report highlights that debt levels are uneven with particularly exposed sectors being energy, real estate and utilities, as can be seen below.

click to enlarge

The IMF looked beyond the S&P500 to a broader set of nearly 4,000 US firms to show a similar rise in leverage and capability to service debt, as illustrated below.

click to enlarge

Another graph I found interesting from the IMF report was the one below on the level of historical capital expenditure relative to total assets, as below. A possible explanation is the growth in technology driven business models which don’t require large plant & property investments. The IMF report does point out that tax cuts or offshore tax holidays will, based upon past examples, likely result in more financial risk taking actions rather than increased investment.

click to enlarge

I also found a paper referenced in the report on pensions (“Pension Fund Asset Allocation and Liability Discount Rates” by Aleksandar Andonov, Rob Bauer and Martijn Cremers) interesting as I had suspected that low interest rates have encouraged baby boomers to be over-invested in equities relative to historical fixed income allocations. The paper defines risky assets as investments in public equity, alternative assets, and high-yield bonds. The authors state that “a 10% increase in the percentage of retired members of U.S. public pension funds is associated with a 5.93% increase in their allocation to risky assets” and for all other funds “a 10% increase in the percentage of retired members is associated with a 1.67% lower allocation to risky assets”.  The graph below shows public pension higher allocation to risky assets up to 2012. It would be fascinating to see if this trend has continued to today.

click to enlarge

They further conclude that “this increased risk-taking enables more mature U.S. public funds to use higher discount rates, as a 10% increase in their percentage of retired members is associated with a 75 basis point increase in their discount rate” and that “our regulatory incentives hypothesis argues that the GASB guidelines give U.S. public funds an incentive to increase their allocation to risky assets with higher expected returns in order to justify a higher discount rate and report a lower value of liabilities”. The graph below illustrates the stark difference between the US and Europe.

click to enlarge

So, in conclusion, unless Mr Trump does something really stupid (currently around 50:50 in my opinion) like start a war, current valuations can be justified within a +/- 10% range by bulls assuming the possibility of fiscal stimulus and/or tax cuts is still on the table. However, there are cracks in the system and as interest rates start to increase over the medium term, I suspect vulnerabilities will be exposed in the current bull argument. I am happy to take some profits here and have reduced by equity exposure to around 35% of my portfolio to see how things go over the summer (sell in May and go away if you like). The ability of Trump to deliver tax cuts and/or fiscal stimulus has to be question given his erratic behaviour.

Anecdotally my impression is that aging investors are more exposed to equities than historically or than prudent risk management would dictate, even in this interest rate environment, and this is a contributing factor behind current sunny valuations. Any serious or sudden wobble in equity markets may be magnified by a stampede of such investors trying to protect their savings and the mammoth gains of the 8 year old bull market. For the moment through, to misquote Chuck Price, as long as the music is playing investors are still dancing.

Path of profits

The increase in corporate profits has been one of the factors behind the market run-up (as per posts such as here and here from last year). McKinsey have a new report out called “Playing to win: The new global competition for corporate profits” that predicts a decrease of the current rate of 10% of global GDP back to the 1980 level of below 8% by 2025.

Factors that McKinsey cite for the decline are that the impact of global labour arbitrage and falling interest rates have reached their limits. McKinsey also predict that competitive forces from 2 sources will drive down profits, as per the following extract:

“On one side is an enormous wave of companies based in emerging markets. The most prominent have been operating as industrial giants for decades, but over the past ten to 15 years, they have reached massive scale in their home markets. Now they are expanding globally, just as their predecessors from Japan and South Korea did before them. On the other side, high-tech firms are introducing new business models and striking into new sectors. And the tech (and tech-enabled) firms giants themselves are not the only threat. Powerful digital platforms such as Alibaba and Amazon serve as launching pads for thousands of small and medium-sized enterprises, giving them the reach and resources to challenge larger companies.”

Interesting graphs from the report included those below. One shows the factors contributing to the rise in US corporate profits, as below.

click to enlargeMGI Historical US Corporate Profit Components 1980 to 2013

Another graph shows the variability and median return on invested capital (ROIC) from US firms from 1964 to 2013, as below.

click to enlargeMGI Historical ROIC US Corporates 1964 to 2013

Another shows the reduction in labour inputs by country, as below.

click to enlargeMGI Labor Share of Total Income 1980 to 2012

Another shows the growth in corporate sales by region from 1980 to 2013, as below.

click to enlargeMGI Global Corporate Sales By Region

Another shows the ownership and the ROIC profile of the new competitors, as below.

click to enlargeMGI The New Competitors ownership split & ROIC by region

And finally the graph below shows McKinseys’ projections for EBITDA, EBIT, operating profit, and net income to 2025.

click to enlargeMGI Global Corporate Profits 1980 2013 2025