The latest market wobble this week comes under the guise of the endless Trump soap opera and the first widespread use of the impeachment word. I doubt it will be the last time we hear that word! The bookies are now offering even odds of impeachment. My guess is that Trump’s biggest stumble will come over some business conflict of interest and/or a re-emergence of proof of his caveman behaviour towards woman. The prospect of a President Pence is unlikely to deeply upset (the non-crazy) republicans or the market. The issue is likely “when not if” and the impact will depend upon whether the republicans still control Congress.
Despite the week’s wobble, the S&P500 is still up over 6% this year. May is always a good month to assess market valuation and revisit the on-going debate on whether historical metrics or forward looking metrics are valid in this low interest rate/elevated profit margin world. Examples of recent posts on this topic include this post one highlighted McKinsey’s work on the changing nature of earnings and this post looked at the impact of technology on profit profiles.
The hedge fund guru Paul Tudor Jones recently stated that a chart of the market’s value relative to US GDP, sometimes called the Buffet indicator as below, should be “terrifying” to central bankers and an indicator that investors are unrealistically valuing future growth in the economy.
click to enlarge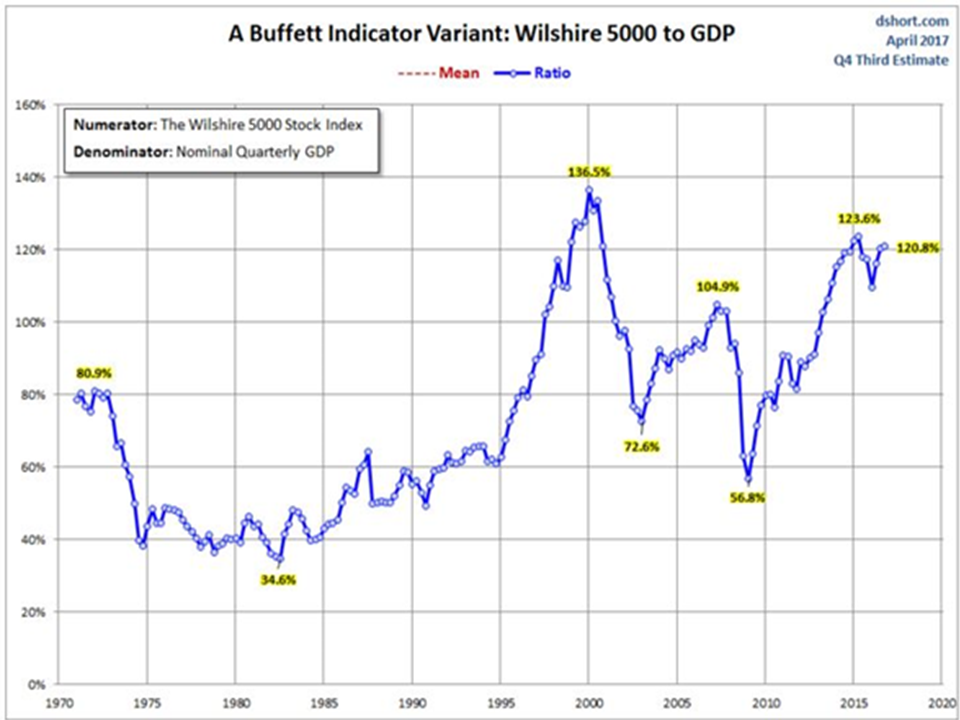
Other historical indicators such as the S&P500 trailing 12 month PE or the PE10 (aka Shiller CAPE) suggest the market is 60% to 75% overvalued (this old post outlines some of the on-going arguments around CAPE).
click to enlarge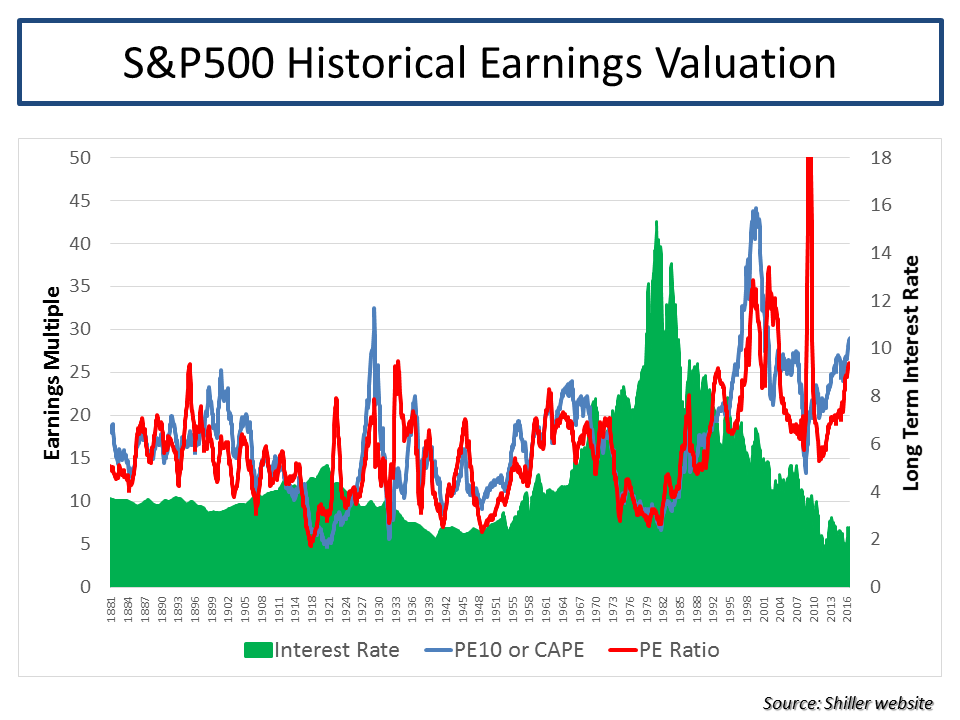
So, it was fascinating to see a value investor as respected as Jeremy Grantham of GMO recently issue a piece called “This time seems very very different” stating that “the single largest input to higher margins, though, is likely to be the existence of much lower real interest rates since 1997 combined with higher leverage” and that “pre-1997 real rates averaged 200 bps higher than now and leverage was 25% lower”. Graham argues that low interest rates, relative to historical levels, are here for some time to come due to structural reasons including income inequality and aging populations resulting in more aged savers and less younger spenders. Increased monopoly, political, and brand power in modern business models have, according to Graham, reduced the normal competitive pressures and created a new stickiness in profits that has sustained higher margins.
The ever-cautious John Hussman is disgusted that such a person as Jeremy Grantham would dare join the “this time it’s different” crowd. In a rebuttal piece, Hussman discounts interest rates as the reason for elevated profits (he points out that debt of U.S. corporations as a ratio to revenues is more than double its historical median) and firmly puts the reason down to declining labour compensation as a share of output prices, as illustrated by the Hussman graph below.
click to enlarge
Hussman argues that labour costs and profit margins are in the process of being normalised as the labour market tightens. Bloomberg had an interesting article recently on wage growth and whether the Phillips Curve is still valid. Hussman states that “valuations are now so obscenely elevated that even an outcome that fluctuates modestly about some new, higher average [profit margin] would easily take the S&P 500 35-40% lower over the completion of the current market cycle”. Hussman favoured valuation metric of the ratio of nonfinancial market capitalization to corporate gross value-added (including estimated foreign revenues), shown below, predicts a rocky road ahead.
click to enlarge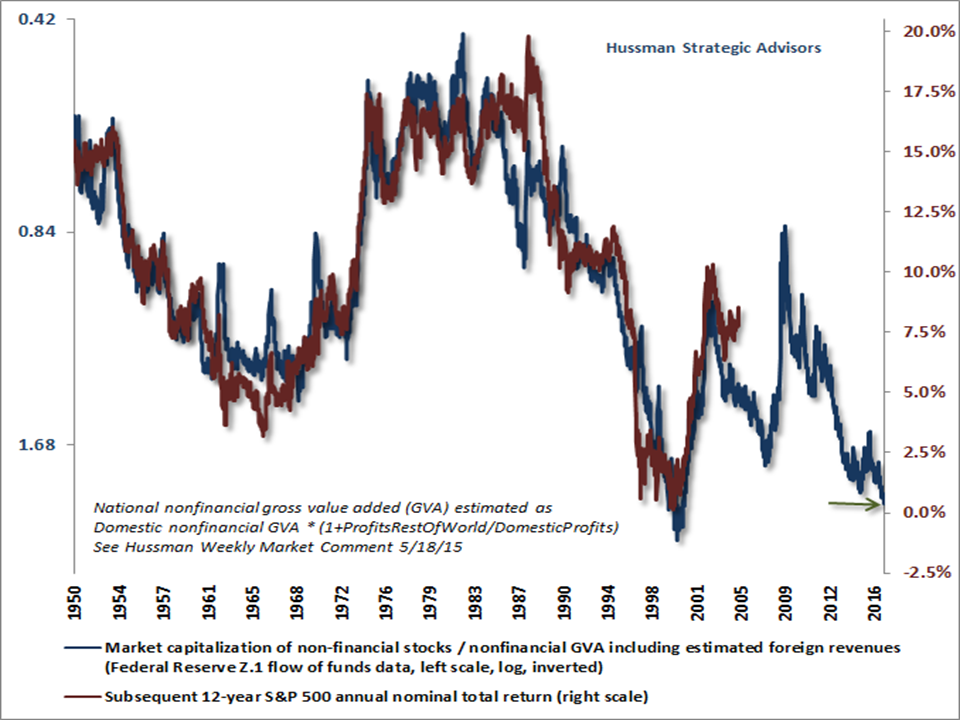
The bulls point to a growing economy and ongoing earnings growth, as illustrated by the S&P figures below on operating EPS projections, particularly in the technology, industrials, energy, healthcare and consumer sectors.
click to enlarge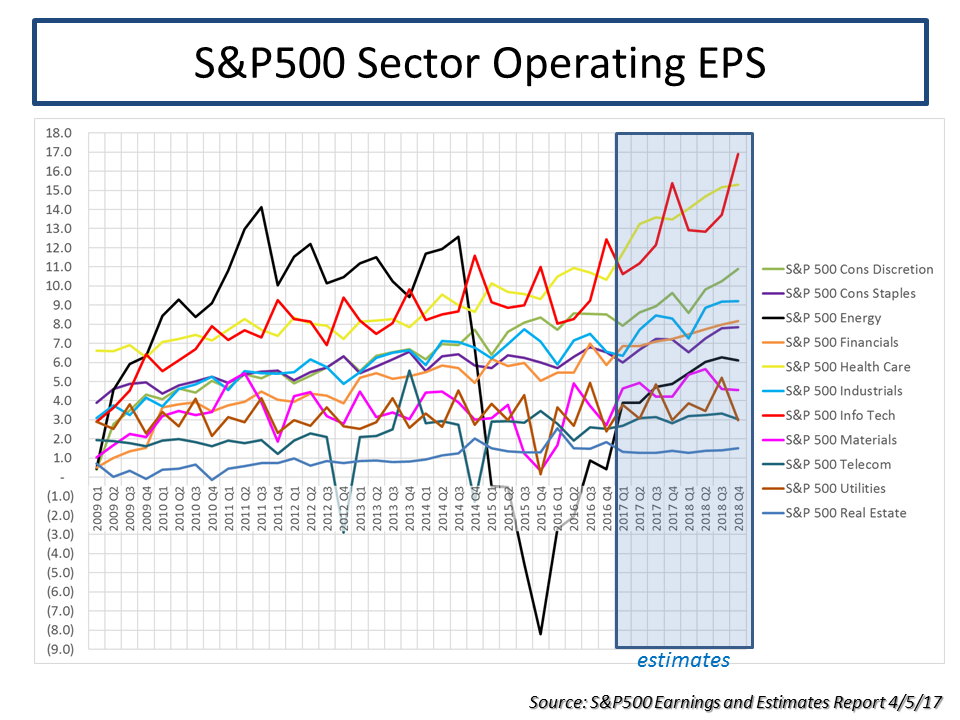
Taking operating earnings as a valid valuation metric, the S&P figures show that EPS estimates for 2017 and 2018 (with a small haircut increasing in time to discount the consistent over optimism of analyst forward estimates) support the bull argument that current valuations will be justified by earnings growth over the coming quarters, as shown below.
click to enlarge
The IMF Global Financial Stability report from April contains some interesting stuff on risks facing the corporate sector. They highlight that financial risk taking (defined as purchases of financial assets, M&A and shareholder pay-outs) has averaged $940 billion a year over the past three years for S&P 500 firms representing more than half of free corporate cash flow, with the health care and information technology sectors being the biggest culprits. The IMF point to elevated leverage levels, as seen in the graph below, reflective of a mature credit cycle which could end badly if interest rates rise above the historical low levels of recent times.
click to enlarge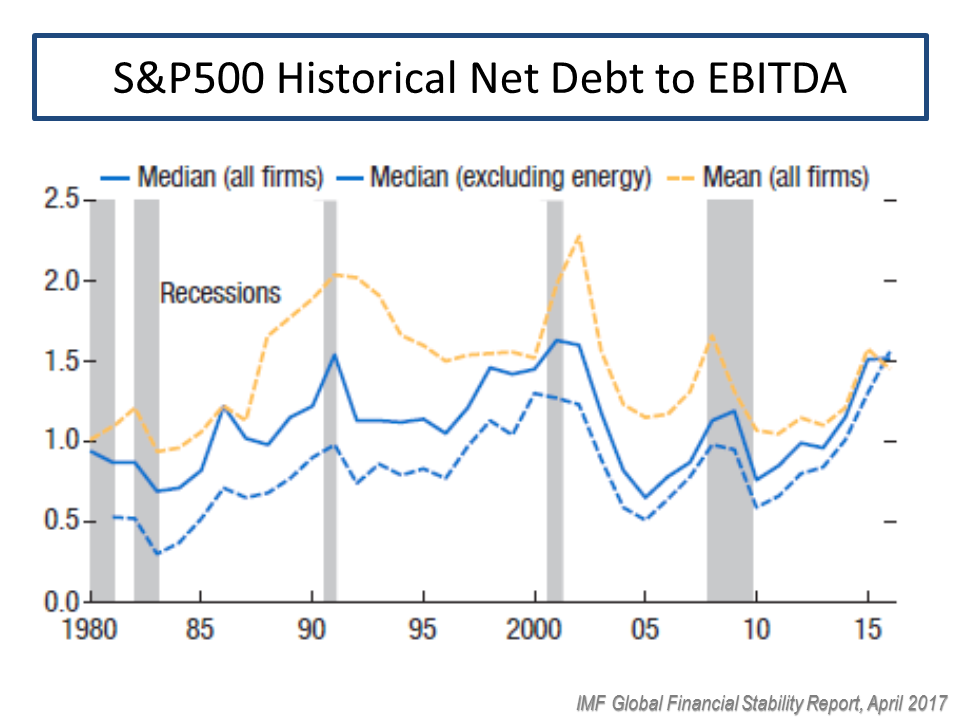
The report highlights that debt levels are uneven with particularly exposed sectors being energy, real estate and utilities, as can be seen below.
click to enlarge
The IMF looked beyond the S&P500 to a broader set of nearly 4,000 US firms to show a similar rise in leverage and capability to service debt, as illustrated below.
click to enlarge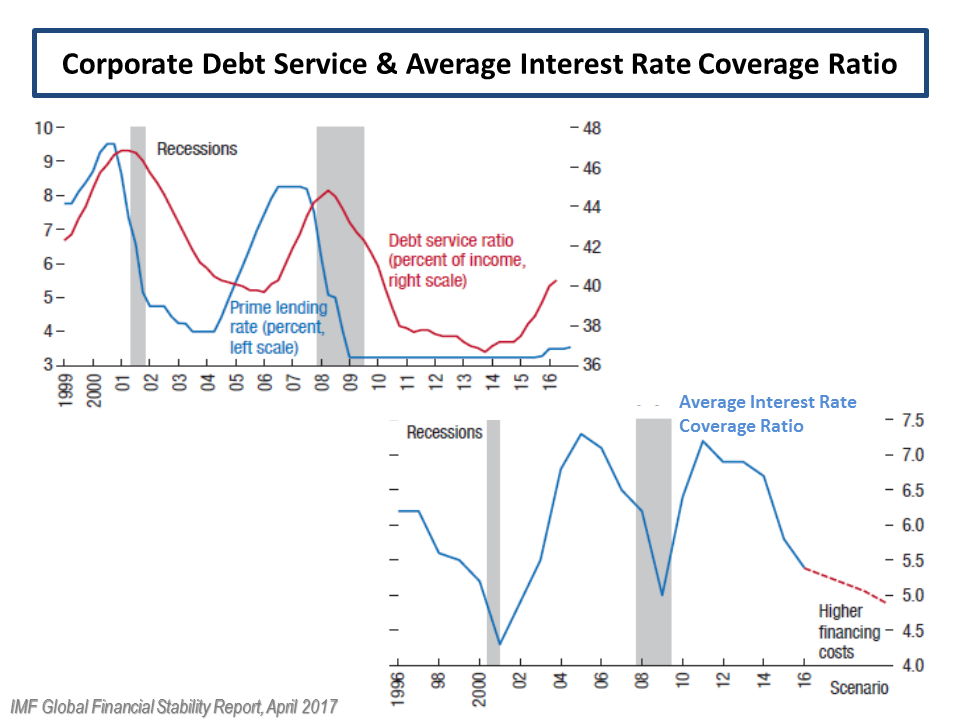
Another graph I found interesting from the IMF report was the one below on the level of historical capital expenditure relative to total assets, as below. A possible explanation is the growth in technology driven business models which don’t require large plant & property investments. The IMF report does point out that tax cuts or offshore tax holidays will, based upon past examples, likely result in more financial risk taking actions rather than increased investment.
click to enlarge
I also found a paper referenced in the report on pensions (“Pension Fund Asset Allocation and Liability Discount Rates” by Aleksandar Andonov, Rob Bauer and Martijn Cremers) interesting as I had suspected that low interest rates have encouraged baby boomers to be over-invested in equities relative to historical fixed income allocations. The paper defines risky assets as investments in public equity, alternative assets, and high-yield bonds. The authors state that “a 10% increase in the percentage of retired members of U.S. public pension funds is associated with a 5.93% increase in their allocation to risky assets” and for all other funds “a 10% increase in the percentage of retired members is associated with a 1.67% lower allocation to risky assets”. The graph below shows public pension higher allocation to risky assets up to 2012. It would be fascinating to see if this trend has continued to today.
click to enlarge
They further conclude that “this increased risk-taking enables more mature U.S. public funds to use higher discount rates, as a 10% increase in their percentage of retired members is associated with a 75 basis point increase in their discount rate” and that “our regulatory incentives hypothesis argues that the GASB guidelines give U.S. public funds an incentive to increase their allocation to risky assets with higher expected returns in order to justify a higher discount rate and report a lower value of liabilities”. The graph below illustrates the stark difference between the US and Europe.
click to enlarge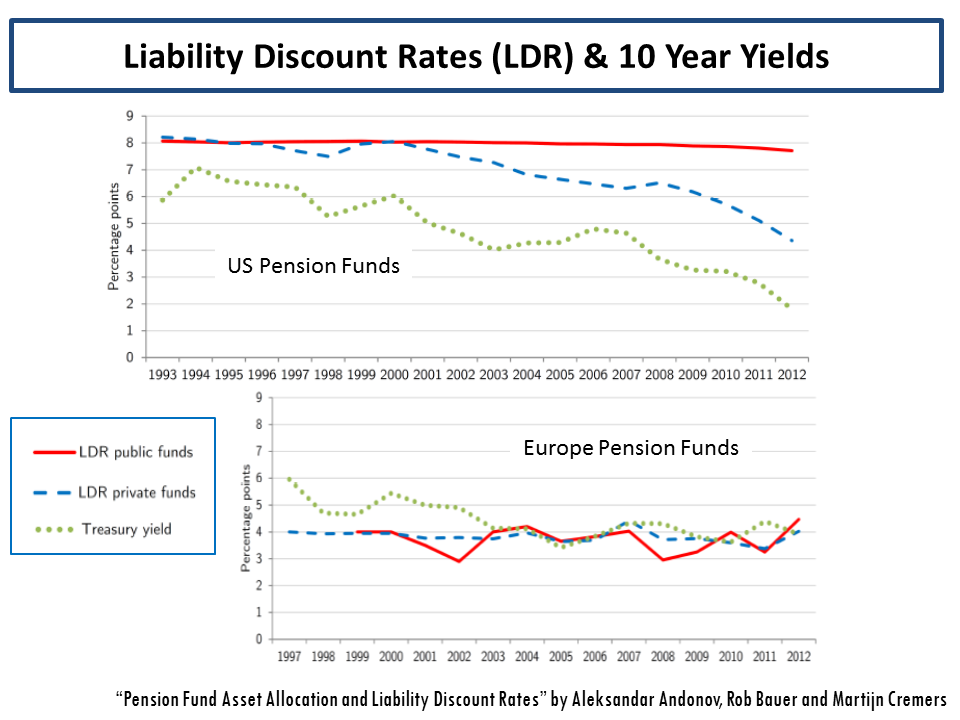
So, in conclusion, unless Mr Trump does something really stupid (currently around 50:50 in my opinion) like start a war, current valuations can be justified within a +/- 10% range by bulls assuming the possibility of fiscal stimulus and/or tax cuts is still on the table. However, there are cracks in the system and as interest rates start to increase over the medium term, I suspect vulnerabilities will be exposed in the current bull argument. I am happy to take some profits here and have reduced by equity exposure to around 35% of my portfolio to see how things go over the summer (sell in May and go away if you like). The ability of Trump to deliver tax cuts and/or fiscal stimulus has to be question given his erratic behaviour.
Anecdotally my impression is that aging investors are more exposed to equities than historically or than prudent risk management would dictate, even in this interest rate environment, and this is a contributing factor behind current sunny valuations. Any serious or sudden wobble in equity markets may be magnified by a stampede of such investors trying to protect their savings and the mammoth gains of the 8 year old bull market. For the moment through, to misquote Chuck Price, as long as the music is playing investors are still dancing.