Tag Archives: Paddy Power Betfair

Fancy Flutter

Even before the COVID19 outbreak, it was a time of rapid change and transformation in the sports betting and online gaming sector. Since my last post nearly a year ago, the big news was the merger of Flutter (FLTR.L) and the Stars Group Inc. (TSG) in an all stock deal (at a 55%:45% split). The deal was announced in October and closed in May. The headwinds in the sector include an increased regulatory focus, particularly on problem gambling, and an array of new taxes and restrictions which have pushed the sector further along the consolidation route. The great hope for the sector was the opening of online gambling and gaming in the US.

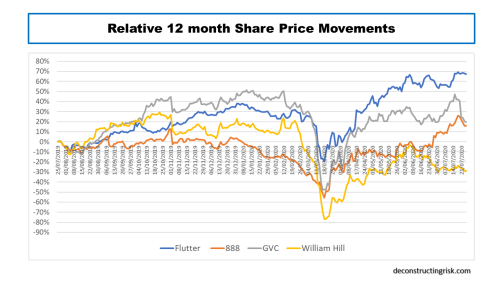
With that as the background, the COVID19 pandemic initially looked like it could create serious issues for the sector with cancelled sports events and retail shop closures. As the virus developed however, the upside in the demand for online gaming and gambling from people stuck at home combined with the spending power of government checks has resulted in a surge of online activity, particularly in gaming. The graph below of the relative share price movements over the past year for a sample of the market players illustrates the renewed optimism with the recent announcements on heightened online activity.

The performance of William Hill, with its over-reliance on retail, shows how far that business model must adapt to regain some of its former glory. 888, always the bridesmaid in the M&A dance of recent years, announced in June a 34% increase in average daily revenue in the year to date and boasted that it expected to beat EBITDA estimates for 2020 by a significant amount. In July, GVC announced a 30% H1 increase in online gaming and a 5% increase in online sports. For Q1, Flutter, which has been the focus of my posts in the past, initially announced approx. 30% growth in quarterly revenues up until the 15th of March with a dramatic fall off thereafter. In May, Flutter announced results to the 17th of May which showed extraordinarily strong gaming results and strong US and Australian performance. In late August, we will get a chance to see the H1 results of the newly merged entity in all its hoped for glory.

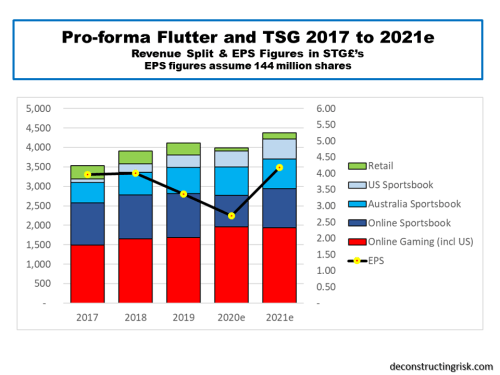
Projecting the short term in this pandemic environment is fraught with danger. Uncertainties relating to how the health situation develops, whether there will be more shut-downs or more openings, a second spike, whether government wage supports will be tempered, how defaults will progress are all subjects of daily discussion across the media. Notwithstanding these uncertainties, I have attempted to do a very rough and ready projection for the newly merged Flutter entity with the overarching assumption that gaming will remain strong, but not as extraordinary as the partial May figures, for the rest of 2020 (as will the US and Australia) but will pull back in 2021 as economies open back up and the full force of the recession and the COVID19 bills become reality. Offsetting the pull-back in 2021 of gaming is the opening of retail (albeit at a lower level than pre-COIVD) and the return of sports betting to a more normal level. The US is projected to continue its march forward in 2021. For my projections, the international and UK business of TSG is allocated to the online gaming and online sports lines as per the historical TSG breakdowns. The Australian business of Flutter and TSG is shown together.

I would again emphasize that my figures are rough guesstimates, particularly the operating results. Although the presentation released at the time of the merger announcement used 2018 figures, I looked through the updated prospectus from March which used 2019 figures and made my COVID adjustments for 2020 based upon trends to date and assumed impacts upon margins. For example, the merger presentation touted EBITDA margins of 30% and above for the future whereas I have assumed the 30% EBITDA margin in 2018 for the combined entity falls to 27%, 25% and 28% for 2019 to 2021 respectively.

The big difference in the business model of the newly merged entity is the amount of debt it is carrying now. I have assumed net debt of £3.85 billion at the end of H1 2020 and a pro-forma net debt to EBITDA multiple of 3.86 and 3.12 for 2020 and 2021 respectively (assuming no debt repayments over that time, the amount of which will depend upon whether they restart dividends). Their stated target to get below 2 quickly (e.g. by end 2022 or 2023 at the latest) looks very achievable given the highly cash generative nature of this business.

My proforma EPS estimates, based upon 144 million shares, is £2.70 and £4.19 for 2020 and 2021 respectively. The 2020 figure is marginally below their stated 150% uplift of the pre-merger 2019 EPS but not materially so given the COVID impact. On a forward PE basis, the stock currently trades at a 27.5 multiple of the 2021 EPS which is not out of line with the current market sentiment. Better growth than I have assumed for the remainder of 2020 and into 2021, the potential for the US business, and future synergies from the merger could justify such a premium rating. For me, cautious as ever and soooo remarkable bad at market timing, I would need to see more on the 2020 trends and a pull-back to be tempted out of my bear pit. I’ll leave it up to you, dear reader, to make your own mind up.

UPDATED H1 NUMBERS

On the 27 August, Flutter released their H1 figures and gave further insight into how 2020 may develop. I did highlight that my figures above were rough guesstimates and the actual H1 numbers showed that I got a few items wrong. First off, I missed the impact of the May 2020 equity raise which means net debt as at the end of H1 was £2.9 billion rather than the £3.85 billion I estimated. Also, share count at the end of H1 was 157 million rather than the 144 million as a result of the equity raise. Secondly, the H1 proforma revenue came in at £2.4 billion, making my FY2020 revenue estimate of £4 billion look light (ditto for 2020 earnings).

The H1 report also contained specifics on the one-off nature of items like poker revenue and net revenue margins, as below.

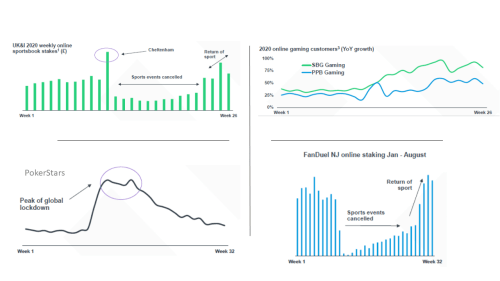
The report also shows the extraordinary trends from the height of lock-downs in certain sports and gaming categories, as below.

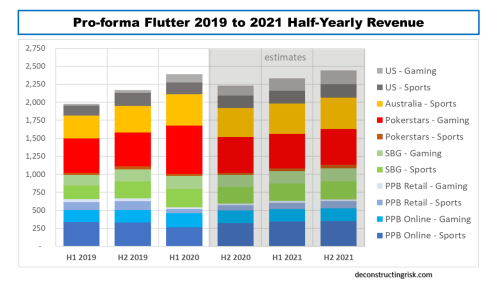
Guidance also highlighted the need to invest in the poker business and, as a result of heightened spending on items like marketing, the reduction in historical EBITDA margins of over 50% going forward. Based upon the pro-forma 2019 and H1 2020 results, my new projections on a half yearly basis are below.

I estimate that, even with tailwinds in 2020 such as the rescheduled UEFA 2021 Euro soccer tournament, 2021 revenue at £4.8 billion will only be marginally above my new 2020 revenue estimate of £4.6 billion. This assumes sporting events in 2021 return to a semblance of normality! I also estimate that EBITDA (excluding the US) in 2021 will be roughly equal to the 2020 mid guidance of £1.25 billion.

My new estimate of adjusted EPS for 2021 (excluding any SDI impact) is £5.00 which puts the current market valuation at 25 times the 2021 adjusted EPS. There is however a lot of uncertainty around that figure (not least that my estimates are way off base again!). It looks like it will take at least another few quarters before the combined business will stabilize into a more predictable pattern.

Betting Battles

The sports betting and online gaming sector is going through transformative times. Firms like William Hill (WMH.L), GVC (GVC.L) and Flutter (FLTR.L), the new name for Paddy Power Betfair, are grappling with greater regulatory restrictions, more taxes, and the need to be seen to take the issue of problem gambling seriously (some of which are outlined in this previous post). Many of these issues are having a direct impact on revenues and margins. At the same time, they are trying to build a presence in the newly opened US gambling market. The exhibit below, from a recent GVC presentation, shows the players by revenues, both in the physical and the online market.

click to enlarge

A look at the operating margins of these firms show the impact on profits for the largest firms, with the pure online players Bet365 and The Stars looking the most lucrative (although it will be interesting to see the results for Bet365 to March 2019 when they are released in November).

click to enlarge

The future size of the US market is impossible to forecast, although all the firms are highlighting the potential. As per this post (when I had time to do proper research for my posts!!), its unlikely that the US market when it matures will be as profitable as the European or Australian markets. As Flutter/Paddy Power Betfair is the best public firm in the sector (Bet365 is private) and the one I am most familiar with, and have posted on many times (here, here and here for example), I had a shot at estimating the results to 2020 and came up with an EPS of £3.54 for 2020 compared to just over £3.00 for 2019, as below. These estimates are very rough and ready, based primarily upon a doubling of US revenues and a reduction of EBITDA losses in the US to £20 million in 2020 from £55 million in 2019.

click to enlarge

Based upon today’s price, I estimate a PE ratio for Flutter (hate the name by the way) for 2019 and 2020 of 22 and 18.8 based upon the EPS estimates above. Given the risks in these business models and the uncertainties over the development of the US market (plus my negative macro outlook), that’s still too rich for my liking. For others, given there was takeover rumours a few months ago in this ever-changing sector, it may be worth the gamble.

A naughty or nice 2019?

They say if you keep making the same prediction, at some stage it will come true. Well, my 2018 post a year ago on the return of volatility eventually proved prescient (I made the same prediction for 2017!). Besides the equity markets (multiple posts with the latest one here), the non-company specific topics covered in this blog in 2018 ranged from the telecom sector (here), insurance (here, here, and here), climate change (here and here), to my own favourite posts on artificial intelligence (here, here and here).

The most popular post (by far thanks to a repost by InsuranceLinked)) this year was on the Lloyds’ of London market (here) and I again undertake to try to post more on insurance specific topics in 2019. My company specific posts in 2018 centered on CenturyLink (CTL), Apple (AAPL), PaddyPowerBetfair (PPB.L), and Nvidia (NVDA). Given that I am now on the side-lines on all these names, except CTL, until their operating results justify my estimate of fair value and the market direction is clearer, I hope to widen the range of firms I will post on in 2019, time permitting. Although this blog is primarily a means of trying to clarify my own thoughts on various topics by means of a public diary of sorts, it is gratifying to see that I got the highest number of views and visitors in 2018. I am most grateful to you, dear reader, for that.

In terms of predictions for the 2019 equity markets, the graph below shows the latest targets from market analysts. Given the volatility in Q4 2018, it is unsurprising that the range of estimates for 2019 is wider than previously. At the beginning of 2018, the consensus EPS estimate for the S&P500 was $146.00 with an average multiple just below 20. Current 2018 estimates of $157.00 resulted in a multiple of 16 for the year end S&P500 number. The drop from 20 to 16 illustrates the level of uncertainty in the current market

click to enlarge

For 2019, the consensus EPS estimate is (currently) $171.00 with an average 2019 year-end target of 2,900 implying a 17 multiple. Given that this EPS estimate of 9% growth includes sectors such as energy with an assumed healthy 10% EPS growth projection despite the oil price drop, it’s probable that this EPS estimate will come down during the upcoming earnings season as firms err on the conservative side for their 2019 projections.

The bears point to building pressures on top-line growth and on record profit margins. The golden boy of the moment, Michael Wilson of Morgan Stanley, calls the current 2019 EPS estimates “lofty”. The bulls point to the newly established (as of last Friday) Powell Put and the likely resolution of the US-China trade spat (because both sides need it). I am still dubious on a significant or timely relaxation of global quantitative tightening and don’t feel particularly inclined to bet money on the Orange One’s negotiating prowess with China. My guess is the Chinese will give enough for a fudge but not enough to satisfy Trump’s narcissistic need (and political need?) for a visible outright victory. The NAFTA negotiations and his stance on the Wall show outcomes bear little relation to the rhetoric of the man. These issues will be the story of 2019. Plus Brexit of course (or as I suspect the lack thereof).

Until we get further insight from the Q4 earnings calls, my current base assumption of 4% EPS growth to $164 with a multiple of 15 to 16 implies the S&P500 will be range bound around current levels of 2,400 – 2,600. Hopefully with less big moves up or down!

Historically, a non-recessionary bear market lasts on average 7 months according to Ed Clissold of Ned Davis Research (see their 2019 report here). According to Bank of America, since 1950 the S&P 500 has endured 11 retreats of 12% or more in prolonged bull markets with these corrections lasting 8 months on average. The exhibit below suggests that such corrections only take 5 months to recover peak to trough.

click to enlarge

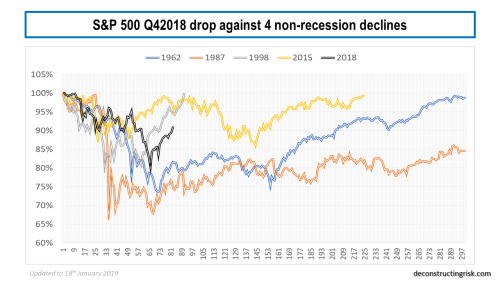
To get a feel for the possible direction of the S&P500 over 2019, I looked at the historical path of the index over 300 trading days after a peak for 4 non-recessionary and 4 recessionary periods (remember recessions are usually declared after they have begun), as below.

Note: These graphs have been subsequently updated for the S&P500 close to the 18th January 2019. 

click to enlarges&p500 q42018 drop compared to 4 nonrecession drops in 1962 1987 1998 & 2015 updated


click to enlarges&p500 q42018 drop compared to 4 recession drops in 1957 1974 1990 & 2000 updated


I will leave it to you, dear reader, to decide which path represents the most likely one for 2019. It is interesting that the 1957 track most closely matches the moves to date  (Ed: as per the date of the post, obviously not after that date!) but history rarely exactly rhymes. I have no idea whether 2019 will be naughty or nice for equity investors. I can predict with 100% certainty that it will not be dull….

Given that Brightwater’s pure Alpha fund has reportingly returned an impressive 14.6% for 2018 net of fees, I will leave the last word to Ray Dalio, who has featured regularly in this blog in 2018, as per his recent article (which I highly recommend):

Typically at this phase of the short-term debt cycle (which is where we are now), the prices of the hottest stocks and other equity-like assets that do well when growth is strong (e.g., private equity and real estate) decline and corporate credit spreads and credit risks start to rise. Typically, that happens in the areas that have had the biggest debt growth, especially if that happens in the largely unregulated shadow banking system (i.e., the non-bank lending system). In the last cycle, it was in the mortgage debt market. In this cycle, it has been in corporate and government debt markets.

When the cracks start to appear, both those problems that one can anticipate and those that one can’t start to appear, so it is especially important to identify them quickly and stay one step ahead of them.

So, it appears to me that we are in the late stages of both the short-term and long-term debt cycles. In other words, a) we are in the late-cycle phase of the short-term debt cycle when profit and earnings growth are still strong and the tightening of credit is causing asset prices to decline, and b) we are in the late-cycle phase of the long-term debt cycle when asset prices and economies are sensitive to tightenings and when central banks don’t have much power to ease credit.

A very happy and healthy 2019 to all.

Paddy Horribilis

Since I last posted on the gambling sector in March, the bad news just keeps on coming for the sector. The one bright spot has been the opening of the US market although, as my last post highlighted, the US business is on the lower end of the margin spectrum and there is considerable investment needed as the market opens. William Hill (WMH.L), GVC (GVC.L) and Paddy Power Betfair (PPB.L) are down 50%, 30% and 15% since my March post.

Some of the issues hitting the sector include the UK reduction in stake limits to £2 on gaming machines, the UK increasing the rate of remote gaming duty from 15% to 21% in 2019, new point of consumption taxes and restrictions on advertising in Australia, and increases in betting taxes in Ireland. Compounding these issues is a fiercely competitive environment with operators such as the privately owned Bet365 being very aggressive in sectors such as horse racing.

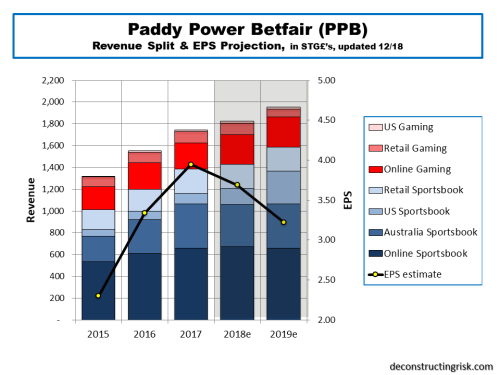
To illustrate the impact on PPB, my estimates below show a declining EPS for 2019 (the firm estimated all the changes impacting EBITDA by £115 million against their 2018 EBITDA midpoint estimate of £472 million, that’s a 24% hit!). My 2018 and 2019 EPS estimates are now down from £4.36 and £4.51 to £3.70 and £3.25 respectively. That’s an approx 15% and 30% cut for 2018 and 2019 respectively.

Click to enlarge

At the closing price today of £63.85, my 2019 EPS estimate implies a PE multiple of 20, way too scarily high given the headwinds in this sector and the overall market direction. The US represents the one bright spot in terms of top-line growth although I would be skeptical about the US business having a major bottom line benefit for a few years yet.

I did say previously that his sector is haunted by regulatory risk, haunted to the point of being scared to death!

Ramblin’ on Gamblin’

If you exclude investing, I am not a gambler. However I do find the gambling sector fascinating. I have been posting on the sector for over four years now (see posts under Gambling Sector category). As an example of an old bricks and mortar sector that has been revolutionised in recent years by the internet and smart phones, it is illuminating. As I said in a previous post, “this sector is haunted by regulatory risk” and this post will run through some regulatory developments, as well as business ones.

Late in December last year, Ladbrokes Coral (LCL) agreed to a takeover deal by GVC, the Isle of Man consolidator who owns BWIN, Sportbet, PartyPoker and Foxy Bingo. The smaller GVC, with 2017 revenue of €0.9 billion, structured an innovative deal for the larger LCL, with 2017 revenue of approx. £2.4 billion (I will update these figures when LCL announces its final 2017 figures in the coming days), with a sliding scale valuation based upon the UK Government’s triennial review of the sector.

The UK regulator and the government’s adviser on the issue, the Gambling Commission, today released its advice on fixed-odds betting terminals (FOBTs), often described as the “crack cocaine” of gambling. The Gambling Commission recommended a limit of £2 for “slot” style games, called B2 slots, and “a stake limit at or below £30” for other non-slot B2 games, such as the popular roulette games. Although LCL and William Hill shares popped today, the final decision is a political one and its by no means certain that a limit lower than £30 will not be implemented.

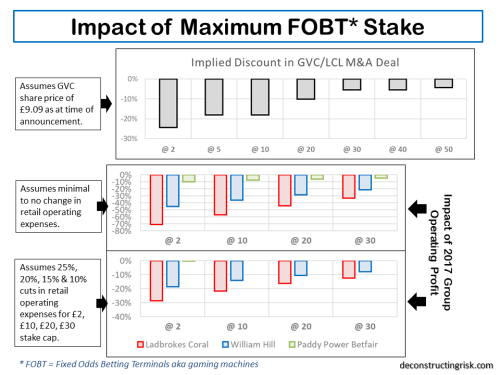
Based upon the sliding scale in the LCL/GVC deal and some assumptions on retail operating cost cuts based upon different FOBT stake limits, the graphic below shows the potential impact upon the business of LCL, William Hill (WMH) and Paddy Power Betfair (PPB). Again, LCL is based upon H1 results extrapolated and will be updated for the final 2017 figures.

click to enlarge

Based upon very rough estimates, the limits recommended could result in around 400 to 700 betting shops disposals or closures by the bigger firms, albeit that these shops are likely to be the least attractive for rivals or smaller firms. These estimates do not take into account potential mitigating actions undertaken by the betting firms. Lost FOBT revenue could be made up by increased sports betting facilitated by the introduction of self-service betting terminals (SSBTs) which allow punters to gamble on new betting products.

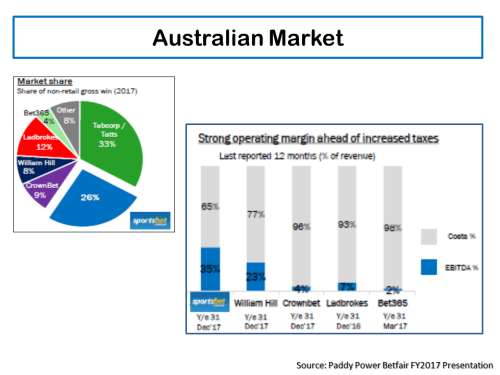
Point of consumption (PoC) taxes have been introduced in countries such as the UK and Ireland in recent years and are now payable in South Australia and have been announced in Western Australia. The other states in Australia are likely to introduce PoC taxes in 2019. These developments caused WMH to take a write-down on its Australian operations and sell them in March to the Canadian poker firm the Stars Group (formally the colourful Amaya), owner of PokerStars, PokerStars Casino, BetStars, and Full Tilt. The Stars Group (TSG) also increased its ownership in the Australian operator Crownbet in March which it intends to merge with the William Hill Australian operation. PPB was reported to have been interested in Crownbet previously but was obviously beaten on price by TSG. PPB had the exhibit below in their 2017 results presentation on the non-retail Australian market.

click to enlarge

A more positive regulatory development in the coming months could be a favourable decision by the US Supreme Court on the future of the Professional and Amateur Sports Protection Act of 1992 (PASPA). This whitepaper from the Massachusetts Gaming Commission gives a good insight into the legal issues under consideration and the implications for the sector in the US of different Supreme Court decisions, such as upholding PASPA or a narrow ruling or a full PASPA strike down. Other issues in the US include the terms under which individual States legislate for betting. The consultants Eilers & Krejcik opine that “a market incorporating both land-based and online sports betting products could be worth over two times a market that is restricted to land-based sports betting alone” although they conclude that “many – perhaps even most – states will choose to delay or forgo online”. It may be likely that many States will follow Nevada’s example and require online accounts to be initiated by a land-based provider with age and ID verification conducted on premises.

Sports betting in the US is generally low margin with WMH reporting US gross win margins around 6%. Other tailwinds to the US sector include rent seeking participants such as the sports bodies looking for “integrity fees”, a figure of 1% on the amount staked (called the handle in the US) have been suggested, or aggressive tax policies and levels by individual States. This paper by Michelle Minton outlines some fascinating background on PASPA and argues that any legalisation of betting across the US must be pitched at a level to counter the illegal market, estimated at $120 billion per year to be 20 times the size of the current legal sector in the US.

Philip Bowcock, the CEO of William Hill, in the 2017 results call summarised the opportunity in the US as follows:

“We do not quite know how the economics will work out because, as I said, there are three ways this could potentially go. It could either go purely retail, only taking sports bets in a retail environment. It could be the Nevada model, which is retail plus a mobile app signed up for in the retail environment. Or it could go completely remote registration, which is as we have in the UK. I do not expect every state in the US to regulate, and if they do, to go for that end model. I think each one is going to be different, and that is going to decide where we are as to what the economics are going to be.”

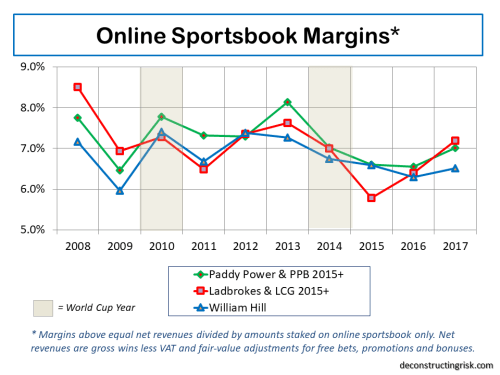
So, they are some of the regulatory issues challenging the sector today. In terms of historical and 2017 sportsbook margins shown below, I have spend some time revisiting my data and extracting more accurate data, particularly in relation to historical Ladbroke sportsbook net revenue margins. H2 sportsbook results, particularly Q4 results, were very favourable for the bookies. I estimate that the Q4 figures for PPB improved their full year net revenue margin on its sportsbook by 120 basis points. I debated whether to adjust the 2017 figures for the Q4 results but decided against it as the results reflect the volatility of the business and good or bad results should be left alone. It is the gambling business after all!!! As above, the LCL numbers are those extrapolated from H1 results with an uplift for the H2 favourable results and will be updated when the actual results are available.

click to enlarge

On the specific results from PPB, their 2017 EPS came in at £3.98, ahead of my August estimate of £3.72 for 2017 (see post here) but still behind my more optimistic March estimate of £4.14 (see post here). The lacklustre online sportsbook results are a concern (revenues up 8% compared to 14% and 25% for WMH and LCL respectively), as are the declining online gaming revenues. Increases in PoC taxes in Australia will impact operating margins in 2019 and FX will be a tailwind in 2018. Increased IT resources and investments in promoting new products and the Paddy Power brand are the focus of management in 2018, ahead of the World Cup. Discipline on M&A, as demonstrated by walking away from a CrownBet deal, are also highlighted as is potential firepower of £1.2 billion for opportunistic deals.

My new estimates for 2018 & 2019, after factoring in the items above, are £4.36 and £4.51 respectively, as below. These represent earnings multiples around 17 for PPB, not quite as rich as in the past, but justified given the 2017 results and the headwinds ahead. PPB must now show that it can deliver in 2018, a World Cup year, to maintain this diminished but still premium valuation.

click to enlarge

The coming months in this sector will be interesting. The fate of firms such as 888, with a market cap around £1 billion, will likely be in the mix (interesting that its fits within PPB’s budget!). WMH and 888 have tangoed in the past to no avail. Further dances are highly likely by the players in this fascinating sector.