Tag Archives: uncertainty

Multiple Temptation

I thought it was time for a quick catch up on all things reinsurance and specialty insurance since my last post a year ago. At that time, it looked like the underlying rating environment was gaining momentum and a hoped-for return to underwriting profitability looked on the cards. Of course, since then, the big game changer has been COVID-19.

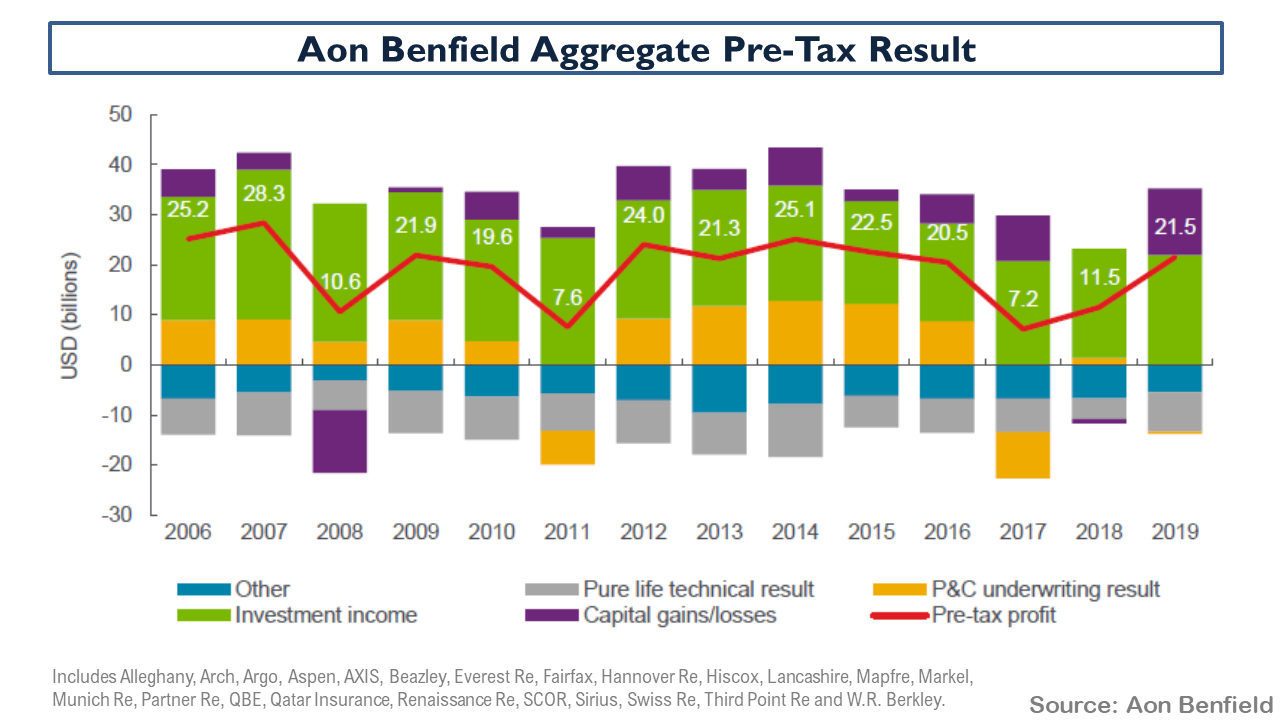
A quick catch-up on the 2019 results, as below, from the Aon Reinsurance Aggregate (ARA) results of selected firms illustrates the position as we entered this year. It is interesting to note that reserve releases have virtually dried up and the 2019 accident year excluding cats is around 96%.

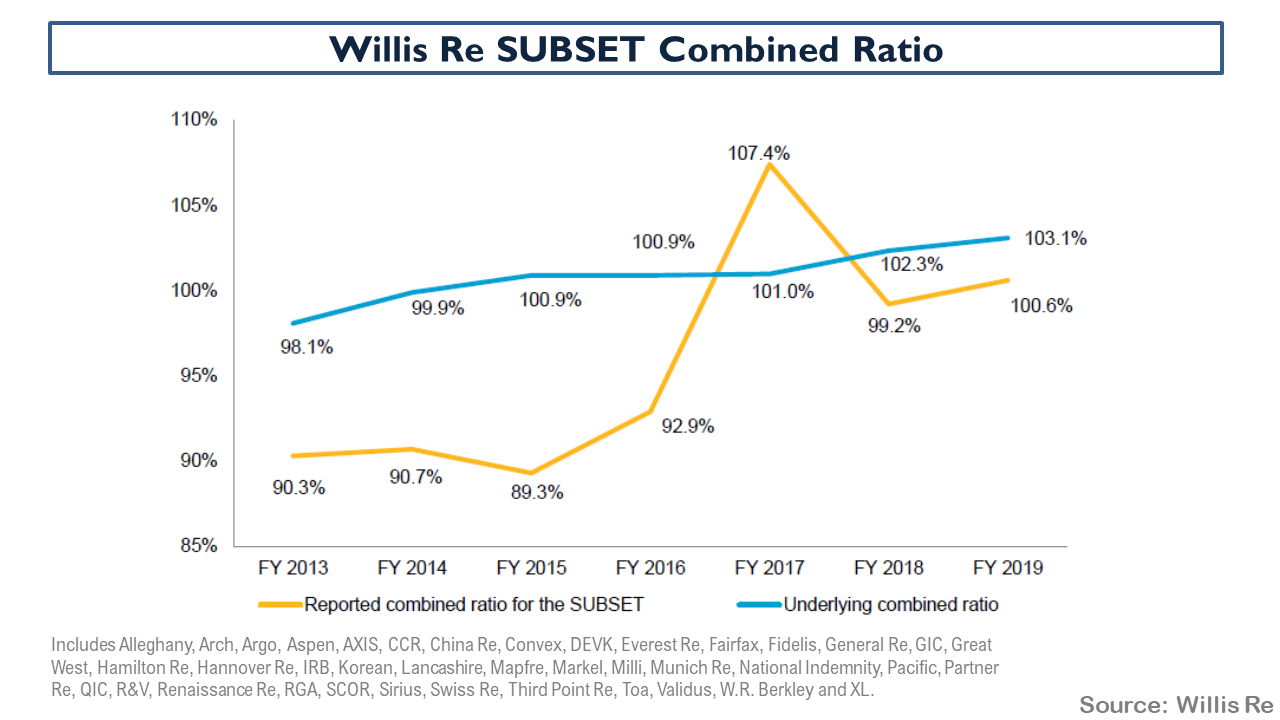
The Willis Re subset of aggregate results is broadly similar to the ARA (although it contains a few more of the lesser players and some life reinsurers and excludes firms like Beazley and Hiscox) and it shows that on an underling basis (i.e. accident year with normalised cat load), the trend is still upwards and more rate improvement is needed to improve attritional loss ratios.

The breakdown of the pre-tax results of the ARA portfolio, as below, shows that investment returns and gains saved the day in 2019.

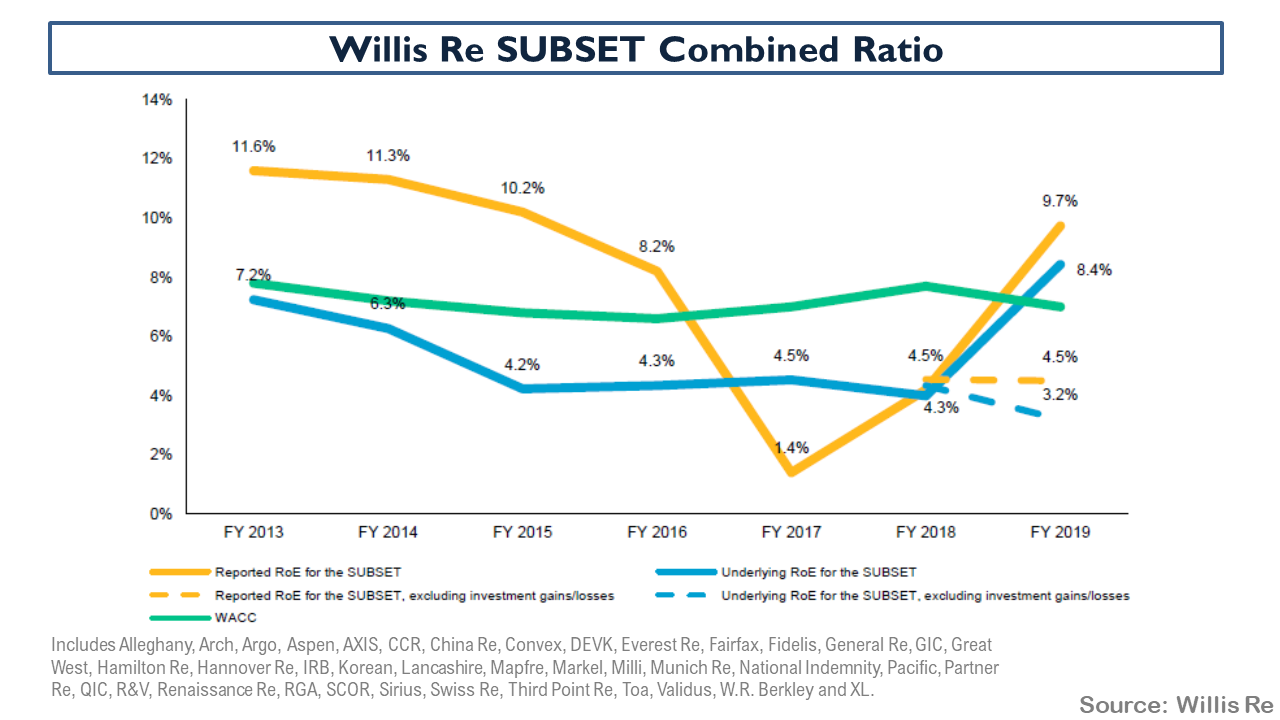
The ROE’s of the Willis portfolio when these gains were stripped out illustrates again how underwriting performance needs to improve.

Of course, COVID-19 has impacted the sector both in terms of actual realised losses (e.g. event cancellations) and with the cloud of uncertainty over reserves for multiple exposures yet to be fully realised. There remains much uncertainty in the sector about the exact size of the potential losses with industry estimates ranging widely. Swiss Re recently put the figure at between $50-80 billion. To date, firms have established reserves of just over $20 billion. One of the key uncertainties is the potential outcome of litigation around business interruption cover. The case brought in the UK by the FCA on behalf of policyholders hopes to expedite lengthy legal cases over the main policy wordings with an outcome expected in mid-September. Lloyds industry insurance loss estimate is within the Swiss Re range and their latest June estimate is shown below against other historical events.

I think Alex Maloney of Lancashire summarised the situation well when he said that “COVID-19 is an ongoing event and a loss which will take years to mature”, adding that for “the wider industry the first-party claims picture will not be clear until 2021”. Evan Greenberg of Chubb described the pandemic as a slow rolling global catastrophe impacting virtually all countries, unlike other natural catastrophes it has no geographic or time limits and the event continues as we speak” and predicted that “together the health and consequent economic crisis will likely produce the largest loss in insurance history, particularly considering its worldwide scope and how both sides of the balance sheet are ultimately impacted”.

The immediate impact of COVID-19 has been on rates with a significant acceleration of rate hardening across most lines of business, with some specialty lines such as certain D&O covers have seen massive increases of 50%+. Many firms are reporting H1 aggregate rate increases of between 10% to 15% across their diversified portfolios. Insurance rate increases over the coming months and reinsurance rates at the January renewals, assuming no material natural cats in H2 2020, will be the key test as to whether a true hard market has arrived. Some insurers are already talking about increasing their risk retentions and their PMLs for next year in response to reinsurance rate hardening.

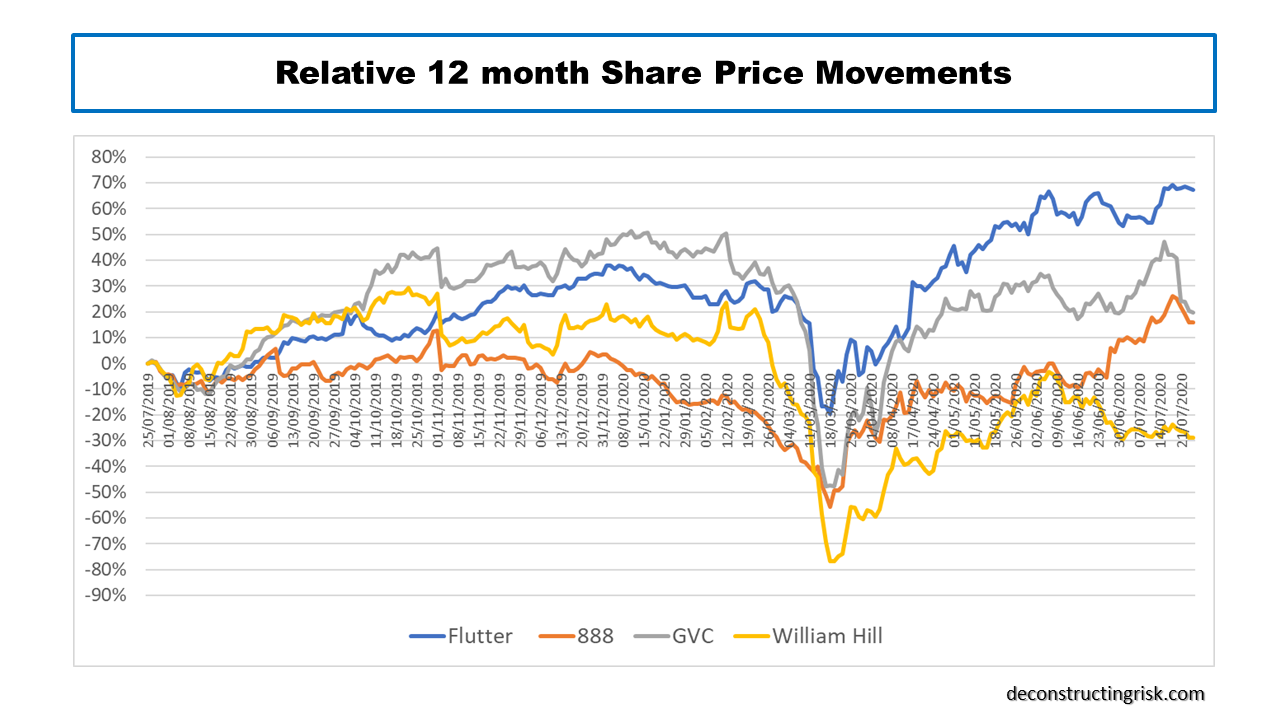
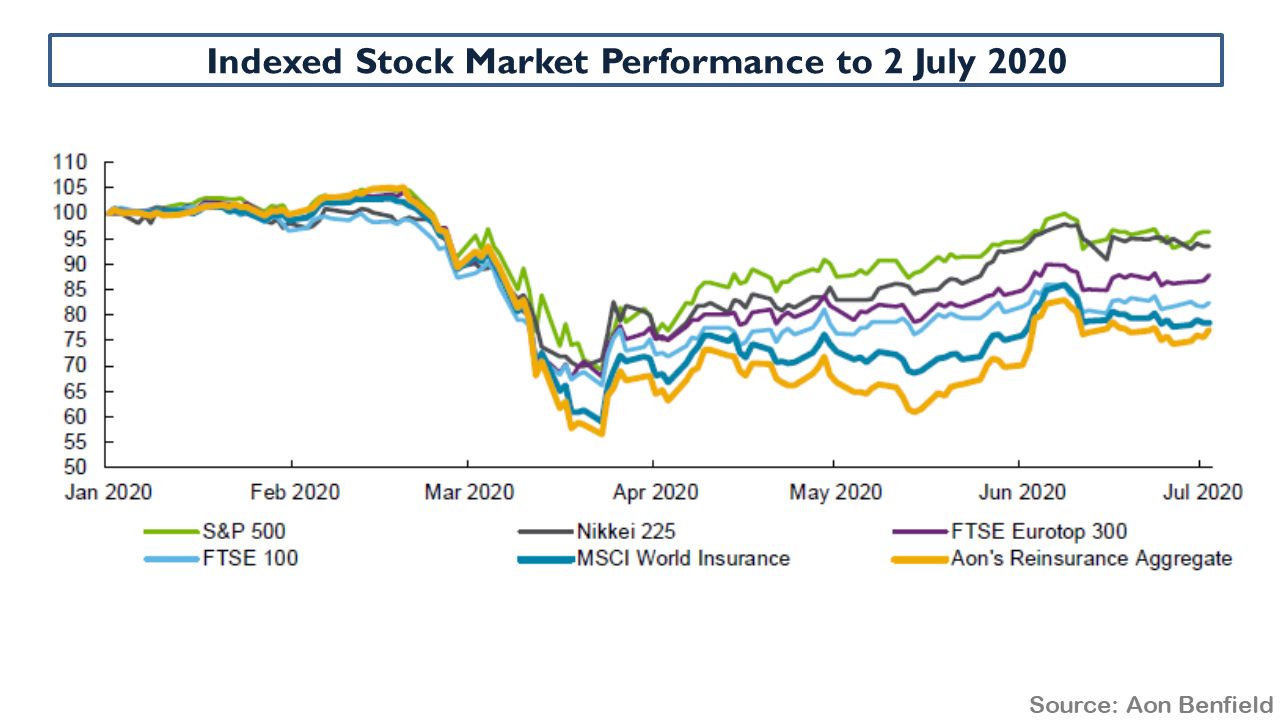
Valuations in the sector have taken a hit as the graph below from Aon on stock performance shows.

Leaving the uncertainty around COVID-19 to one side, tangible book multiples amongst several of my favourite firms since this March 2018 post, most of whom have recently raised additional capital in anticipation of a broad hard market in specialty insurance and reinsurance market, look tempting, as below.

The question is, can you leave aside the impact of COVID-19? That question is worthy of some further research, particularly on the day that Hiscox increased their COVID-19 reserves from $150 million to $230 million and indicated a range of a £10 million to £250 million hit if the UK business interruption case went against them (the top of the range estimate would reduce NTAs by 9%).

Food for thought.

Fancy Flutter

Even before the COVID19 outbreak, it was a time of rapid change and transformation in the sports betting and online gaming sector. Since my last post nearly a year ago, the big news was the merger of Flutter (FLTR.L) and the Stars Group Inc. (TSG) in an all stock deal (at a 55%:45% split). The deal was announced in October and closed in May. The headwinds in the sector include an increased regulatory focus, particularly on problem gambling, and an array of new taxes and restrictions which have pushed the sector further along the consolidation route. The great hope for the sector was the opening of online gambling and gaming in the US.

With that as the background, the COVID19 pandemic initially looked like it could create serious issues for the sector with cancelled sports events and retail shop closures. As the virus developed however, the upside in the demand for online gaming and gambling from people stuck at home combined with the spending power of government checks has resulted in a surge of online activity, particularly in gaming. The graph below of the relative share price movements over the past year for a sample of the market players illustrates the renewed optimism with the recent announcements on heightened online activity.

The performance of William Hill, with its over-reliance on retail, shows how far that business model must adapt to regain some of its former glory. 888, always the bridesmaid in the M&A dance of recent years, announced in June a 34% increase in average daily revenue in the year to date and boasted that it expected to beat EBITDA estimates for 2020 by a significant amount. In July, GVC announced a 30% H1 increase in online gaming and a 5% increase in online sports. For Q1, Flutter, which has been the focus of my posts in the past, initially announced approx. 30% growth in quarterly revenues up until the 15th of March with a dramatic fall off thereafter. In May, Flutter announced results to the 17th of May which showed extraordinarily strong gaming results and strong US and Australian performance. In late August, we will get a chance to see the H1 results of the newly merged entity in all its hoped for glory.

Projecting the short term in this pandemic environment is fraught with danger. Uncertainties relating to how the health situation develops, whether there will be more shut-downs or more openings, a second spike, whether government wage supports will be tempered, how defaults will progress are all subjects of daily discussion across the media. Notwithstanding these uncertainties, I have attempted to do a very rough and ready projection for the newly merged Flutter entity with the overarching assumption that gaming will remain strong, but not as extraordinary as the partial May figures, for the rest of 2020 (as will the US and Australia) but will pull back in 2021 as economies open back up and the full force of the recession and the COVID19 bills become reality. Offsetting the pull-back in 2021 of gaming is the opening of retail (albeit at a lower level than pre-COIVD) and the return of sports betting to a more normal level. The US is projected to continue its march forward in 2021. For my projections, the international and UK business of TSG is allocated to the online gaming and online sports lines as per the historical TSG breakdowns. The Australian business of Flutter and TSG is shown together.

I would again emphasize that my figures are rough guesstimates, particularly the operating results. Although the presentation released at the time of the merger announcement used 2018 figures, I looked through the updated prospectus from March which used 2019 figures and made my COVID adjustments for 2020 based upon trends to date and assumed impacts upon margins. For example, the merger presentation touted EBITDA margins of 30% and above for the future whereas I have assumed the 30% EBITDA margin in 2018 for the combined entity falls to 27%, 25% and 28% for 2019 to 2021 respectively.

The big difference in the business model of the newly merged entity is the amount of debt it is carrying now. I have assumed net debt of £3.85 billion at the end of H1 2020 and a pro-forma net debt to EBITDA multiple of 3.86 and 3.12 for 2020 and 2021 respectively (assuming no debt repayments over that time, the amount of which will depend upon whether they restart dividends). Their stated target to get below 2 quickly (e.g. by end 2022 or 2023 at the latest) looks very achievable given the highly cash generative nature of this business.

My proforma EPS estimates, based upon 144 million shares, is £2.70 and £4.19 for 2020 and 2021 respectively. The 2020 figure is marginally below their stated 150% uplift of the pre-merger 2019 EPS but not materially so given the COVID impact. On a forward PE basis, the stock currently trades at a 27.5 multiple of the 2021 EPS which is not out of line with the current market sentiment. Better growth than I have assumed for the remainder of 2020 and into 2021, the potential for the US business, and future synergies from the merger could justify such a premium rating. For me, cautious as ever and soooo remarkable bad at market timing, I would need to see more on the 2020 trends and a pull-back to be tempted out of my bear pit. I’ll leave it up to you, dear reader, to make your own mind up.

UPDATED H1 NUMBERS

On the 27 August, Flutter released their H1 figures and gave further insight into how 2020 may develop. I did highlight that my figures above were rough guesstimates and the actual H1 numbers showed that I got a few items wrong. First off, I missed the impact of the May 2020 equity raise which means net debt as at the end of H1 was £2.9 billion rather than the £3.85 billion I estimated. Also, share count at the end of H1 was 157 million rather than the 144 million as a result of the equity raise. Secondly, the H1 proforma revenue came in at £2.4 billion, making my FY2020 revenue estimate of £4 billion look light (ditto for 2020 earnings).

The H1 report also contained specifics on the one-off nature of items like poker revenue and net revenue margins, as below.

The report also shows the extraordinary trends from the height of lock-downs in certain sports and gaming categories, as below.

Guidance also highlighted the need to invest in the poker business and, as a result of heightened spending on items like marketing, the reduction in historical EBITDA margins of over 50% going forward. Based upon the pro-forma 2019 and H1 2020 results, my new projections on a half yearly basis are below.

I estimate that, even with tailwinds in 2020 such as the rescheduled UEFA 2021 Euro soccer tournament, 2021 revenue at £4.8 billion will only be marginally above my new 2020 revenue estimate of £4.6 billion. This assumes sporting events in 2021 return to a semblance of normality! I also estimate that EBITDA (excluding the US) in 2021 will be roughly equal to the 2020 mid guidance of £1.25 billion.

My new estimate of adjusted EPS for 2021 (excluding any SDI impact) is £5.00 which puts the current market valuation at 25 times the 2021 adjusted EPS. There is however a lot of uncertainty around that figure (not least that my estimates are way off base again!). It looks like it will take at least another few quarters before the combined business will stabilize into a more predictable pattern.

Correlation contagion

I fear that the daily announcements on bankruptcies, specifically in the retail sector, is just the beginning of the journey into our new reality. Despite relatively positive noises from US banks about short term loan provisions and rebounding consumer spending, the real level of defaults, particularly in the SME sector, will not become clear until the sugar high of direct government stimulus is withdrawn. In the UK, for example, the furlough scheme is paying 80% of the wages of approximately 9 million workers and is currently costing the same in government spending monthly as the NHS. This UK subsidy is due to be withdrawn in October. In the US, the $600 weekly boost to unemployment payments is due to expire at the end of July.

The S&P forecasts for the default rate on US junk debt, as below, illustrates a current projection. There are many uncertainties on the course of the pandemic and the economic impacts over the coming months and quarters that will dictate which scenario is in our future.

It is therefore not surprising that the oft highlighted concerns about the leveraged loan market have been getting a lot of recent attention, as the following articles in the New Yorker and the Atlantic dramatically attest to – here and here. I would recommend both articles to all readers.

I must admit to initially feeling that the dangers have been exaggerated in these articles in the name of journalist license. After all, the risks associated with the leveraged loan market have been known for some time, as this post from last year illustrates, and therefore we should be assured that regulators and market participants are on top of the situation from a risk management perspective. Right? I thought I would dig a little further into the wonderful world of collateralized loan obligations, commonly referred to as CLOs, to find out.

First up is a report from the Bank of International Settlements (BIS) in September on the differences between collateralised debt obligations (CDOs) and CLOs. I was heartened to learn that “there are significant differences between the CLO market today and the CDO market prior to the great financial crisis”. The report highlighted the areas of difference as well as the areas of similarity as follows:

CLOs are less complex, avoiding the use of credit default swaps (CDS) and resecuritisations; they are little used as collateral in repo transactions; and they are less commonly funded by short-term borrowing than was the case for CDOs. In addition, there is better information about the direct exposures of banks. That said, there are also similarities between the CLO market today and the CDO market then, including some that could give rise to financial distress. These include the deteriorating credit quality of CLOs’ underlying assets; the opacity of indirect exposures; the high concentration of banks’ direct holdings; and the uncertain resilience of senior tranches, which depend crucially on the correlation of losses among underlying loans.

The phase “uncertain resilience of senior tranches” and the reference to correlation sent a cold shiver down my spine. According to BIS, the senior AAA tranches are higher up the structure (e.g. 65% versus 75%-80% in the bad old days), as this primer from Guggenheim illustrates:

As in the good old CDO days, the role of the rating agencies is critical to the CLO ecosystem. This May report from the European Securities and Markets Authority (ESMA) shows that EU regulators are focused on the practices the rating agencies are following in relation to their CLO ratings. I was struck by the paragraph below in the executive summary (not exactly the reassurance I was hoping for).

The future developments regarding the Covid 19 outbreak will be an important test for CLO methodologies, notably by testing: i) the approaches and the assumptions for the modelling of default correlation among the pool of underlying loans; and ii) the sensitivity of CLO credit ratings to how default and recovery rates are calibrated. Moreover, the surge of covenant-lite loans prevents lenders and investors from early warning indicators on the deterioration of the creditworthiness of the leveraged loans.

As regular readers will know, correlations used extensively in financial modelling is a source of much blog angst on my part (examples of previous posts include here, here and here). As I may have previously explained, I worked for over a decade in a quant driven firm back in the 1990’s that totally underestimated correlations in a tail event on assumed diverse risk portfolios. The firm I worked for did not survive long after the events of 9/11 and the increased correlation across risk classes that resulted. It was therefore with much bewilderment that I watched the blow-up in complex financial structures because of the financial crisis and the gross misunderstanding of tail correlations that were absent from historical data sets used to calibrate quant models. It is with some trepidation therefore when I see default correlation been discussed yet again in relation to the current COVID19 recession. To paraphrase Buffett, bad loans do not become better by simply repackaging them. Ditto for highly leveraged loans with the volume turned up to 11. As many commentators have highlighted in recent years and the Fed noted recently (see this post), the leverage in terms of debt to EBITDA ratios in leveraged loans has crept up to pre-financial crisis levels before the COVID19 global outbreak.

Next up, I found this blog from MSCI in early April insightful. By applying market implied default rates and volatilities from late March to MSCI’s CLO model of a sample 2019 CLO deal with 300 loans diversified across 10 industry sectors, they arrived at some disturbing results. Using 1-year default rates for individual risks of approximately 20% to 25% across most sectors (which does not seem outrageous to me when talking about leverage loans, they are after all highly leveraged!!), they estimated the probability of joint defaults using sample 2019 CLO deal at 1 and 3-year horizons as below.

The MSCI analysis also showed the implied cross-sector default-rate correlations and a comparison with the correlations seen in the financial crisis, as below.

Even to me, some of these correlations (particularly those marked in red) look too elevated and the initial market reaction to COVID19 of shoot first and ask questions later may explain why. The MSCI article concludes with an emphasis on default correlation as below.

During periods of low default correlation, even with relatively high loan default rates, the tail probability of large total default is typically slim. If the current historically high default-rate correlations persist — combined with high loan default rates and default-rate volatility — our model indicates that a large portion of the examined pool may default and thereby threaten higher-credit tranches considered safe before the crisis

I decided to end my CLO journey by looking at what one rating agency was saying. S&P states that the factors which determine their CLO ratings are the weighted average rating of a portfolio, the diversity of the portfolio (in terms of obligors, industries, and countries), and the weighted average life of the portfolio. Well, we know we are dealing with highly leveraged loans, the junkiest if you like, with an average pre-COVID rating of B (although it is likely lower in today’s post-COVID environment) so I have focused on the portfolio diversity factor as the most important risk mitigant. Typically, CLOs have 100 to 300 loans which should give a degree of comfort although in a global recession, the number of loans matters less given the common risky credit profile of each. In my view, the more important differentiator in this recession is its character in terms of the split between sector winners and losers, as the extraordinary rally in the equity market of the technology giants dramatically illustrates.

S&P estimated that as at year end 2019, the average CLO contained approximately 200 loans and had an average industry diversity metric of 25. Its important to stress the word “average” as it can hid all sorts of misdemeanors. Focusing on the latter metric, I investigated further the industry sector classifications used by S&P. These classifications are different and more specific from the usual broad industry sectorial classifications used in equity markets given the nature of the leveraged loan market. There are 66 industry sectors in all used by S&P although 25 of the sectors make up 80% of the loans by size. Too many spurious variables are the myth that often lies at the quant portfolio diversification altar. To reflect the character of this recession, I judgmentally grouped the industry sectors into three exposure buckets – high, medium and low. By sector number the split was roughly equal to a third for each bucket. However, by loan amount the split was 36%, 46% and 18% for the high, medium and low sectors respectively. Over 80% in the high and medium buckets! That simplistic view of the exposure would make me very dubious about the real amount of diversification in these portfolios given the character of this recession. As a result, I would question the potential risk to the higher credit quality tranches of CLOs if their sole defense is diversification.

Maybe the New Yorker and Atlantic articles are not so sensationalist after all.

FED speak

In this time of uncertainty, we can only search for insights as we await actual Q2 figures and see how businesses fare as lock-downs are slowly relaxed. Many businesses, particularly SMEs, may hobble on for a while as demand slowly picks up and governmental support becomes due for withdrawal. Some, like hairdressers, will re-establish their businesses due to the nature of their service or product and with the support of a loyal customer base. Some may even thrive as their businesses adapt to the new normal.  Many may not. Services dependent upon crowds such as the leisure and hospitality sectors look particularly exposed. The digital transformation of many businesses will take a leap forward and the creative destruction of capitalism will take its course. Many of the old ways of doing businesses will be consigned to history in one fell swoop.

The FED this week issued their financial stability report with the following view on the current level of vulnerabilities:

1) Asset valuations. Asset prices remain vulnerable to significant price declines should the pandemic take an unexpected course, the economic fallout prove more adverse or financial system strains re-emerge.

2) Borrowing by businesses and households. Debt owed by businesses had been historically high relative to gross domestic product (GDP) through the beginning of 2020, with the most rapid increases concentrated among the riskiest firms amid weak credit standards. The general decline in revenues associated with the severe reduction in economic activity has weakened the ability of businesses to repay these (and other) obligations. While household debt was at a moderate level relative to income before the shock, a deterioration in the ability of some households to repay obligations may result in material losses to lenders.

3) Leverage in the financial sector. Before the pandemic, the largest U.S. banks were strongly capitalized, and leverage at broker-dealers was low; by contrast, measures of leverage at life insurance companies and hedge funds were at the higher ends of their ranges over the past decade. To date, banks have been able to meet surging demand for draws on credit lines while also building loan loss reserves to absorb higher expected defaults. Broker dealers struggled to provide intermediation services during the acute period of financial stress. At least some hedge funds appear to have been severely affected by the large asset price declines and increased volatility in February and March, reportedly contributing to market dislocations. All told, the prospect for losses at financial institutions to create pressures over the medium term appears elevated.

4) Funding risk. In the face of the COVID-19 outbreak and associated financial market tur­moil, funding markets proved less fragile than during the 2007–09 financial crisis. None­theless, significant strains emerged, and emergency Federal Reserve actions were required to stabilize short-term funding markets.

The point about household debt is an important one and points to the likelihood that this will be a recession with characteristics more akin to those before the 2008 financial crisis, as per the graph below.

The oft highlighted concerns about leveraged loans in recent times has again been highlighted by the Fed as a worry in this crisis, as below, with default rates likely to turn sharply upwards.

However, it was the commentary in the report from the Fed’s market outreach that I thought captured succinctly the current market fears for the future:

Many contacts expressed concern that a U.S. recession brought about by the pandemic could expose highly leveraged sectors of the economy. Contacts noted that corporate default rates were likely to increase sharply, with acute stress in the energy sector. Even before the outbreak spread to the United States, concerns related to nonfinancial corporate debt were cited frequently, with a focus on the growth in leveraged loans, private credit, and triple-B-rated bonds. More recently, surveyed respondents noted that a period of renewed outflows from credit-oriented mutual funds could lead to limits on redemptions and that stressed global insurers could become large sellers of U.S. corporate bonds.

A number of contacts also raised concerns over household balance sheets, especially in low-income segments, highlighting increases in credit card, student loan, and auto loan delinquencies as well as concerns over spillovers from nonpayments of rent and mortgages. Against the backdrop of corporate, consumer, and real estate stress, several respondents noted that bank asset quality could come under severe pressure. Smaller banks with high concentrations of lower-rated consumers, small and medium-sized businesses, and commercial real estate were viewed as especially vulnerable.

Several policy-related risks were also identified, including the risk that funding designated to support small businesses would be either insufficient to address the scale of the need or not timely enough to avert a wave of layoffs and bankruptcies. Finally, a few contacts noted the prospect that state and local governments would face large budgetary gaps, with spillovers to the municipal bond market and local economies. In the euro area, some respondents noted that the absence of more expansive fiscal resource sharing or debt mutualization could underpin a return of redenomination risk in some of the monetary union’s most indebted sovereigns.

A few respondents noted that novel investment strategies and market structures could prove vulnerable in a sustained market downturn. Specifically mentioned were the growth of short-volatility strategies, the expansion of leveraged ETFs, and the reliance in some markets on sources of liquidity that could withdraw in a shock.

Finally, geopolitical tensions were cited frequently as a medium- to long-term risk. A few contacts noted that the COVID-19 outbreak could amplify tensions and accelerate a shift away from multilateralism. Respondents also highlighted the risk of heightened trade tensions and the possibility that the virus and its fallout could accelerate global leadership changes and amplify political uncertainty.