Tag Archives: expected loss

Multiple Temptation

I thought it was time for a quick catch up on all things reinsurance and specialty insurance since my last post a year ago. At that time, it looked like the underlying rating environment was gaining momentum and a hoped-for return to underwriting profitability looked on the cards. Of course, since then, the big game changer has been COVID-19.

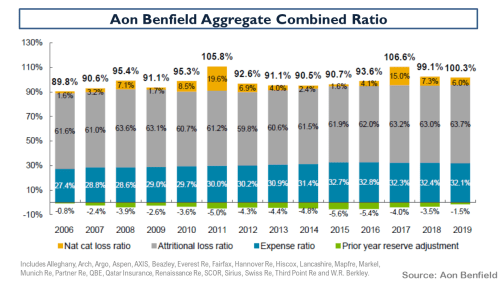
A quick catch-up on the 2019 results, as below, from the Aon Reinsurance Aggregate (ARA) results of selected firms illustrates the position as we entered this year. It is interesting to note that reserve releases have virtually dried up and the 2019 accident year excluding cats is around 96%.

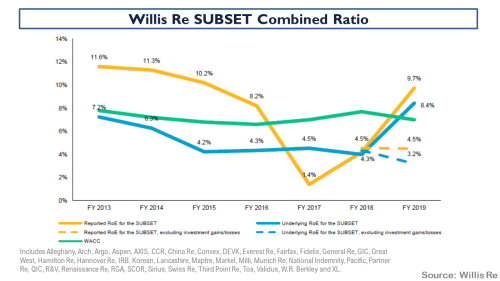
The Willis Re subset of aggregate results is broadly similar to the ARA (although it contains a few more of the lesser players and some life reinsurers and excludes firms like Beazley and Hiscox) and it shows that on an underling basis (i.e. accident year with normalised cat load), the trend is still upwards and more rate improvement is needed to improve attritional loss ratios.

The breakdown of the pre-tax results of the ARA portfolio, as below, shows that investment returns and gains saved the day in 2019.

The ROE’s of the Willis portfolio when these gains were stripped out illustrates again how underwriting performance needs to improve.

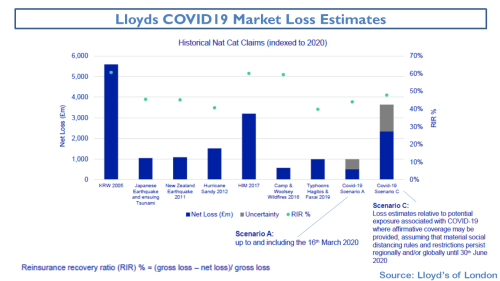
Of course, COVID-19 has impacted the sector both in terms of actual realised losses (e.g. event cancellations) and with the cloud of uncertainty over reserves for multiple exposures yet to be fully realised. There remains much uncertainty in the sector about the exact size of the potential losses with industry estimates ranging widely. Swiss Re recently put the figure at between $50-80 billion. To date, firms have established reserves of just over $20 billion. One of the key uncertainties is the potential outcome of litigation around business interruption cover. The case brought in the UK by the FCA on behalf of policyholders hopes to expedite lengthy legal cases over the main policy wordings with an outcome expected in mid-September. Lloyds industry insurance loss estimate is within the Swiss Re range and their latest June estimate is shown below against other historical events.

I think Alex Maloney of Lancashire summarised the situation well when he said that “COVID-19 is an ongoing event and a loss which will take years to mature”, adding that for “the wider industry the first-party claims picture will not be clear until 2021”. Evan Greenberg of Chubb described the pandemic as a slow rolling global catastrophe impacting virtually all countries, unlike other natural catastrophes it has no geographic or time limits and the event continues as we speak” and predicted that “together the health and consequent economic crisis will likely produce the largest loss in insurance history, particularly considering its worldwide scope and how both sides of the balance sheet are ultimately impacted”.

The immediate impact of COVID-19 has been on rates with a significant acceleration of rate hardening across most lines of business, with some specialty lines such as certain D&O covers have seen massive increases of 50%+. Many firms are reporting H1 aggregate rate increases of between 10% to 15% across their diversified portfolios. Insurance rate increases over the coming months and reinsurance rates at the January renewals, assuming no material natural cats in H2 2020, will be the key test as to whether a true hard market has arrived. Some insurers are already talking about increasing their risk retentions and their PMLs for next year in response to reinsurance rate hardening.

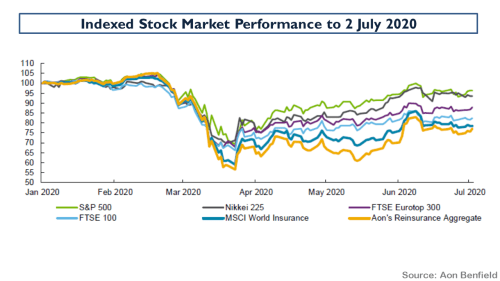
Valuations in the sector have taken a hit as the graph below from Aon on stock performance shows.

Leaving the uncertainty around COVID-19 to one side, tangible book multiples amongst several of my favourite firms since this March 2018 post, most of whom have recently raised additional capital in anticipation of a broad hard market in specialty insurance and reinsurance market, look tempting, as below.

The question is, can you leave aside the impact of COVID-19? That question is worthy of some further research, particularly on the day that Hiscox increased their COVID-19 reserves from $150 million to $230 million and indicated a range of a £10 million to £250 million hit if the UK business interruption case went against them (the top of the range estimate would reduce NTAs by 9%).

Food for thought.

Creepy Things

It has been a while since I looked at the state of the reinsurance and specialty insurance markets. Recent market commentary and insurers’ narratives at recent results have suggested market rates are finally firming up, amidst talk of reserve releases drying up and loss creep on recent events.

Just yesterday, Bronek Masojada the CEO of Hiscox commented that “the market is in a better position than it has been for some time”. The Lancashire CEO Alex Maloney said he was “encouraged by the emerging evidence that the (re)insurance market is now experiencing the long-anticipated improvements in discipline and pricing”. The Chubb CEO Evan Greenberg said that “pricing continued to tighten in the quarter while spreading to more classes and segments of business, particularly in the U.S. and London wholesale market”.

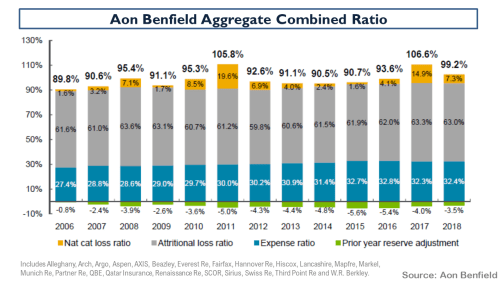
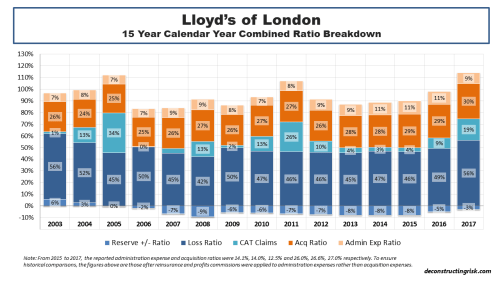
A look at the historical breakdown of combined ratios in the Aon Benfield Aggregate portfolio from April (here) and Lloyds results below illustrate the downward trend in reserve releases in the market to the end of 2018. The exhibits also indicate the expense disadvantage that Lloyds continues to operate under (and the reason behind the recently announced modernisation drive).

click to enlarge

click to enlarge

In the Willis Re mid-year report called “A Discerning Market” their CEO James Kent said “there are signs that the longstanding concern over the level of reserve redundancy in past year reserves is coming to fruition” and that in “some classes, there is a clear trend of worsening loss ratios in recent underwriting years due to a prolonged soft market and an increase in loss severity.

 In their H1 presentation, Hiscox had an exhibit that quantified some of the loss creep from recent losses, as below.

click to enlarge

The US Florida hurricane losses have been impacted by factors such as assignment of benefits (AOB) in litigated water claims and subsequently inflating repair costs. Typhoon Jebi losses have been impacted by overlapping losses and demand surge from Typhoon Trami, the Osaka earthquake and demand from Olympics construction. Arch CEO Marc Grandisson believes that the market missed the business interruption and contingent BI exposures in Jebi estimates.

The fact that catastrophic losses are unpredictable, even after the event, is no surprise to students of insurance history (this post on the history of Lloyds is a testament to unpredictability). Technology and advances in modelling techniques have unquestionably improved risk management in insurance in recent years. Notwithstanding these advances, uncertainty and the unknown should always be considered when model outputs such as probability of loss and expected loss are taken as a given in determining risk premium.

To get more insight into reserve trends, it’s worth taking a closer look at two firms that have historically shown healthy reserve releases – Partner Re and Beazley. From 2011 to 2016, Partner Re’s non-life business had an average reserve release of $675 million per year which fell to $450 million in 2017, and to $250 million in 2018. For H1 2019, that figure was $15 million of reserve strengthening. The exhibit below shows the trend with 2019 results estimated based upon being able to achieve reserve releases of $100 million for the year and assuming no major catastrophic claims in 2019. Despite the reduction in reserve releases, the firm has grown its non-life business by double digits in H1 2019 and claims it is “well-positioned to benefit from this improved margin environment”.

click to enlarge

Beazley is one of the best insurers operating from London with a long history of mixing innovation with a balanced portfolio. It has doubled its net tangible assets (NTA) per share over the past 10 years and trades today at a 2.7 multiple to NTA. Beazley is also predicting double digit growth due to an improving rating environment whilst predicting “the scale of the losses that we, in common with the broader market, have incurred over the past two years means that below average reserve releases will continue this year”.

click to enlarge

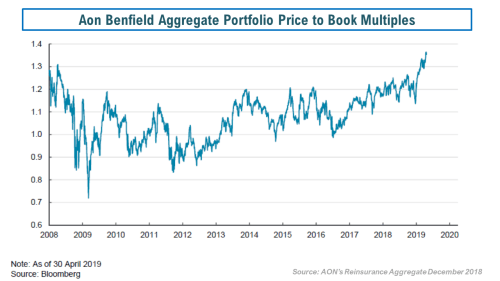
And that’s the rub. Although reserves are dwindling, rate improvements should help specialty (re)insurers to rebuild reserves and improve profitability back above its cost of capital, assuming normal catastrophe loss levels. However, market valuations, as reflected by the Aon Benfield price to book exhibit below, look like they have all that baked in already.

click to enlarge

And that’s a creepy thing.

Befuddled Lloyd’s

Lloyd’s of London always provides a fascinating insight into the London insurance market and beyond into the global specialty insurance market, as this previous post shows. It’s Chairman, Bruce Carnegie-Brown, commented in their 2017 annual report that he expects “2018 to be another challenging year for Lloyd’s and the Corporation continues to refine its strategy to address evolving market conditions”. Given the bulking up of many of its competitors through M&A, Willis recently called it a reinvigoration of the “big balance sheet” reinsurance model, Lloyd’s needs to get busy sharpening its competitive edge. In a blunter message Brown stressed that “the market’s 2017 results are proof, if any were needed, that business as usual is not sustainable”.

A looked at the past 15 years of underwriting results gives an indicator of current market trends since the underwriting quality control unit, called the Franchise Board, was introduced at the end of 2002 after the disastrous 1990’s for the 330-year-old institution.

click to enlarge

The trend of increasing non-CAT loss ratios after years of soft pricing coupled with declining prior year reserve releases is clear to see. That increases the pressure on the insurance sector to control expenses. To that end, Inga Beale, Lloyd’s CEO, is pushing modernisation via the London Market Target Operating Model programme hard, stating that electronic placement will be mandated, on a phased basis, “to speed up the adoption of the market’s modernisation programme, which will digitise processes, reduce unsustainable expense ratios, and make Lloyd’s more attractive to do business with”.

The need to reduce expenses in Lloyd’s is acute given its expense ratio is around 40% compared to around 30% for most of its competitors. Management at Lloyd’s promised to “make it cheaper and easier to write business at Lloyd’s, enabling profitable growth”. Although Lloyd’s has doubled its gross premium volumes over the past 15 years, the results over varying timeframes below, particularly the reducing underwriting margins, show the importance of stressing profitable growth and expense efficiencies for the future.

click to enlarge

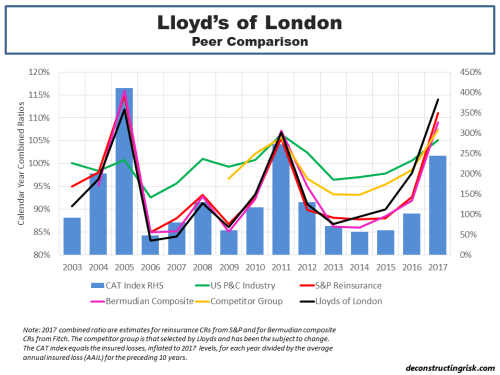
A peer comparison of Lloyd’s results over the past 15 years illustrates further the need for the market to modernise, as below. Although the 2017 combined ratio for some of the peer groupings have yet to finalised and published (I will update the graph when they do so), the comparison indicates that Lloyd’s has been doing worse than its reinsurance and Bermudian peers in recent years. It is suspicious to see, along with the big reinsurers and Bermudians, Lloyd’s included Allianz, CNA, and Zurich (and excluded Mapfe) in their competitor group from 2017. If you can’t meet your target, just change the metric behind the target!

click to enlarge

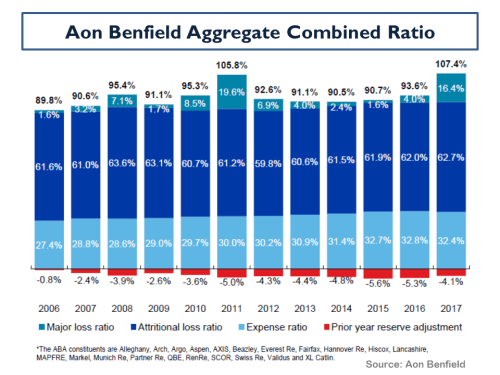
A recent report from Aon Benfield shows the breakdown of the combined ratio for their peer portfolio of specialist insurers and reinsurers from 2006 to 2017, as below.

click to enlargeAon Benfield Aggregate Combined Ratio 2006 to 2017

So, besides strong competitors, increasing loss ratios and heavy expense loads, what does Lloyd’s have to worry about? Well, in common with many, Lloyd’s must contend with structural changes across the industry as a result of, in what Willis calls in their latest report, “the oversupply of capital” from investors in insurance linked securities (ILS) with a lower cost of capital, whereby the 2017 insured losses appears to have had “no impact upon appetite”, according to Willis.

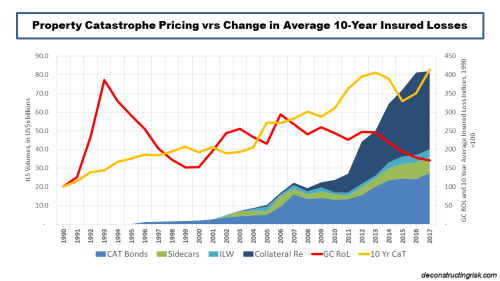
I have posted many times, most recently here, on the impact ILS has had on property catastrophe pricing. The graph of the average multiple of coupon to expected loss on deals monitored by sector expert Artemis again illustrates the pricing trend. I have come up with another angle to tell the story, as per the graph below. I compared the Guy Carpenter rate on line (ROL) index for each year against an index of the annual change in the rolling 10-year average global catastrophe insured loss (which now stands at $66 billion for 2008-2017). Although it is somewhat unfair to compare a relative measure (the GC ROL index) against an absolute measure (change in average insured loss), it makes a point about the downward trend in property catastrophe reinsurance pricing in recent years, particularly when compared to the trend in catastrophic losses. To add potentially to the unfairness, I also included the rising volumes in the ILS sector, in an unsubtle finger point.

click to enlarge

Hilary Weaver, Lloyd’s CRO, recognises the danger and recently commented that “the new UK ILS regulation will, if anything, increase the already abundant supply of insurance capital” and “this is likely to mean that prices remain low for many risks, so we need to remain vigilant to ensure that the prices charged for them are proportionate to the risk”.

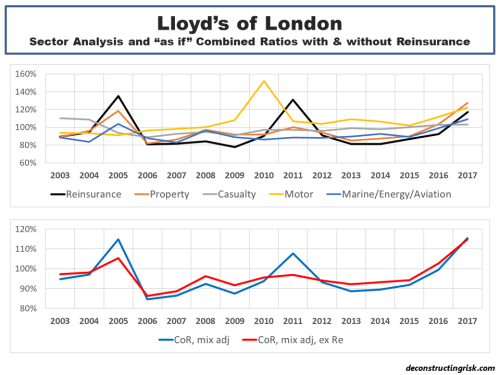
The impact extends beyond soft pricing and could impact Lloyd’s risk profile. The loss of high margin (albeit not as high as it once was) and low frequency/high severity business means that Lloyd’s will have to fish in an already crowded pond for less profitable and less volatile business. The combined ratios of Lloyd’s main business lines are shown below illustrating that all, except casualty, have had a rough 2017 amid competitive pressures and large losses.

As reinsurance business is commoditised further by ILS, in a prelude to an increase in machine/algorithm underwriting, Lloyd’s business will become less volatile and as a result less profitable. To illustrate, the lower graph below shows Lloyd’s historical weighted average combined ratio, using the 2017 business mix, versus the weighted average combined ratio excluding the reinsurance line. For 2003 to 2017, the result would be an increase in average combined ratio, from 95.8% to 96.5%, and a reduction in volatility, the standard deviation from 9.7% to 7%.

click to enlarge

To write off Lloyd’s however would be a big mistake. In my view, there remains an important role for a specialist marketplace for heterogeneous risks, where diverse underwriting expertise cannot be easily replicated by machines. Lloyd’s has shown its ability in the past to evolve and adapt, unfortunately however usually when it doesn’t have any choice. Hopefully, this legendary 330-year-old institution will get ahead of the game and dictate its own future. It will be interesting to watch.


Epilogue – Although this analogy has limitations, it occurs to me that the insurance sector is at a stage of evolution that the betting sector was at about a decade ago (my latest post on the sector is here). Traditional insurers, with over-sized expenses, operate like old traditional betting shops with paper slips and manual operations. The onset of online betting fundamentally changed the way business is transacted and, as a result, the structure of the industry. The upcoming digitalisation of the traditional insurance business will radically change the cost structure of the industry. Lloyd’s should look to the example of Betfair (see an old post on Betfair for more) as a means of digitalising the market platform and radically reducing costs.

Follow-on 28th April – Many thanks to Adam at InsuranceLinked for re-posting this post. A big welcome to new readers, I hope you will stick around and check out some other posts from this blog. I just came across this report from Oliver Wyam on the underwriter of the future that’s worth a read. They state that the “commercial and wholesale insurance marketplaces are undergoing radical change” and they “expect that today’s low-price environment will continue for the foreseeable future, continuing to put major pressure on cost“.

ILS illuminations

Insurance linked securities (ILS) are now well established in the insurance industry. ILS as an asset class offer, according to its many fans, the benefits of diversification and low correlation to other asset classes whilst offering a stable and attractive risk/reward return. The impact of the new capital on the traditional market has been profound and wide ranging (and a much posted upon topic in this blog – here, here & here for example).

ILS fund managers maintained an “aggressive posture” on price at the recent April renewals according to Willis Re as ILS capacity continues to demonstrate its cost of capital advantage. ILS fund managers are also looking to diversify, moving beyond pure short tail risks and looking at new previously uninsured or underinsured exposures, as well as looking to move their capital along the value-chain by sourcing primary risk more directly and in bulk.

An industry stalwart, John Kavanagh of Willis Re, commented that “with results on many diversifying non-catastrophe classes now marginal, there is greater pressure on reinsurers to address the pricing in these classes” and that “many reinsurers remain prepared to let their top line revenue growth stall and are opting to return excess capital to their shareholders”. The softening reinsurance market cycle is now in its fifth year and S&P estimates that “even assuming continued favourable prior-year reserve releases and benign natural catastrophe losses, we anticipate that reinsurers will barely cover their cost of capital over the next two years”.

Rather than fight the new capital on price, some traditional (re)insurers are, according to Brandan Holmes of Moody’s, “deploying third-party capital in their own capital structures in an effort to lower their blended cost of capital” and are deriving, according to Aon Benfield, “significant benefits from their ability to leverage alternative capital”. One can only fight cheap capital for so long, at some stage you just arbitrage against it (sound familiar!).

A.M. Best recently stated that “more collateralised reinsurance programs covering nonpeak exposures are ceded to the capital markets”. The precipitous growth in the private transacted collateralised reinsurance subsector can be seen in the graph from Aon below.

click to enlarge

Nick Frankland of Guy Carpenter commented that “the capital landscape is ever-changing” and that “such capital diversity also elevates the position of the broker”. Some argue that the all-powerful role of the dominant brokers is exacerbating market softness. These brokers would counterargue that they are simply fulfilling their role in an efficient market, matching buyers and sellers. As Frankland puts it, brokers are “in the strongest position to provide access to all forms of capital and so secure the more beneficial rates and terms and conditions”. Dominic Christian of Aon Benfield commented last year that “to some extent alternative sources of capital are already, and have already uberized insurance and reinsurance, by bringing increased sources of supply”.

Perhaps alone amongst industry participants, Weston Hicks of Alleghany, has questioned the golden goose of cheap ILS capital stating that “some new business models that separate the underwriting decision from the capital provider/risk bearer are, in our view, problematic because of a misalignment of incentives”. Such concerns are batted aside as old fashioned in this new world of endless possibilities. Frighteningly, John Seo of ILS fund manager Fermat Capital, suggests that “for every dollar of money that you see in the market right now, I think there is roughly 10 dollars on the sidelines waiting to come in if the market hardens”.

As an indicator of current ILS pricing, the historical market spread over expected losses in the public CAT bond market can be seen in the exhibit below with data sourced from Lane Financial. It is interesting to note that the average expected loss is increasing indicating CAT bonds are moving down the risk towers towards more working layer coverages.

click to enlarge

In a previous post, I argued that returns from an ILS fund index, with the net returns judgementally adjusted to get to comparable figures gross of management fees, were diverging against those from a pure CAT bond index. I argued that this divergence may illustrate that the ILS funds with exposure to the private collateralised reinsurance sector may be taking on higher risk exposures to pump returns (or may be passing risks amongst themselves in an embryonic spiral) and that ILS investors should be careful they understand the detail behind the risk profiles of the ILS funds they invest in.

Well, the final 2016 figures, as per the graph below, show that the returns in my analysis have in fact converged rather than diverged. On the face of it, this rubbishes my argument and I have to take that criticism on. Stubbornly, I could counter-argue that the ILS data used in the comparison may not reflect the returns of ILS funds with large exposure to collateralised reinsurance deals. Absent actual catastrophic events testing the range of current fund models, better data sources are needed to argue the point further.

click to enlarge

In their annual review of 2016, Lane Financial have an interesting piece on reducing transparency across both the public and private ILS sector. They characterise the private collateralised reinsurance sector as akin to a dark pool compared to the public CAT bond market which they likened to a lit exchange. Decreased transparency across the ILS sector “should send up warning flags” for all market participants as it makes calculating Net Asset Valuations (NAV) with monthly or quarterly frequency more difficult. They argue that the increased use of a relatively smaller public CAT bond market for pricing points across the ILS sector, the less credible is the overall valuation. This is another way of expressing my concern that the collateralised reinsurance market could be destabilising as it is hidden (and unregulated).

In the past, as per this post, I have questioned how the fully funded ILS market can claim to have a lower cost of capital against rated reinsurers who only have to hold capital against a percentage of their exposed limit, akin to fractional banking (see this post for more on that topic). The response is always down to the uncorrelated nature of ILS to other asset classes and therefore its attraction to investors such as pension funds who can apply a low cost of capital to the investment due to its uncorrelated and diversifying portfolio benefits. Market sponsors of ILS often use graphs such as the one below from the latest Swiss Re report to extoll the benefits of the asset class.

click to enlarge

A similar exhibit, this time from a Lombard Odier brochure, from 2016 shows ILS in an even more favourable light!

click to enlarge

As anybody who has looked through any fund marketing metrics knows, performance comparisons with other investment strategies are fraught with bias and generally postdictive. The period over which the comparison is made and the exact indices chosen (look at the differing equity indices used in the comparisons above) can make material differences. Also, the size and liquidity of a market is important, a point which may negate any reliance on ILS returns prior to 2007 for example.

I thought an interesting exercise would be to compare actual historical ILS returns, as represented by the Swiss Re Global Cat Bond Total Return Index, against total returns (i.e. share price annual change plus dividends paid in year) from equity investment in reinsurers across different time periods. The most applicable business model for comparison would be pure property catastrophe reinsurers but unfortunately there are not many of them left.

I have chosen RenRe (RNR) and Validus (VR), from 2007, as representatives of the pure property cat business model, although both have diversified their portfolios away from pure short tail business in recent years. I also selected three of the biggest European reinsurers – Munch Re, Swiss Re and Hannover Re – all of which are large diverse composite reinsurers. Finally, I constructed a US$ portfolio using equal shares of each of the five firms mentioned above (RenRe represents 40% of the portfolio until 2007 when Validus went public) with the € and CHF shares converted at each year end into dollars.

The construction of any such portfolio is postdictive and likely suffers from multiple biases. Selecting successful firms like RenRe and Validus could validly be criticised under survival bias. To counter such criticism, I would point out that the inclusion of the European reinsurers is a considerable historic drag on returns given their diverse composite footprint (and associated correlation to the market) and the exclusion of any specialist CAT firm that has been bought out in recent years, generally at a good premium, also drags down returns.

The comparison over the past 15 years, see graph below, shows that Munich and Swiss struggle to get over their losses from 2002 and 2003 and during the financial crisis. Hannover is the clear winner amongst the Europeans. The strong performance of Hannover, RenRe and Validus mean that the US$ portfolio matches the CAT bond performance after the first 10 years, albeit on a more volatile basis, before moving ahead on a cumulative basis in the last 5 years. The 15-year cumulative return is 217% for the CAT bond index and 377% return for the US$ equity portfolio.

click to enlarge

The comparison over the past 10 years, see graph below, is intriguing. Except for Validus, the CAT bond index beats all other firms and the US$ portfolio for non-volatile returns hands down in the first 5 years. Hannover, Validus and the portfolio each make a strong comeback in the most recent 5 years. The 10-year cumulative return is 125% for the CAT bond index and 189% return for the US$ equity portfolio.

click to enlarge

The comparison over the past 5 years, see graph below, shows that all firms and the portfolio handily beats the CAT bond index. Due to an absence in large loss activity over the recent past and much more shareholder friendly actions by all reinsurers, the equity returns have been steady and non-volatile. The 5-year cumulative return is 46% for the CAT bond index and 122% return for the US$ equity portfolio.

click to enlarge

Overall then, ILS may offer less volatile and uncorrelated returns but I would personally prefer the, often lumpier, historical equity returns from a selected portfolio of top reinsurers in my pension pot (we all could have both in our pension funds!). Then again, the influx of new capital into ILS has put the future viability of the traditional reinsurance business models into question so future equity returns from the sector may not be too rosy.

At the end of the day, the bottom line is whether current market risk premia is adequate, irrespective of being supplied by ILS fund managers or traditional reinsurers. Based upon what I see, I have grave misgivings about current market pricing and therefore have no financial exposure, ILS or equity or otherwise, to the market at present.

Additional Comment, 29th April 2017: The ILS website Artemis.bm had an interesting piece on comments from Torsten Jeworrek of Munich Re during their March conference call. The applicable comment is as follows:

“And now I give you another example, which is not innovation per se or not digitalization, but you know that more and more alternative capital came into the insurance industry over the last years; hedge funds, pension refunds, participating particularly in the cat business and as a trend that not all of the limits they provide, cat limits are fully collateralized anymore. That means there are 10 scenarios; hurricane, earthquake, [indiscernible], and so on; which are put together, but not 10 times the limit is collateralized, let’s say only 4 times, 5 times.

That means these hedge funds and pension funds so to speak in the future if they don’t have to provide full 100% collateralized for all the limits they provide, they need a certain credit risk for the buyer. The more they entertain, the more there’s a likelihood that this reinsurance can also fail. The question is how far will that go and this kind of not fully collateralized reinsurance, will that be then accepted as a reinsurance by the regulator or will that be penalized at a certain time otherwise we don’t have level playing field anymore, which means the traditional reinsurer who was strongly monitored and regulated and also reported as really expensive and a burden for our industry and for us and on the other hand, you have very lean pension and hedge funds who even don’t have to provide the same amount of capital for the same risk.”