Tag Archives: Validus

AIG: Better Days

It’s been 2 years since I posted on AIG and it has been an eventful 2 years. A new management team (again) has been installed, led by industry veteran Brian Duperreault, to try to turn this stubborn ship around. The results, as below, show the scale of the task. Reduced investment returns, reducing legacy and asset balances, and poor reinsurance protections are just a few of the reasons behind the results, in addition to the obvious poor underwriting results.

click to enlarge

Oversize risks from the previous Go Large strategy have been disastrous for both the catastrophic losses and reserve strengthening on the commercial P&C business, as the results below show. Duperreault and his team have been busy working on refocusing the underwriting philosophy, modernizing systems and analytics, bringing in talent (including buying Validus), redesigning reinsurance protections and reshaping the portfolio.

click to enlarge

In their latest quarterly call, the new management team is boldly predicting an underwriting profit on the general insurance business (commercial and consumer) in 2019, assuming a catastrophe load of less than 5% and reductions in loss and expense ratios, which will require a +10% improvement in the 2018 result. In a sector where competitors have long since evolved (some use AI to optimise their portfolios and returns) and the alchemy of low return capital providers is ever present, they have set themselves an aggressive target.

click to enlarge

Given the current share price just below $42, its trading around 76% of the adjusted book value. If all things go well, and some recent headwinds (e.g. reserve strengthening) are tamed, I can see how a pre-tax income target of $3.5 billion to $4 billion and an adjusted income diluted EPS of $4.00 to $4.50 is achievable. These targets are roughly where analysts are for 2019, returning to EPS results achieved over 5 years ago. I concur on the targets but think the time-frame may be optimistic, another year of clean-up looks more likely.

It will be interesting to see how the year progresses.

Insurance M&A Pickup

It’s been a while since I posted on the specialty insurance sector and I hope to post some more detailed thoughts and analysis when I get the time in the coming months. M&A activity has picked up recently with the XL/AXA and AIG/Validus deals being the latest examples of big insurers bulking up through M&A. Deloitte has an interesting report out on some of the factors behind the increased activity. The graph below shows the trend of the average price to book M&A multiples for P&C insurers.

click to enlarge

As regular readers will know, my preferred metric is price to tangible book value and the exhibit below shows that the multiples on recent deals are increasing and well above the standard multiple around 1.5X. That said, the prices are not as high as the silly prices of above 2X paid by Japanese insurers in 2015. Not yet anyway!

click to enlarge

Unless there are major synergies, either on the operating side or on the capital side (which seems to be AXA’s justification for the near 2X multiple on the XL deal), I just can’t see how a 2X multiple is justified in a mature sector. Assuming these firms can earn a 10% return on tangible assets over multiple cycles, a 2X multiple equates to 20X earnings!

Time will tell who the next M&A target will be….

ILS illuminations

Insurance linked securities (ILS) are now well established in the insurance industry. ILS as an asset class offer, according to its many fans, the benefits of diversification and low correlation to other asset classes whilst offering a stable and attractive risk/reward return. The impact of the new capital on the traditional market has been profound and wide ranging (and a much posted upon topic in this blog – here, here & here for example).

ILS fund managers maintained an “aggressive posture” on price at the recent April renewals according to Willis Re as ILS capacity continues to demonstrate its cost of capital advantage. ILS fund managers are also looking to diversify, moving beyond pure short tail risks and looking at new previously uninsured or underinsured exposures, as well as looking to move their capital along the value-chain by sourcing primary risk more directly and in bulk.

An industry stalwart, John Kavanagh of Willis Re, commented that “with results on many diversifying non-catastrophe classes now marginal, there is greater pressure on reinsurers to address the pricing in these classes” and that “many reinsurers remain prepared to let their top line revenue growth stall and are opting to return excess capital to their shareholders”. The softening reinsurance market cycle is now in its fifth year and S&P estimates that “even assuming continued favourable prior-year reserve releases and benign natural catastrophe losses, we anticipate that reinsurers will barely cover their cost of capital over the next two years”.

Rather than fight the new capital on price, some traditional (re)insurers are, according to Brandan Holmes of Moody’s, “deploying third-party capital in their own capital structures in an effort to lower their blended cost of capital” and are deriving, according to Aon Benfield, “significant benefits from their ability to leverage alternative capital”. One can only fight cheap capital for so long, at some stage you just arbitrage against it (sound familiar!).

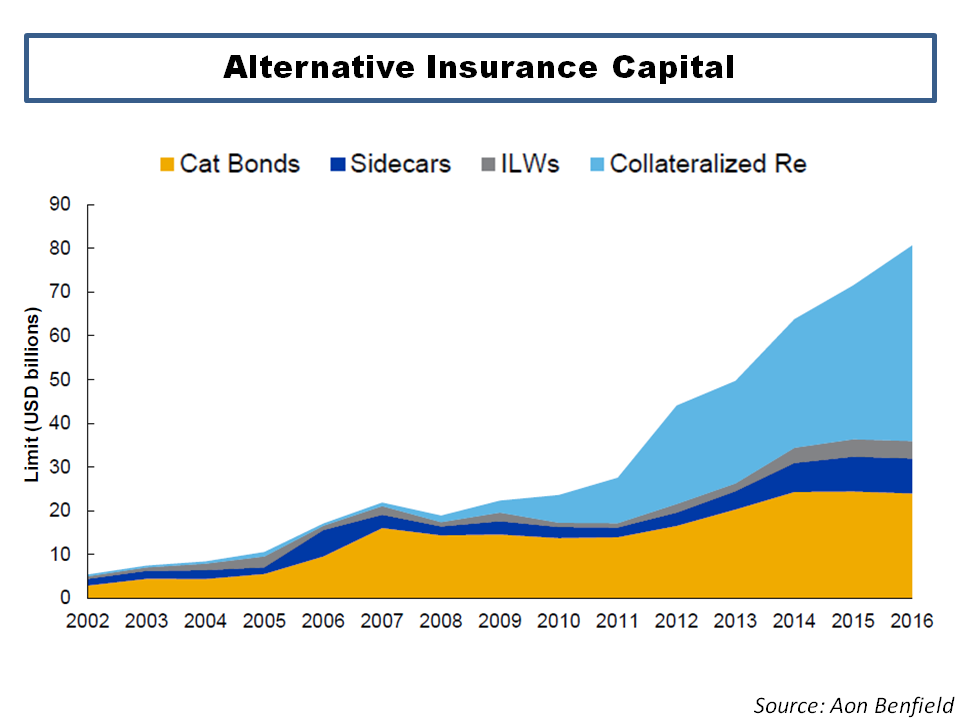
A.M. Best recently stated that “more collateralised reinsurance programs covering nonpeak exposures are ceded to the capital markets”. The precipitous growth in the private transacted collateralised reinsurance subsector can be seen in the graph from Aon below.

click to enlarge

Nick Frankland of Guy Carpenter commented that “the capital landscape is ever-changing” and that “such capital diversity also elevates the position of the broker”. Some argue that the all-powerful role of the dominant brokers is exacerbating market softness. These brokers would counterargue that they are simply fulfilling their role in an efficient market, matching buyers and sellers. As Frankland puts it, brokers are “in the strongest position to provide access to all forms of capital and so secure the more beneficial rates and terms and conditions”. Dominic Christian of Aon Benfield commented last year that “to some extent alternative sources of capital are already, and have already uberized insurance and reinsurance, by bringing increased sources of supply”.

Perhaps alone amongst industry participants, Weston Hicks of Alleghany, has questioned the golden goose of cheap ILS capital stating that “some new business models that separate the underwriting decision from the capital provider/risk bearer are, in our view, problematic because of a misalignment of incentives”. Such concerns are batted aside as old fashioned in this new world of endless possibilities. Frighteningly, John Seo of ILS fund manager Fermat Capital, suggests that “for every dollar of money that you see in the market right now, I think there is roughly 10 dollars on the sidelines waiting to come in if the market hardens”.

As an indicator of current ILS pricing, the historical market spread over expected losses in the public CAT bond market can be seen in the exhibit below with data sourced from Lane Financial. It is interesting to note that the average expected loss is increasing indicating CAT bonds are moving down the risk towers towards more working layer coverages.

click to enlarge

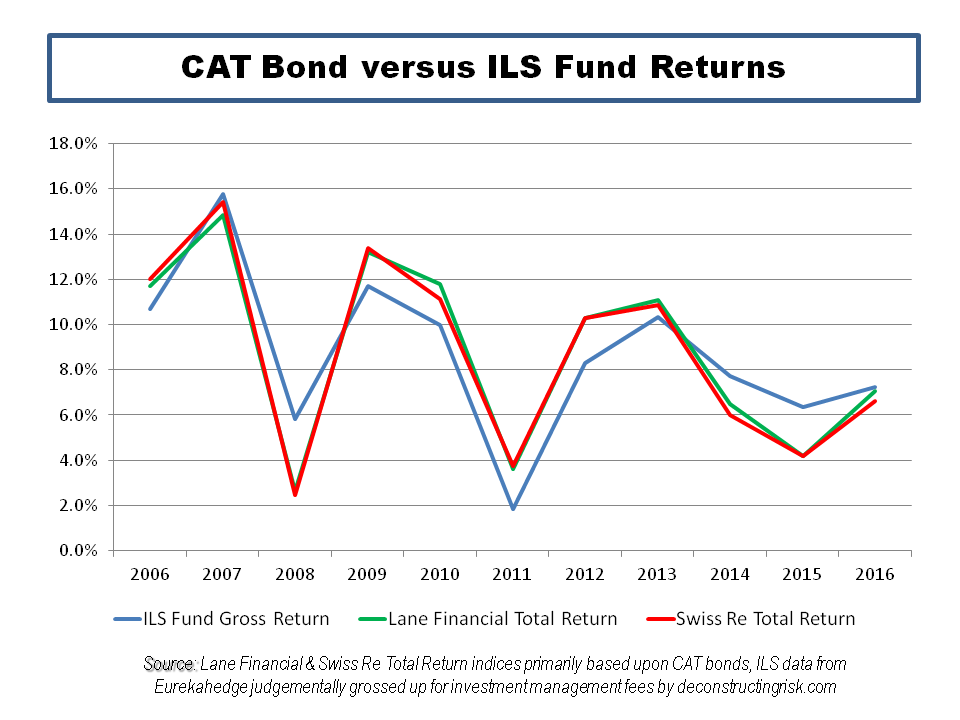
In a previous post, I argued that returns from an ILS fund index, with the net returns judgementally adjusted to get to comparable figures gross of management fees, were diverging against those from a pure CAT bond index. I argued that this divergence may illustrate that the ILS funds with exposure to the private collateralised reinsurance sector may be taking on higher risk exposures to pump returns (or may be passing risks amongst themselves in an embryonic spiral) and that ILS investors should be careful they understand the detail behind the risk profiles of the ILS funds they invest in.

Well, the final 2016 figures, as per the graph below, show that the returns in my analysis have in fact converged rather than diverged. On the face of it, this rubbishes my argument and I have to take that criticism on. Stubbornly, I could counter-argue that the ILS data used in the comparison may not reflect the returns of ILS funds with large exposure to collateralised reinsurance deals. Absent actual catastrophic events testing the range of current fund models, better data sources are needed to argue the point further.

click to enlarge

In their annual review of 2016, Lane Financial have an interesting piece on reducing transparency across both the public and private ILS sector. They characterise the private collateralised reinsurance sector as akin to a dark pool compared to the public CAT bond market which they likened to a lit exchange. Decreased transparency across the ILS sector “should send up warning flags” for all market participants as it makes calculating Net Asset Valuations (NAV) with monthly or quarterly frequency more difficult. They argue that the increased use of a relatively smaller public CAT bond market for pricing points across the ILS sector, the less credible is the overall valuation. This is another way of expressing my concern that the collateralised reinsurance market could be destabilising as it is hidden (and unregulated).

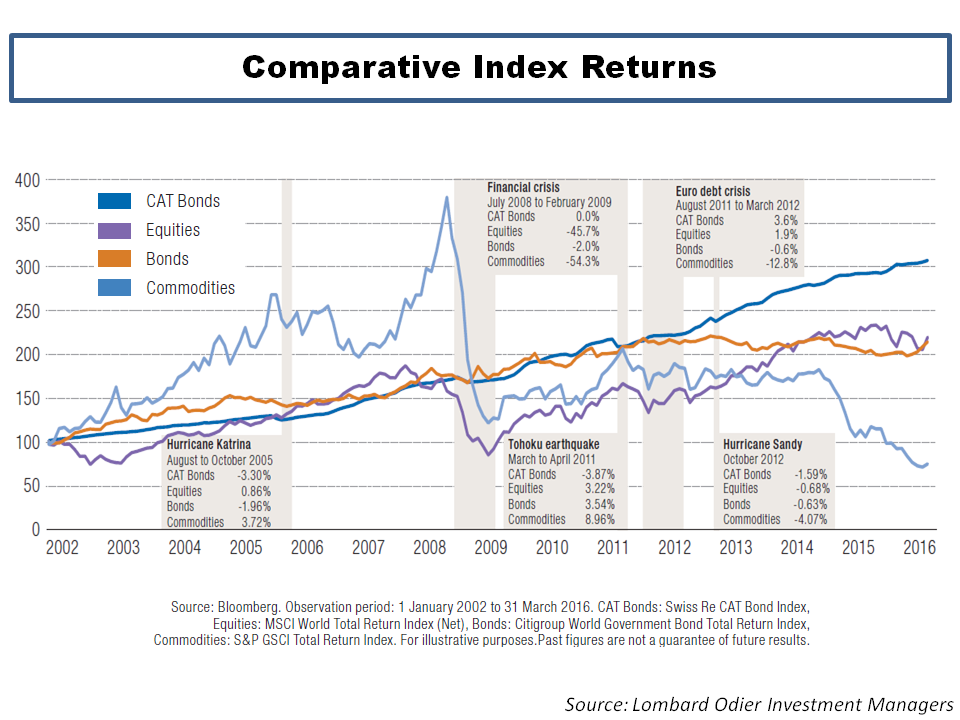
In the past, as per this post, I have questioned how the fully funded ILS market can claim to have a lower cost of capital against rated reinsurers who only have to hold capital against a percentage of their exposed limit, akin to fractional banking (see this post for more on that topic). The response is always down to the uncorrelated nature of ILS to other asset classes and therefore its attraction to investors such as pension funds who can apply a low cost of capital to the investment due to its uncorrelated and diversifying portfolio benefits. Market sponsors of ILS often use graphs such as the one below from the latest Swiss Re report to extoll the benefits of the asset class.

click to enlarge

A similar exhibit, this time from a Lombard Odier brochure, from 2016 shows ILS in an even more favourable light!

click to enlarge

As anybody who has looked through any fund marketing metrics knows, performance comparisons with other investment strategies are fraught with bias and generally postdictive. The period over which the comparison is made and the exact indices chosen (look at the differing equity indices used in the comparisons above) can make material differences. Also, the size and liquidity of a market is important, a point which may negate any reliance on ILS returns prior to 2007 for example.

I thought an interesting exercise would be to compare actual historical ILS returns, as represented by the Swiss Re Global Cat Bond Total Return Index, against total returns (i.e. share price annual change plus dividends paid in year) from equity investment in reinsurers across different time periods. The most applicable business model for comparison would be pure property catastrophe reinsurers but unfortunately there are not many of them left.

I have chosen RenRe (RNR) and Validus (VR), from 2007, as representatives of the pure property cat business model, although both have diversified their portfolios away from pure short tail business in recent years. I also selected three of the biggest European reinsurers – Munch Re, Swiss Re and Hannover Re – all of which are large diverse composite reinsurers. Finally, I constructed a US$ portfolio using equal shares of each of the five firms mentioned above (RenRe represents 40% of the portfolio until 2007 when Validus went public) with the € and CHF shares converted at each year end into dollars.

The construction of any such portfolio is postdictive and likely suffers from multiple biases. Selecting successful firms like RenRe and Validus could validly be criticised under survival bias. To counter such criticism, I would point out that the inclusion of the European reinsurers is a considerable historic drag on returns given their diverse composite footprint (and associated correlation to the market) and the exclusion of any specialist CAT firm that has been bought out in recent years, generally at a good premium, also drags down returns.

The comparison over the past 15 years, see graph below, shows that Munich and Swiss struggle to get over their losses from 2002 and 2003 and during the financial crisis. Hannover is the clear winner amongst the Europeans. The strong performance of Hannover, RenRe and Validus mean that the US$ portfolio matches the CAT bond performance after the first 10 years, albeit on a more volatile basis, before moving ahead on a cumulative basis in the last 5 years. The 15-year cumulative return is 217% for the CAT bond index and 377% return for the US$ equity portfolio.

click to enlarge

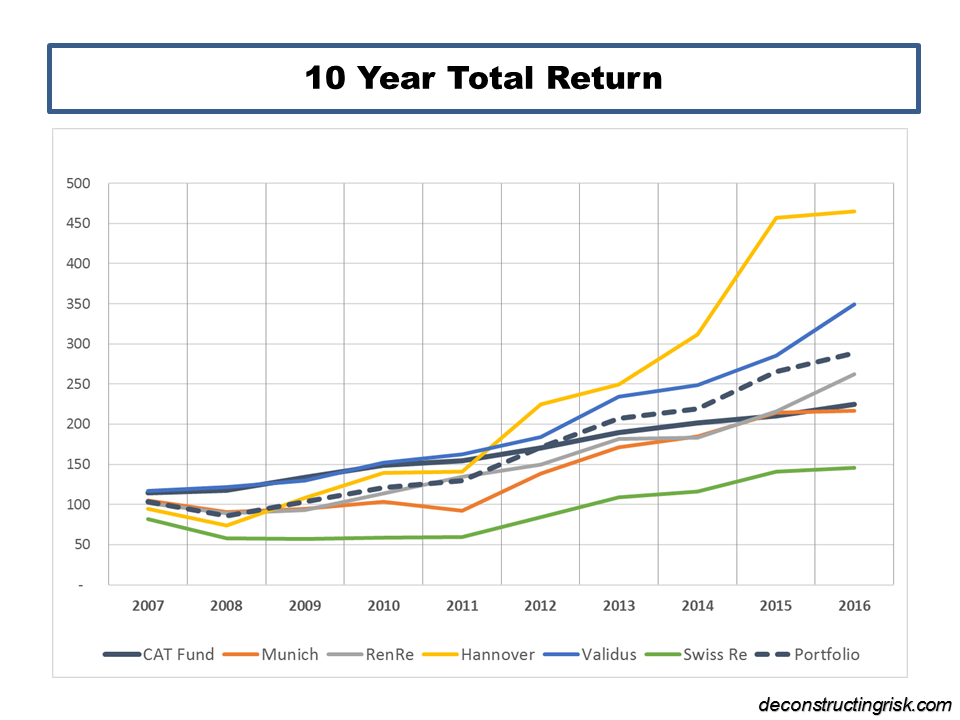
The comparison over the past 10 years, see graph below, is intriguing. Except for Validus, the CAT bond index beats all other firms and the US$ portfolio for non-volatile returns hands down in the first 5 years. Hannover, Validus and the portfolio each make a strong comeback in the most recent 5 years. The 10-year cumulative return is 125% for the CAT bond index and 189% return for the US$ equity portfolio.

click to enlarge

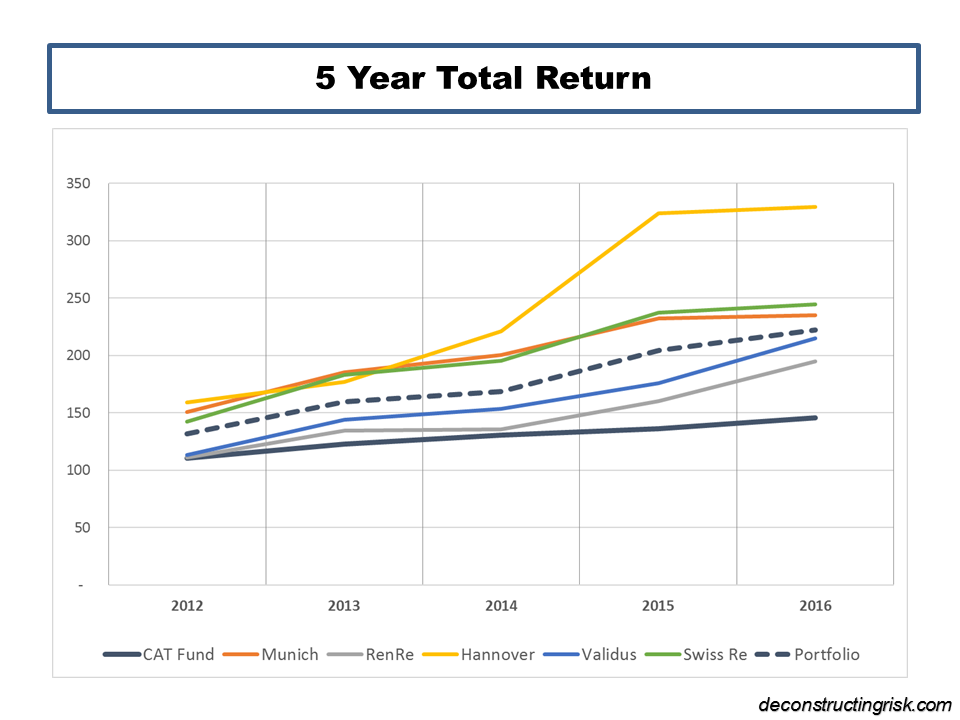
The comparison over the past 5 years, see graph below, shows that all firms and the portfolio handily beats the CAT bond index. Due to an absence in large loss activity over the recent past and much more shareholder friendly actions by all reinsurers, the equity returns have been steady and non-volatile. The 5-year cumulative return is 46% for the CAT bond index and 122% return for the US$ equity portfolio.

click to enlarge

Overall then, ILS may offer less volatile and uncorrelated returns but I would personally prefer the, often lumpier, historical equity returns from a selected portfolio of top reinsurers in my pension pot (we all could have both in our pension funds!). Then again, the influx of new capital into ILS has put the future viability of the traditional reinsurance business models into question so future equity returns from the sector may not be too rosy.

At the end of the day, the bottom line is whether current market risk premia is adequate, irrespective of being supplied by ILS fund managers or traditional reinsurers. Based upon what I see, I have grave misgivings about current market pricing and therefore have no financial exposure, ILS or equity or otherwise, to the market at present.

Additional Comment, 29th April 2017: The ILS website Artemis.bm had an interesting piece on comments from Torsten Jeworrek of Munich Re during their March conference call. The applicable comment is as follows:

“And now I give you another example, which is not innovation per se or not digitalization, but you know that more and more alternative capital came into the insurance industry over the last years; hedge funds, pension refunds, participating particularly in the cat business and as a trend that not all of the limits they provide, cat limits are fully collateralized anymore. That means there are 10 scenarios; hurricane, earthquake, [indiscernible], and so on; which are put together, but not 10 times the limit is collateralized, let’s say only 4 times, 5 times.

That means these hedge funds and pension funds so to speak in the future if they don’t have to provide full 100% collateralized for all the limits they provide, they need a certain credit risk for the buyer. The more they entertain, the more there’s a likelihood that this reinsurance can also fail. The question is how far will that go and this kind of not fully collateralized reinsurance, will that be then accepted as a reinsurance by the regulator or will that be penalized at a certain time otherwise we don’t have level playing field anymore, which means the traditional reinsurer who was strongly monitored and regulated and also reported as really expensive and a burden for our industry and for us and on the other hand, you have very lean pension and hedge funds who even don’t have to provide the same amount of capital for the same risk.”

Lessons from Lloyds

There is little doubt that the financial services industry is currently facing many challenges and undergoing a generational change. The US economist Thomas Philippon opined that the finance industry over-expansion in the US means that it’s share of GDP is about 2 percentage points higher than it needs to be although he has also estimated that the unit cost of intermediation hasn’t changed significantly in recent years, despite advances in technology and the regulatory assaults upon the industry following the financial crisis.

The insurance sector has its own share of issues. Ongoing low interest rates and inflation, broader low risk premia across the capital markets, rapid technology changes such as big data and the onset of real time underwriting are just the obvious items. The Economist had an article in March that highlighted the prospective impact of data monitoring and technology on the underwriting of motor and health risks. This is another interesting post on a number of the new peer to peer business models such as Friendsurance, Bought by Many, and Guevara who are trying to disrupt the insurance sector. There can be little doubt that the insurance industry, just like other financial sectors, will be impacted by such secular trends.

However, this post is primarily focused on the short to medium term outlook for the specialty insurance and reinsurance sector. I have been asked a few of times by readers to outline what I think the next few years may look like for this sector. My views of the current market were nicely articulated by Alex Maloney, the Group CEO of Lancashire, who commented in their recent quarterly results statement as follows:

“The year to date has seen a flurry of activity on the M&A front within the industry, much of this, in my view, is driven by the need to rationalise and refocus oversized and over stretched businesses. We also continue to see a bout of initiatives and innovations in the market, the sustainability and longer term viability of which are questionable. These are symptoms of where we are in the cycle. We have seen these types of trends before and in all likelihood, will see them again.”

Lloyds of London has had a colourful past and many of its historical issues are specific to it and reflective of its own eccentric ways. However, as a proxy for the global specialty sector, particularly over the past 20 years, it provides some interesting context on the trends we find ourselves in today. Using data from Lloyds with some added flavour from my experiences, the graphic below shows the dramatic history of the market since 1950.

click to enlargeLloyds Historical Results 1950 to 2015

The impact of Hurricane Betsy in 1965 upon Lloyds illustrated a number of the fault-lines in the structure of Lloyds with the subsequent Cromer report warning on the future danger of unequal treatment between insiders (aka working Names) and “dumb” capital providers (aka all other Names). The rapid influx of such ill informed capital in the late 1970s and the 1980s laid the seeds of the market’s near destruction largely due to the tsunami of US liability claims resulting from asbestos and pollution exposures in the 1980s. These losses were exacerbated by the way Lloyds closed underwriting years to future capital providers through vastly underpriced reinsurance to close transactions and the practice of the incestuous placement of excess of loss retrocession for catastrophe losses within the market, otherwise known as the London Market Excess of Loss (LMX) spiral. There is a clever article by Joy Schwartzman from 2008 on the similarity between the LMX spiral and the financial risk transformational illusions that featured heavily in the financial crisis. Indeed, the losses from the sloppy “occurrence” liability insurance policy wordings and the tragedy of unheeded asbestos risks continued to escalate well into the 1990s, as the exhibit below from a 2013 Towers Watson update illustrates.

click to enlargeTowers Watson Asbestos Claims US P&C Insurers

What happened in Lloyds after the market settlement with Names and the creation of the “bad bank” Equitas for the 1992 and prior losses is where the lessons of Lloyds are most applicable to the market today. The graphic below shows the geographical and business split of Lloyds over the past 20 years, showing that although the underlying risk and geographical mix has changed it remains a diversified global business.

click to enlargeLloyds of London Historical Geographical & Sector Split

Released from the burden of the past after the creation of Equitas, the market quickly went on what can only be described as an orgy of indiscipline. The pricing competition was brutal in the last half of the 1990s with terms and conditions dramatically widened. Rating indices published by the market, as below, at the time show the extent of the rate decreases although the now abandoned underwriting indices published at the same time spectacularly failed to show the impact of the loosening of T&Cs.

click to enlargeLloyds of London Rating Indices 1992 to 1999

As Lloyds moved from their historical three year accounting basis in the 2000s it’s difficult to compare historical ratios from the 1990s. Notwithstanding this, I did made an attempt to reconcile combined ratios from the 1990s in the exhibit below which clearly illustrates the impact market conditions had on underwriting results.

click to enlargeLloyds of London historical combined ratio breakdown

The Franchise Board established in 2003, under the leadership of the forthright and highly effective Rolf Tolle, was created to enforce market discipline in Lloyds after the disastrous 1990s. The combined ratios from recent years illustrate the impact it has had on results although the hard market after 9/11 provided much of the impetus. The real test of the Franchise Board will be outcome of the current soft market. The rating indices published by Amlin, as below, show where rates are currently compared to the rates in 2002 (which were pushed up to a level following 2001 to recover most of the 1990s fall-off). Rating indices published by Lancashire also confirm rate decreases of 20%+ since 2012 in lines like US property catastrophe, energy and aviation.

click to enlargeLloyds of London Rating Indices 2002 to 2015

The macro-economic environment and benign claims inflation over the past several years has clearly helped loss ratios. A breakdown of the recent reserve releases, as below, show that reinsurance and property remain important sources of releases (the reinsurance releases are also heavily dependent on property lines).

click to enlargeLloyds of London Reserve Release Breakdown 2004 to 2014

Better discipline and risk management have clearly played their part in the 10 year average ROE of 15% (covering 2005 to 2014 with the 2005 and 2011 catastrophe years included). The increasing overhead expenses are an issue for Lloyds, recently causing Ed Noonan of Validus to comment:

“We think that Lloyd’s remains an outstanding market for specialty business and their thrust towards international diversification is spot on from a strategic perspective. However, the costs associated with Lloyd’s and the excessive regulation in the UK are becoming significant issues, as is the amount of management and Board time spent on compliance well beyond what’s necessary to ensure a solvent and properly functioning market. Ultimately, this smothering regulatory blanket will drive business out of Lloyd’s and further the trend of placement in local markets.”

So what does all of this tell us about the next few years? Pricing and relaxed terms and conditions will inevitably have an impact, reserve releases will dry up particularly from reinsurance and property, investment returns may improve and claim inflation may increase but neither materially so, firms will focus on expense reduction whilst dealing with more intrusive regulation, and the recent run of low catastrophic losses will not last. ROEs of low double digits or high single digits does not, in my view, compensate for these risks. Longer term the market faces structural changes, in the interim it faces a struggle to deliver a sensible risk adjusted return.

Arthur opens the US Hurricane Season

After Hurricane Arthur briefly made landfall in North Carolina on Thursday night, a weakened storm is now heading north. I thought this would be good time to have a look at the probable maximum losses (PMLs) published as at the Q1 2014 results by a sample of specialist (re)insurers, first presented in a post in June 2013. That post went into some detail on the uncertainties surrounding the published PMLs and should be read as relevant background to the figures presented here.

Despite predictions of an above average 2013 Atlantic hurricane season, the number of named hurricanes was the lowest since 1982. Predictions for the 2014 season are for a below average number of hurricanes primarily due to cooler sea temperatures in the Atlantic due to the transition to El Niño (although that is now thought to be slower than previously anticipated). The graph below includes the 2014 predictions.

click to enlargeHistorical Atlantic Storms & Hurricanes I like to look at PMLs as a percentage of net tangible assets (NTA) on a consistent basis across firms to assess exposures from a common equity viewpoint. Many firms include subordinated debt or other forms of hybrid debt in capital when showing their PMLS. For example, Lancashire has approximately $330 million of sub-debt which they include in their capital figures and I have show the difference with and without the sub-debt in the percentages for Lancashire in the graph below on US wind PMLs to illustrate the comparison.

Whether hybrid debt comes in before equity or alongside equity depends upon the exact terms and conditions. The detail of such instruments will determine whether such debt is classified as tier 1, 2 or 3 capital for regulatory purposes under Solvency II (although there are generous transitional timeframes of up to 10 years for existing instruments). The devil is often in the detail and that is another reason why I prefer to exclude them and use a consistent NTA basis.

As per the June 2013 post, firms often classify their US wind exposures by zone but I have taken the highest exposures for each (which may not necessarily be the same zone for each firm).

click to enlargeUS Wind PMLs Q1 2014 These exposures, although expressed as percentages of NTAs, should be considered net of potential profits made for 2014 to assess the real impact upon equity (provided, of course, that the expected profits don’t all come from property catastrophe lines!). If for example we assume a 10% return on NTA across each firm, then the figures above have to be adjusted.

Another issue, also discussed in the previous post, is the return period for similar events that each firms present. For example, the London market firms present Lloyds’ realistic disaster scenarios (RDS) as their PMLs. One such RDS is a repeat of the 1926 Miami hurricane which is predicted to cost $125 billion for the industry if it happened today. For the graph above, I have assumed a 1 in 200 return period for this scenario. The US & Bermudian firms do not present scenarios but points on their occurrence exceedance probability (OEP) curves.

As it is always earthquake season, I also include the PMLs for a California earthquake as per the graph below.

click to enlargeCalifornia EQ PMLs Q1 2014 In terms of current market conditions, the mid-year broker reports are boringly predictable. John Cavanagh, the CEO of Willis Re, commented in their report that “the tentacles of the softening market are spreading far and wide, with no immediate signs of relief. We’ve seen muted demand throughout 2014 and market dynamics are unlikely to change for some time to come. The current market position is increasingly challenging for reinsurers.” Aon Benfield, in their report, stated that “the lowest reinsurance risk margins in a generation stimulate new growth opportunities for insurers and may allow governments to reduce their participation in catastrophe exposed regions as insurance availability and affordability improves”. When people start talking about low pricing leading to new opportunities to take risk, I can but smile. That’s what they said during the last soft market, and the one before that!

Some commentators are making much of the recent withdrawal of the latest Munich Re bond on pricing concerns as an indicator that property catastrophe prices have reached a floor and that the market is reasserting discipline. That may be so but reaching a floor below the technical loss cost level sounds hollow to me when talking about underwriting discipline.

To finish, I have reproducing the graph on Flagstone Re from the June 2013 post as it speaks a thousand words about the dangers of relying too much on the published PMLs. Published PMLs are, after all, only indicators of losses from single events and, by their nature, reflect current (group) thinking from widely used risk management tools.

click to enlargeFlagstone CAT losses Follow-on: It occurred to me after posting that I could compare the PMLs for the selected firms as at Q1 2014 against those from Q1 2013 and the graph below shows the comparison. It does indicate that many firms have taken advantage of cheap reinsurance/retrocession and reduced their net profiles, as highlighted in this post on arbitrage opportunities. Some firms have gone through mergers or business model changes. Endurance, for example, has been changed radically by John Charman (as well as being an aggressive buyer of coverage). Lancashire is one of the only firms whose risk profile has increased using the NTA metric as a result of the Cathedral acquisition and the increase in goodwill.

click to enlargeUS Wind PMLs Q1 2013 vrs 2014