Tag Archives: probable maximum losses

CAT Calls

Following on from a recent post on windstorms in the US, I have taken several loss preliminary estimates recently published by firms (and these are very early estimates and therefore subject to change) and overlaid them against the South-East US probable maximum loss (PML) curves and Atlantic hurricane scenarios previously presented, as below. The range of insured losses for Harvey, Irma and Maria (now referred to as HIM) are from $70 billion to $115 billion, averaging around $90 billion.

click to enlarge

The loss estimates by firm depend heavily upon the risk profile of each. As a generalisation, it could be said that the aggregate US wind losses are averaging around the 1 in 100 loss level.

Given there was over $20 billion of insured losses from H1 and factoring in developing losses such as the Mexico earthquake, the California wildfires and the current windstorm Ophelia hitting Ireland, annual insured losses for 2017 could easily reach $120 billion. The graph below shows the 2016 estimates from Swiss Re and my $120 billion 2017 guesstimate (it goes without saying that much could still happen for the remainder of the year).

click to enlarge

At a $120 billion level of insured loss for 2017, the 10 year average increase from around $55 billion to $65 billion. In a post in early 2016, I estimated that catastrophe pricing was about 25% too low based upon annual average losses of $40 billion per year. We will see whether the 2017 losses are enough to deplete the overcapitalisation in the market and return pricing towards their technical rate. I wouldn’t hold my breath on that as although there may be material aggregate losses in the private collateralised market and other pockets of the retrocession market, the appetite of yield seeking investors will likely remain unabated in the current interest rate environment.

Although the comparison between calendar year ratios and credit defaults is fraught with credibility issues (developed accident year ratios to developed default rates are arguably more comparable), I updated my previous underwriting cycle analysis (here in 2014 and here in 2013). Taking the calendar year net loss ratios of Munich Re and Lloyds of London excluding catastrophe and large losses (H1 results for 2017), I then applied a crude discount measure using historical risk-free rates plus 100 basis points to reflect the time value of money, and called the resulting metric the adjusted loss ratio (adjusted LR). I compared these adjusted LRs for Munich and Lloyds to S&P global bond credit default rates (by year of origin), as per the graph below.

click to enlarge

This shows that the years of relatively benign attritional claims together with the compounding impact of soft pricing over the past years may finally be coming to an end. Time will tell. All in all, it makes for a very interesting period for the market over the next 6 to 12 months.

In the interim, let’s hope for minimal human damage from the current California wildfires and windstorm Ophelia.

The Big Wind

With four US hurricanes and one earthquake in current times, mother nature is reminding us homo-sapiens of her power and her unpredictability. As the massive Hurricane Irma is about to hit Florida, we all hope that the loss of life and damage to people’s lives will be minimal and that the coming days will prove humane. Forgive me if it comes across as insensitive to be posting now on the likely impact of such events on the insurance industry.

For the insurance sector, these events, and particularly Hurricane Irma which is now forecast to move up the west coast of Florida at strength (rather the more destruction path of up the middle of Florida given the maximum forces at the top right-hand side of a hurricane like this one), may be a test on the predictive powers of its models which are so critical to pricing, particularly in the insurance linked securities (ILS) market.

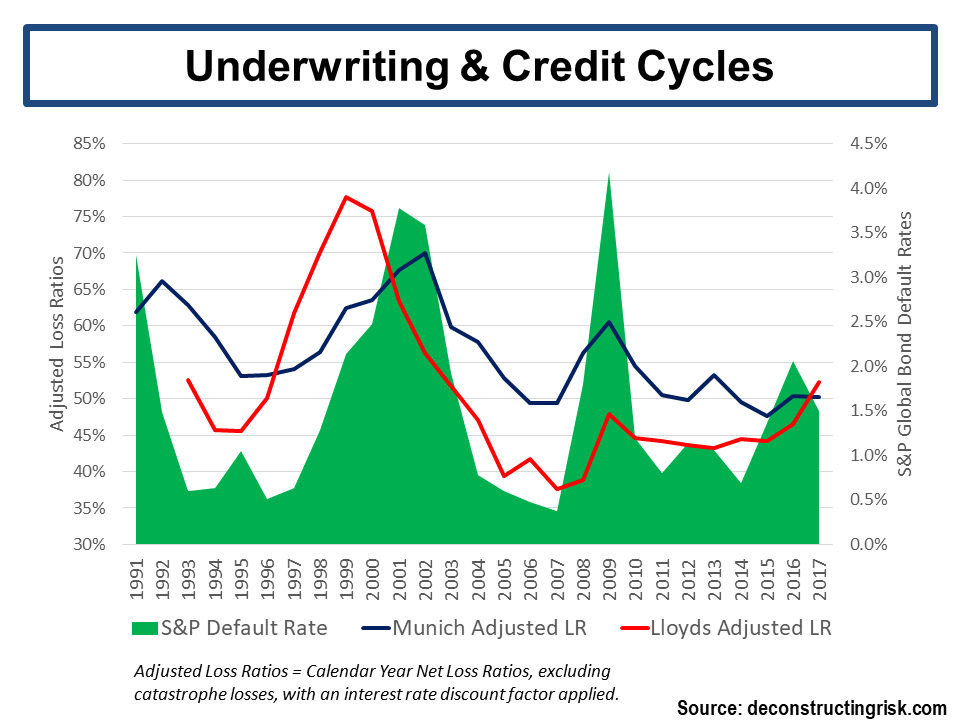
Many commentators, including me (here, here and here are recent examples), have expressed worries in recent years about current market conditions in the specialty insurance, reinsurance and ILS sectors. On Wednesday, Willis Re reported that they estimate their subset of firms analysed are only earning a 3.7% ROE if losses are normalised and reserve releases dried up. David Rule of the Prudential Regulatory Authority in the UK recently stated that London market insurers “appear to be incorporating a more benign view of future losses into their technical pricing”, terms and conditions continued to loosen, reliance on untested new coverages such as cyber insurance is increasing and that insurers “may be too sanguine about catastrophe risks, such as significant weather events”.

With the reinsurance and specialty insurance sectors struggling to meet their cost of capital and pricing terms and conditions being so weak for so long (see this post on the impact of soft pricing on risk profiles), if Hurricane Irma impacts Florida as predicted (i.e. on Saturday) it has the potential to be a capital event for the catastrophe insurance sector rather than just an earnings event. On Friday, Lex in the FT reported that the South-East US makes up 60% of the exposures of the catastrophe insurance market.

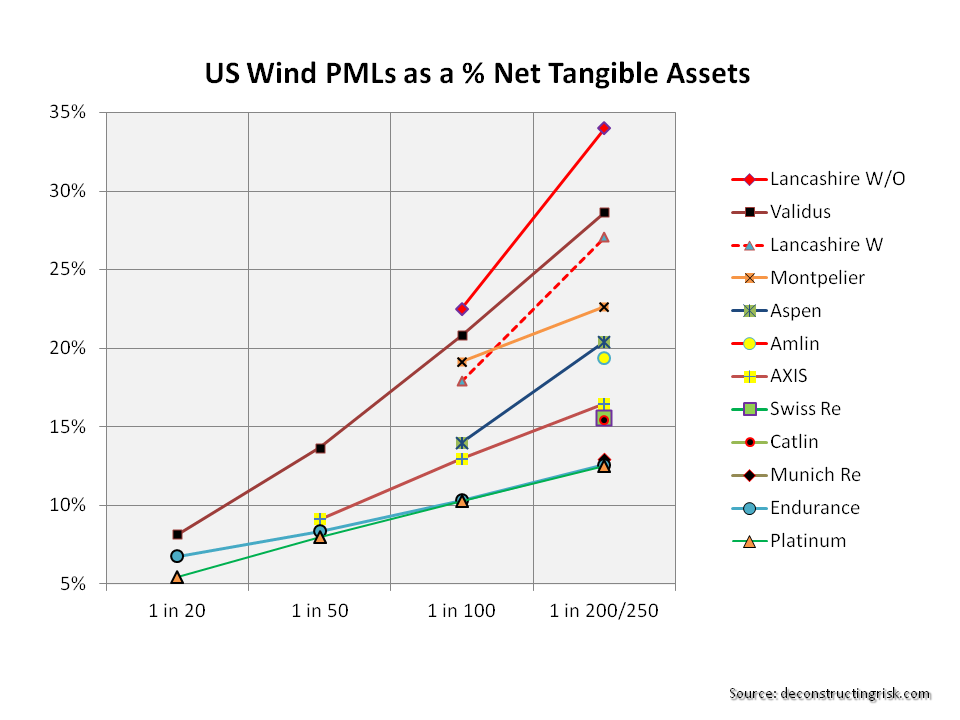
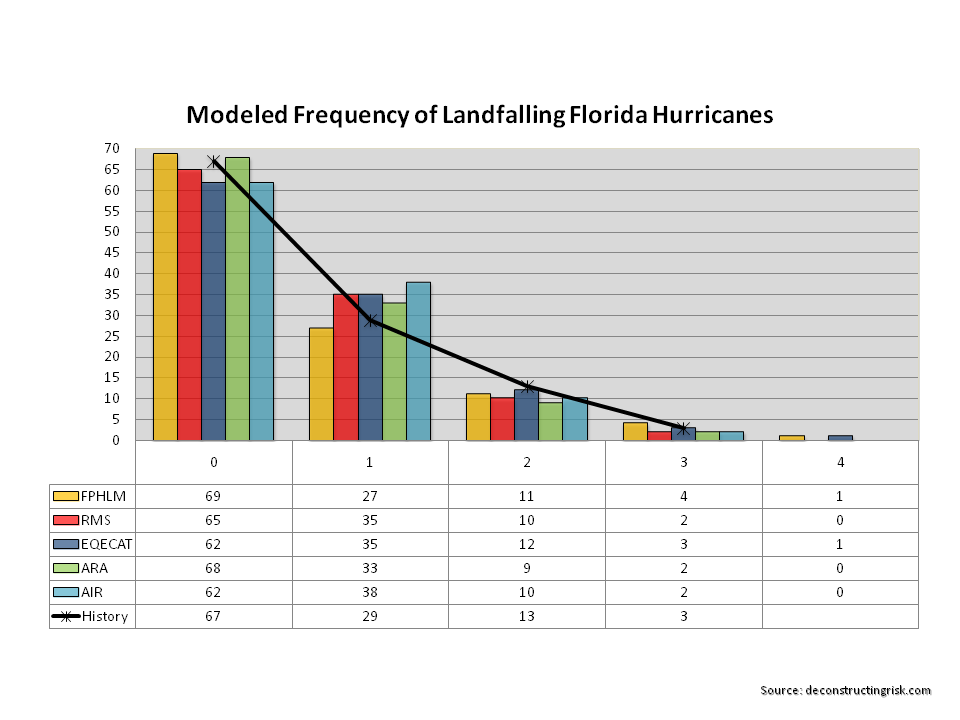
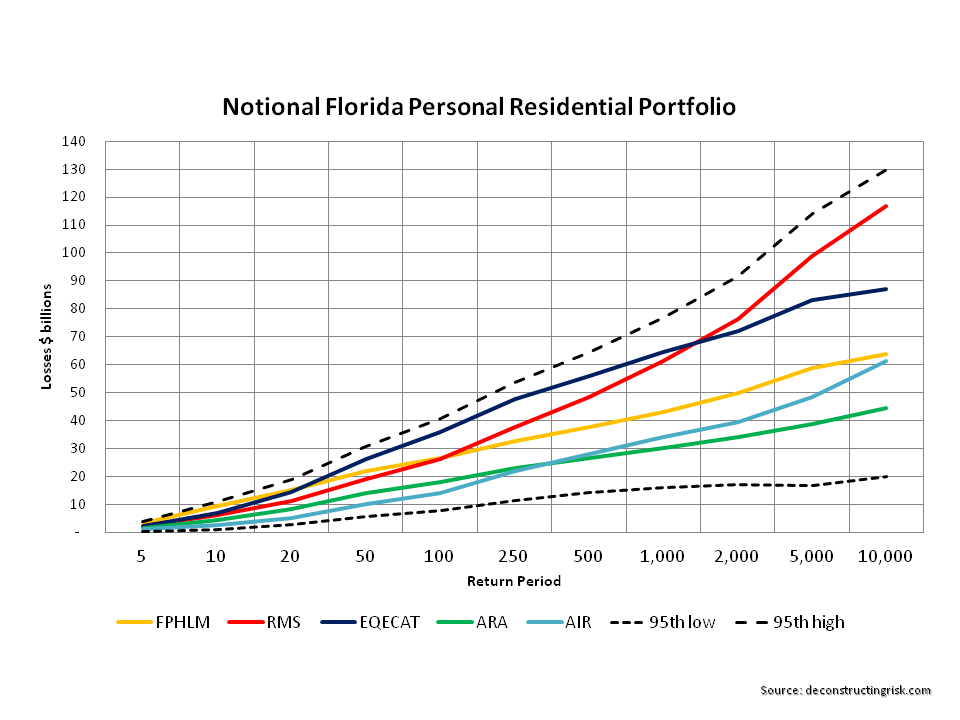
The models utilised in the sector are more variable in their output as events get bigger in their impact (e.g. the higher the return period). A 2013 post on the variation in loss estimates from a selected portfolio of standard insurance coverage by the Florida Commission on Hurricane Loss Projection Methodology (FCHLPM) illustrates the point and one of the graphs from that post is reproduced below.

click to enlarge

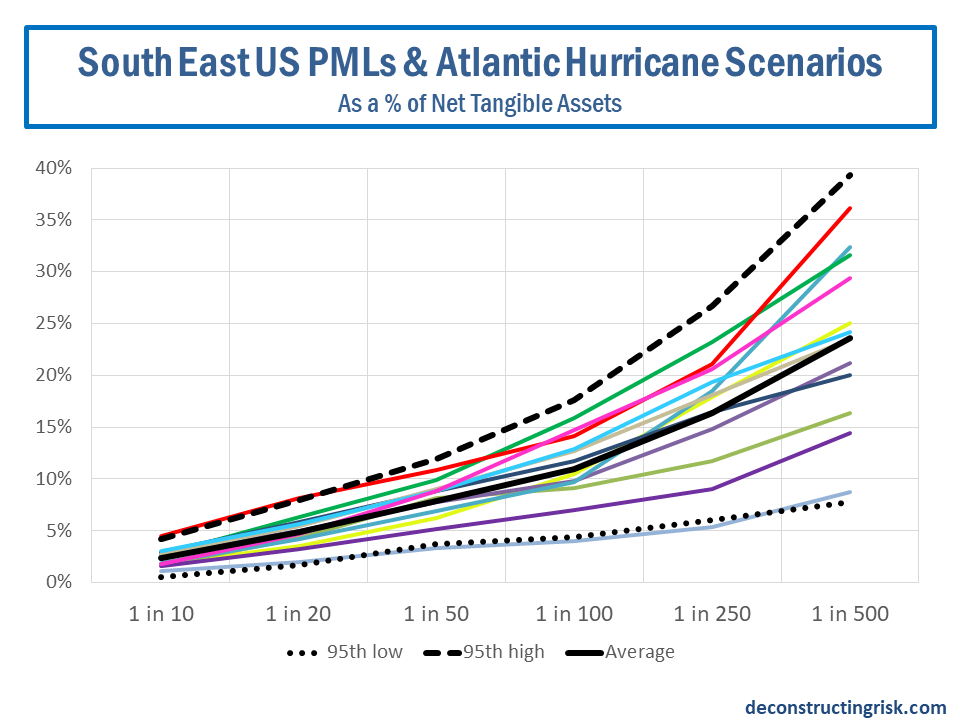
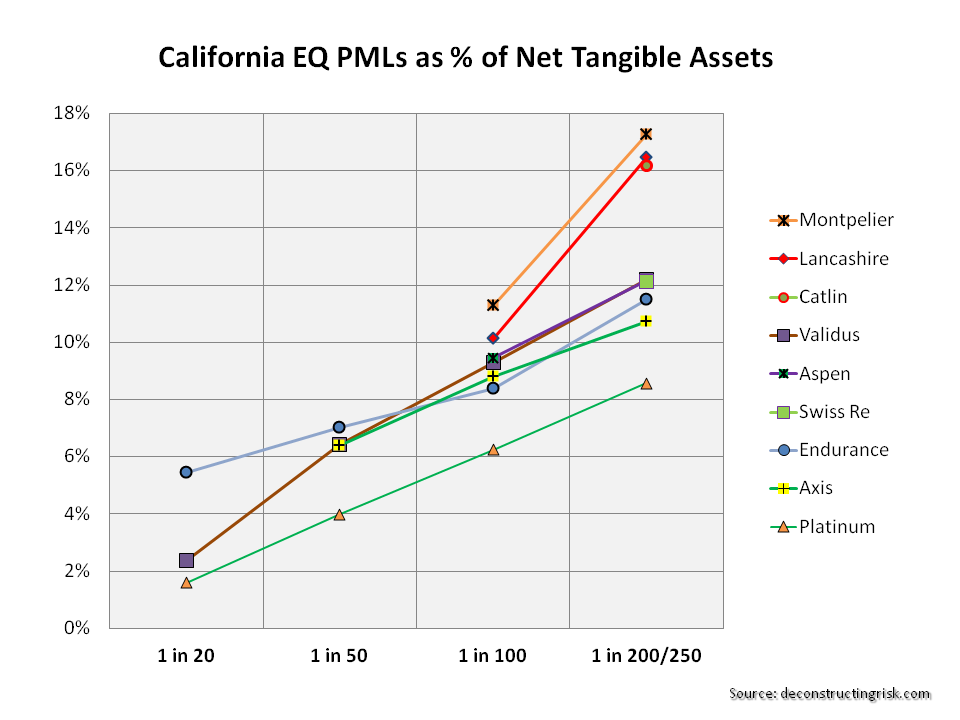
Based upon the most recent South-East US probable maximum losses (PML) and Atlantic hurricane scenarios from a group of 12 specialty insurers and reinsurers I selected, the graph below shows the net losses by return periods as a percentage of each firm’s net tangible assets. This graph does not consider the impact of hybrid or subordinate debt that may absorb losses before the firm’s capital. I have extrapolated many of these curves based upon industry data on US South-East exceedance curves and judgement on firm’s exposures (and for that reason I anonymised the firms).

click to enlarge

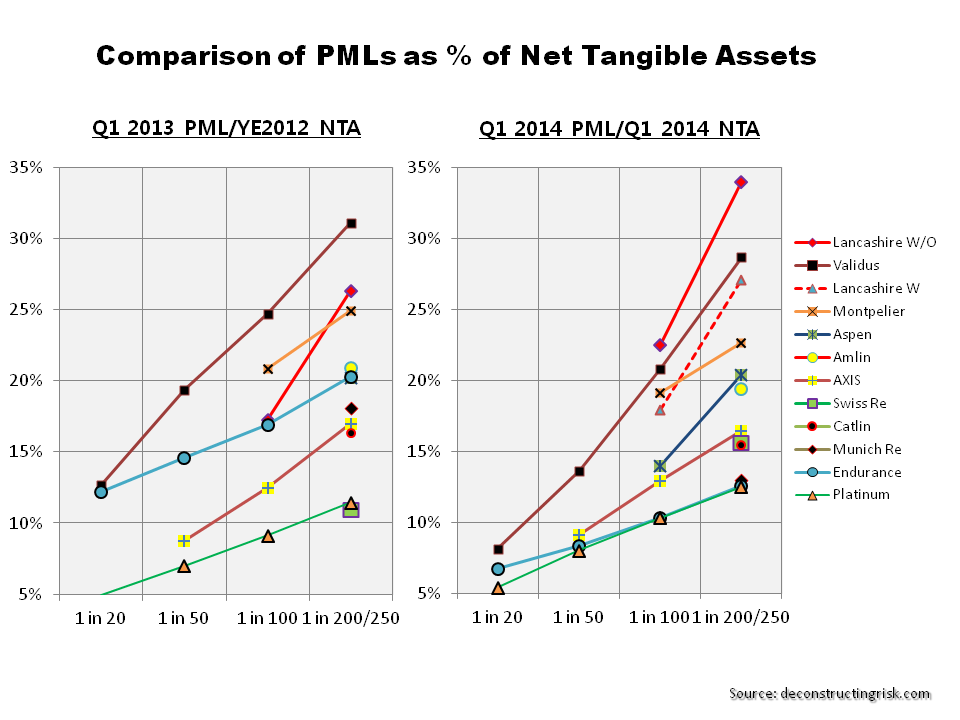
The results of my analysis confirm that specialty insurers and reinsurers, in aggregate, have reduced their South-East US exposures in recent years when I compare average figures to S&P 2014 data (by about 15% for the 1 in 100 return period). Expressed as a net loss ratio, the average for a 1 in 100  and a 1 in 250 return period respectively is 15% and 22%. These figures do look low for events with characteristics of these return periods (the average net loss ratio of the 12 firms from catastrophic events in 2005 and 2011 was 22% and 25% respectively) so it will be fascinating to see what the actual figures are, depending upon how Hurricane Irma pans out. Many firms are utilising their experience and risk management prowess to transfer risks through collaterised reinsurance and retrocession (i.e. reinsurance of reinsurers) to naïve capital market ILS investors.

If the models are correct and maximum losses are around the 1 in 100 return period estimates for Hurricane Irma, well capitalized and managed catastrophe exposed insurers should trade through recent and current events. We will see if the models pass this test. For example, demand surge (whereby labour and building costs increase following a catastrophic event due to overwhelming demand and fixed supply) is a common feature of widespread windstorm damage and is a feature in models (it is one of those inputs that underwriters can play with in soft markets!). Well here’s a thought – could Trump’s immigration policy be a factor in the level of demand surge in Florida and Texas?

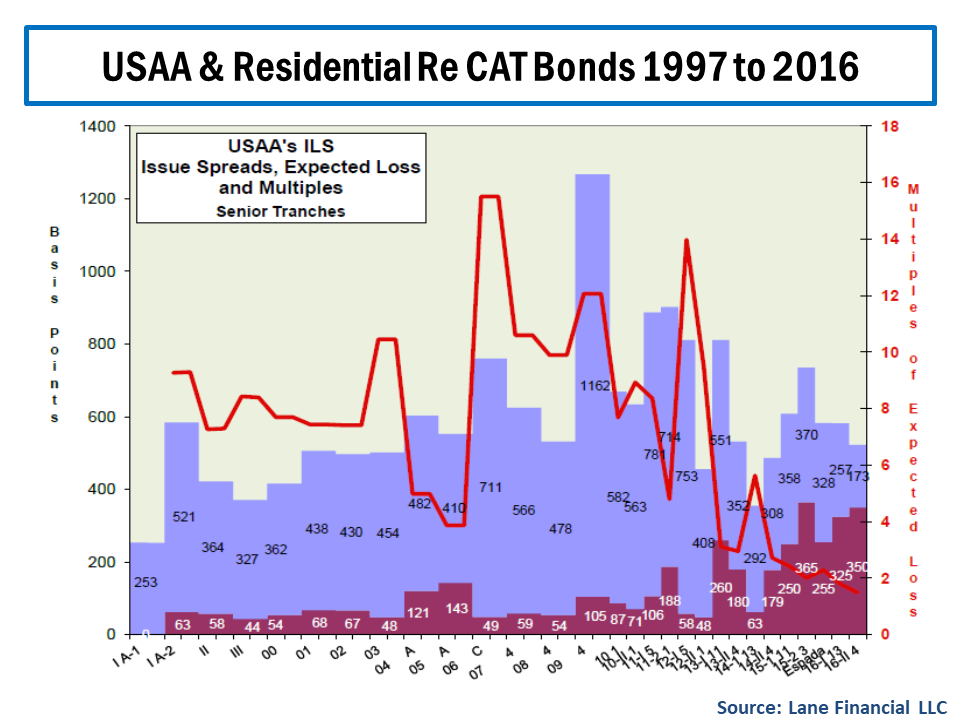
The ILS sector is another matter however in my view due to the rapid growth of the private and unregulated collateralised reinsurance and retrocession markets to satisfy the demand for product supply from ILS funds and yield seeking investors. The prevalence of aggregate covers and increased expected loss attachments in the private ILS market resembles features of previous soft and overheated retrocession markets (generally before a crash) in bygone years. I have expressed my concerns on this market many times (more recently here). Hurricane Irma has the potential to really test underwriting standards across the ILS sector. The graph below from Lane Financial LLC on the historical pricing of US military insurer USAA’s senior catastrophe bonds again illustrates how the market has taken on more risk for less risk adjusted premium (exposures include retired military personnel living in Florida).

click to enlarge

The events in the coming days may tell us, to paraphrase Mr Buffet, who has been swimming naked or as Lex put it on Friday, “this weekend may be a moment when the search for uncorrelated returns bumps hard into acts of God”.

Hopefully, all parts of the catastrophe insurance sector will prove their worth by speedily indemnifying peoples’ material losses (nothing can indemnify the loss of life). After all, that’s its function and economic utility to society. Longer term, recent events may also lead to more debate and real action been taken to ensure that the insurance sector, in all its guises, can have an increased economic function and relevance in an increasingly uncertain world, in insuring perils such as floods for example (and avoiding the ridiculous political interference in risk transfer markets that has made the financial impact of flooding from Hurricane Harvey in Texas so severe).

Notwithstanding the insurance sector, our thoughts must be with the people who will suffer from nature’s recent wrath and our prayers are with all of those negatively affected now and in the future.

Arthur opens the US Hurricane Season

After Hurricane Arthur briefly made landfall in North Carolina on Thursday night, a weakened storm is now heading north. I thought this would be good time to have a look at the probable maximum losses (PMLs) published as at the Q1 2014 results by a sample of specialist (re)insurers, first presented in a post in June 2013. That post went into some detail on the uncertainties surrounding the published PMLs and should be read as relevant background to the figures presented here.

Despite predictions of an above average 2013 Atlantic hurricane season, the number of named hurricanes was the lowest since 1982. Predictions for the 2014 season are for a below average number of hurricanes primarily due to cooler sea temperatures in the Atlantic due to the transition to El Niño (although that is now thought to be slower than previously anticipated). The graph below includes the 2014 predictions.

click to enlargeHistorical Atlantic Storms & Hurricanes I like to look at PMLs as a percentage of net tangible assets (NTA) on a consistent basis across firms to assess exposures from a common equity viewpoint. Many firms include subordinated debt or other forms of hybrid debt in capital when showing their PMLS. For example, Lancashire has approximately $330 million of sub-debt which they include in their capital figures and I have show the difference with and without the sub-debt in the percentages for Lancashire in the graph below on US wind PMLs to illustrate the comparison.

Whether hybrid debt comes in before equity or alongside equity depends upon the exact terms and conditions. The detail of such instruments will determine whether such debt is classified as tier 1, 2 or 3 capital for regulatory purposes under Solvency II (although there are generous transitional timeframes of up to 10 years for existing instruments). The devil is often in the detail and that is another reason why I prefer to exclude them and use a consistent NTA basis.

As per the June 2013 post, firms often classify their US wind exposures by zone but I have taken the highest exposures for each (which may not necessarily be the same zone for each firm).

click to enlargeUS Wind PMLs Q1 2014 These exposures, although expressed as percentages of NTAs, should be considered net of potential profits made for 2014 to assess the real impact upon equity (provided, of course, that the expected profits don’t all come from property catastrophe lines!). If for example we assume a 10% return on NTA across each firm, then the figures above have to be adjusted.

Another issue, also discussed in the previous post, is the return period for similar events that each firms present. For example, the London market firms present Lloyds’ realistic disaster scenarios (RDS) as their PMLs. One such RDS is a repeat of the 1926 Miami hurricane which is predicted to cost $125 billion for the industry if it happened today. For the graph above, I have assumed a 1 in 200 return period for this scenario. The US & Bermudian firms do not present scenarios but points on their occurrence exceedance probability (OEP) curves.

As it is always earthquake season, I also include the PMLs for a California earthquake as per the graph below.

click to enlargeCalifornia EQ PMLs Q1 2014 In terms of current market conditions, the mid-year broker reports are boringly predictable. John Cavanagh, the CEO of Willis Re, commented in their report that “the tentacles of the softening market are spreading far and wide, with no immediate signs of relief. We’ve seen muted demand throughout 2014 and market dynamics are unlikely to change for some time to come. The current market position is increasingly challenging for reinsurers.” Aon Benfield, in their report, stated that “the lowest reinsurance risk margins in a generation stimulate new growth opportunities for insurers and may allow governments to reduce their participation in catastrophe exposed regions as insurance availability and affordability improves”. When people start talking about low pricing leading to new opportunities to take risk, I can but smile. That’s what they said during the last soft market, and the one before that!

Some commentators are making much of the recent withdrawal of the latest Munich Re bond on pricing concerns as an indicator that property catastrophe prices have reached a floor and that the market is reasserting discipline. That may be so but reaching a floor below the technical loss cost level sounds hollow to me when talking about underwriting discipline.

To finish, I have reproducing the graph on Flagstone Re from the June 2013 post as it speaks a thousand words about the dangers of relying too much on the published PMLs. Published PMLs are, after all, only indicators of losses from single events and, by their nature, reflect current (group) thinking from widely used risk management tools.

click to enlargeFlagstone CAT losses Follow-on: It occurred to me after posting that I could compare the PMLs for the selected firms as at Q1 2014 against those from Q1 2013 and the graph below shows the comparison. It does indicate that many firms have taken advantage of cheap reinsurance/retrocession and reduced their net profiles, as highlighted in this post on arbitrage opportunities. Some firms have gone through mergers or business model changes. Endurance, for example, has been changed radically by John Charman (as well as being an aggressive buyer of coverage). Lancashire is one of the only firms whose risk profile has increased using the NTA metric as a result of the Cathedral acquisition and the increase in goodwill.

click to enlargeUS Wind PMLs Q1 2013 vrs 2014

CAT models and fat tails: an illustration from Florida

I have posted numerous times now (to the point of boring myself!) on the dangers of relying on a single model for estimating losses from natural catastrophes. The practise is reportedly widespread in the rapidly growing ILS fund sector. The post on assessing probable maximum losses (PMLs) outlined the sources of uncertainty from such models, especially the widely used commercial vendors models from RMS, AIR and EqeCat.

The Florida Commission on Hurricane Loss Projection Methodology (FCHLPM) was created in 1995 as an independent panel of experts to evaluate computer models used for setting rates for residential property insurance. The website of the FCHLPM contains a treasure trove of information on each of the modelling firms who provide detailed submissions in a pre-set format. These submissions include specifics on the methodology utilised in their models and the output from their models for specified portfolios.

In addition to the three vendor modellers (RMS, AIR, EqeCat), there is also details on two other models approved by FCHLPM, namely Applied Research Associates (ARA) and the Florida Public Hurricane Loss Model (FPHLM)developed by the Florida International University.

In one section of the mandated submissions, the predictions of each of the models on the number of annual landfall hurricanes for a 112 year period (1900 to 2011 is the historical reference period) are outlined. Given the issue over the wind speed classification of Super-storm Sandy as it hit land and the use of hurricane deductibles, I assume that the definition of landfall hurricanes is consistent between the FCHLPM submissions. The graph below shows the assumed frequency over 112 years of 0,1,2,3 or 4 landfall hurricanes from the five modellers.

click to enlargeLandfalling Florida Hurricanes

As one of the objectives of the FCHLPM is to ensure insurance rates are neither excessive nor inadequate, it is unsurprising that each of the models closely matches known history. It does however demonstrate that the models are, in effect, limited by that known history (100 odd years in terms of climatic experiences is limited by any stretch!). One item to note is that most of the models have a higher frequency for 1 landfall hurricane and a lower frequency for 2 landfall hurricanes when compared with the 100 year odd history. Another item of note is that only EqeCat and FPHLM have any frequency for 4 landfall hurricanes in any one year over the reference period.

Each of the modellers are also required to detail their loss exceedance estimates for two assumed risk portfolios. The first portfolio is set by FCHLPM and is limited to 3 construction types, geocodes by ZIP code centroil (always be wary of anti-selection dangers in relying on centroil data, particularly in large counties or zones with a mixture of coastal and inland exposure), and specific policy conditions. The second portfolio is the 2007 Florida Hurricane Catastrophe Fund aggregate personal and commercial residential exposure data. The graphs below show the results for the different models with the dotted lines representing the 95th percentile margin of error around the average of all 5 model outputs.

click to enlarge

Modelled Losses Florida Notional Residential PortfolioModelled Losses FHCF Commercial Residential Portfolio

As would be expected, uncertainty over losses increase as the return periods increase. The tail of outputs from catastrophe models clearly need to be treated will care and tails need to be fatten up to take into account uncertainty. Relying solely on a single point from a single model is just asking for trouble.