
I have posted numerous times now (to the point of boring myself!) on the dangers of relying on a single model for estimating losses from natural catastrophes. The practise is reportedly widespread in the rapidly growing ILS fund sector. The post on assessing probable maximum losses (PMLs) outlined the sources of uncertainty from such models, especially the widely used commercial vendors models from RMS, AIR and EqeCat.
The Florida Commission on Hurricane Loss Projection Methodology (FCHLPM) was created in 1995 as an independent panel of experts to evaluate computer models used for setting rates for residential property insurance. The website of the FCHLPM contains a treasure trove of information on each of the modelling firms who provide detailed submissions in a pre-set format. These submissions include specifics on the methodology utilised in their models and the output from their models for specified portfolios.
In addition to the three vendor modellers (RMS, AIR, EqeCat), there is also details on two other models approved by FCHLPM, namely Applied Research Associates (ARA) and the Florida Public Hurricane Loss Model (FPHLM)developed by the Florida International University.
In one section of the mandated submissions, the predictions of each of the models on the number of annual landfall hurricanes for a 112 year period (1900 to 2011 is the historical reference period) are outlined. Given the issue over the wind speed classification of Super-storm Sandy as it hit land and the use of hurricane deductibles, I assume that the definition of landfall hurricanes is consistent between the FCHLPM submissions. The graph below shows the assumed frequency over 112 years of 0,1,2,3 or 4 landfall hurricanes from the five modellers.
click to enlarge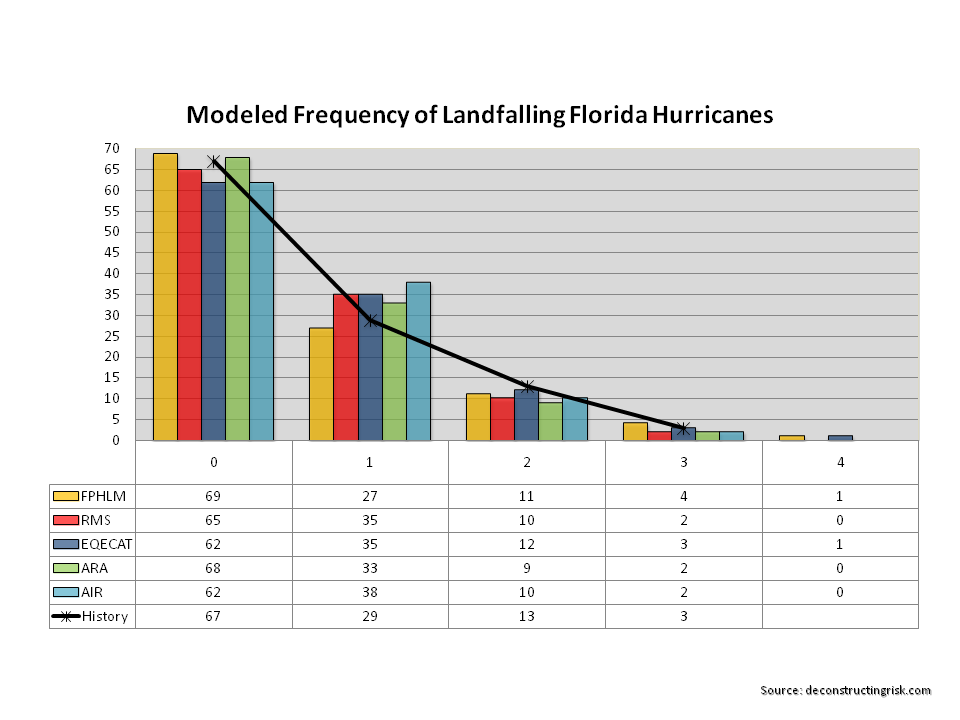
As one of the objectives of the FCHLPM is to ensure insurance rates are neither excessive nor inadequate, it is unsurprising that each of the models closely matches known history. It does however demonstrate that the models are, in effect, limited by that known history (100 odd years in terms of climatic experiences is limited by any stretch!). One item to note is that most of the models have a higher frequency for 1 landfall hurricane and a lower frequency for 2 landfall hurricanes when compared with the 100 year odd history. Another item of note is that only EqeCat and FPHLM have any frequency for 4 landfall hurricanes in any one year over the reference period.
Each of the modellers are also required to detail their loss exceedance estimates for two assumed risk portfolios. The first portfolio is set by FCHLPM and is limited to 3 construction types, geocodes by ZIP code centroil (always be wary of anti-selection dangers in relying on centroil data, particularly in large counties or zones with a mixture of coastal and inland exposure), and specific policy conditions. The second portfolio is the 2007 Florida Hurricane Catastrophe Fund aggregate personal and commercial residential exposure data. The graphs below show the results for the different models with the dotted lines representing the 95th percentile margin of error around the average of all 5 model outputs.
click to enlarge
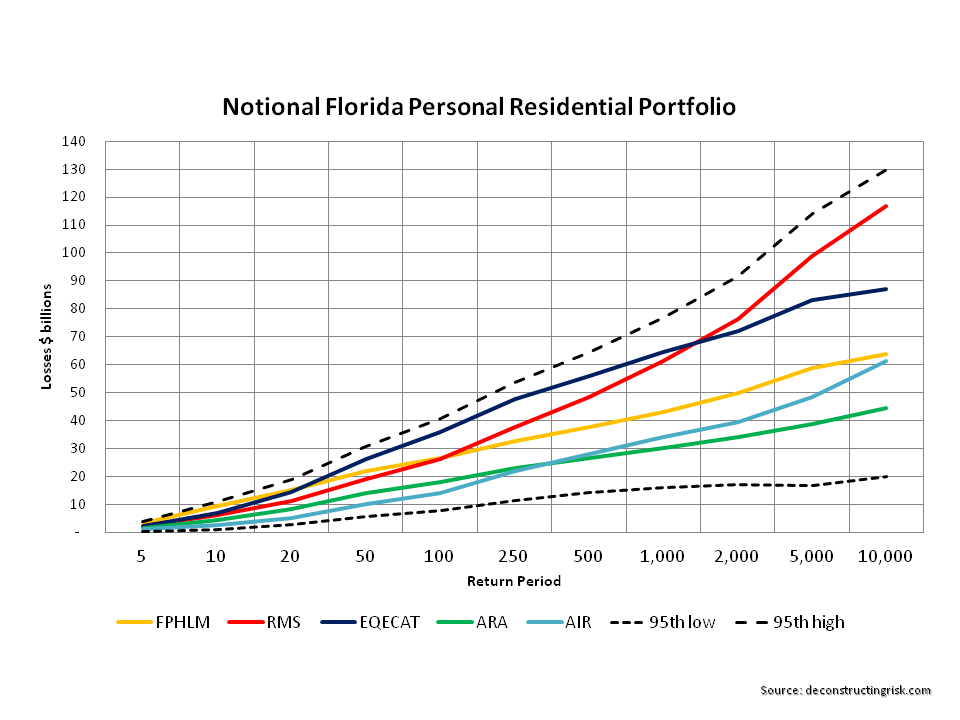

As would be expected, uncertainty over losses increase as the return periods increase. The tail of outputs from catastrophe models clearly need to be treated will care and tails need to be fatten up to take into account uncertainty. Relying solely on a single point from a single model is just asking for trouble.
