As the S&P500 hit an intraday all-time high yesterday, it’s been nearly 9 months since I posted on the valuation of the S&P500 (here). Since then, I have touched on factors like the reversal of global QE flows by Central Banks (here) and the lax credit terms that may be exposed by tightening monetary conditions (here). Although the traditional pull back after labor day in the US hasn’t been a big feature in recent years, the market feels frothy and a pullback seems plausible. The TINA (There Is No Alternative) trade is looking distinctly tired as the bull market approaches the 3,500-day mark. So now is an opportune time to review some of the arguments on valuations.
Fortune magazine recently had an interesting summary piece on the mounting headwinds in the US which indicate that “the current economic expansion is much nearer its end than its beginning”. Higher interest rates and the uncertainty from the ongoing Trump trade squabble are obvious headwinds that have caused nervous investors to moderate slightly valuation multiples from late last year. The Fortune article points to factors like low unemployment rates and restrictions on immigration pushing up wage costs, rising oil prices, the fleeting nature of Trump’s tax cuts against the long-term impact on federal debt, high corporate debt levels (with debt to EBITDA levels at 15 years high) and the over-optimistic earnings growth estimated by analysts.
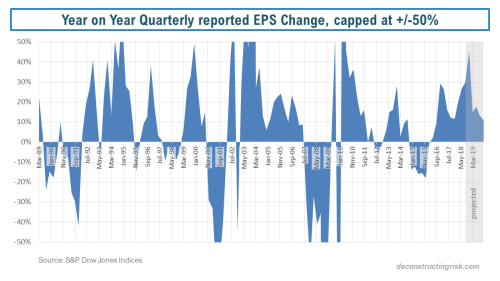
That last point may seem harsh given the 24% and 10% growth in reported quarterly EPS and revenue respectively in Q2 2018 over Q2 2017, according to Factset as at 10/08/2018. The graph below shows the quarterly reported growth projections by analysts, as per S&P Dow Jones Indices, with a fall off in quarterly growth in 2019 from the mid-20’s down to a 10-15% range, as items like the tax cuts wash out. Clearly 10-15% earnings growth in 2019 is still assuming strong earnings and has some commentators questioning whether analysts are being too optimistic given the potential headwinds outlined above.
According to Factset as at 10/08/2018, the 12-month forward PE of 16.6 is around the 5-year average level and 15% above the 10-year average, as below. As at the S&P500 high on 21/08/2018, the 12-month forward PE is 16.8.
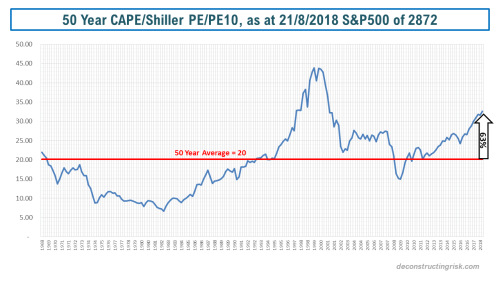
In terms of the Shiller PE or the cyclically adjusted PE (PE10), the graph below shows that the current PE10 ratio of 32.65 as at the S&P500 high on 21/08/2018, which is 63% higher than 50-year average of 20. For the purists, the current PE10 is 89% above the 100-year average.
click to enlarge
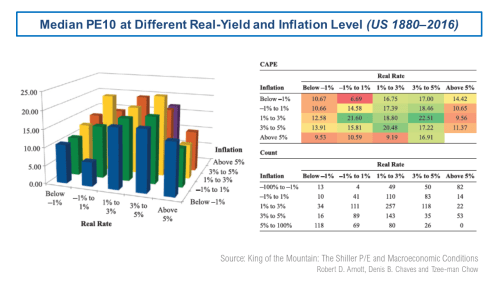
According to this very interesting research paper called King of the Mountain, the PE10 metric varies across different macro-economic conditions, specifically the level of real interest rates and inflation. The authors further claim that PE10 becomes a statistically significant and economically meaningful predictor of shorter-term returns under the assumption that PE10 levels mean-revert toward the levels suggested by prevailing macroeconomic conditions rather than toward long-term averages. The graph below shows the results from the research for different real yield and inflation levels, the so-called valuation mountain.
At a real yield around 1% and inflation around 2%, the research suggests a median PE around 20 is reasonable. Although I know that median is not the same as mean, the 20 figure is consistent with the 50-year PE10 average. The debates on CAPE/PE10 as a valuation metric have been extensively aired in this blog (here and here are examples) and range around the use of historically applicable earnings data, adjustments around changes in accounting methodology (such as FAS 142/144 on intangible write downs), relevant time periods to reflect structural changes in the economy, changes in dividend pay-out ratios, the increased contribution of foreign earnings in US firms, and the reduced contribution of labour costs (due to low real wage inflation).
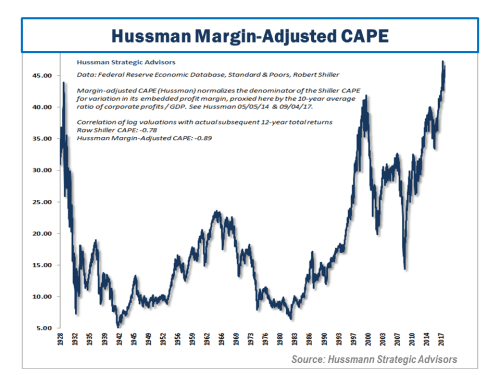
One hotly debated issue around CAPE/PE10 is the impact of the changing profit margin levels. One conservative adjustment to PE10 for changes in profit margins is the John Hussman adjusted CAPE/PE10, as below, which attempts to normalise profit margins in the metric. This metric indicates that the current market is at an all time high, above the 1920s and internet bubbles (it sure doesn’t feel like that!!). In Hussman’s most recent market commentary, he states that “we project market losses over the completion of this cycle on the order of -64% for the S&P 500 Index”.
Given the technological changes in business models and structures across economic systems, I believe that assuming current profit margins “normalise” to the average is too conservative, particularly given the potential for AI and digital transformation to cut costs across a range of business models over the medium term. Based upon my crude adjustment to the PE10 for 2010 and prior, as outlined in the previous Broken Record post (i.e. adjusted to 8.5%), using US corporate profits as a % of US GDP as a proxy for profit margins, the current PE10 of 32.65 is 21% above my profit margin adjusted 50-year average of 27, as shown below.
click to enlarge
So, in summary, the different ranges of overvaluation for the S&P500 at its current high are from 15% to 60%. If the 2019 estimates of 10-15% quarterly EPS growth start to look optimistic, whether through deepening trade tensions or tighter monetary policy, I could see a 10% to 15% pullback. If economic headwinds, as above, start to get serious and the prospect of a recession gets real (although these things normally come quickly as a surprise), then something more serious could be possible.
On the flipside, I struggle to see where significant upside can come from in terms of getting earnings growth in 2019 past the 10-15% range. A breakthrough in trade tensions may be possible although unlikely before the mid-term elections. All in all, the best it looks like to me in the short term is the S&P500 going sideways from here, absent a post-labor day spurt of profit taking.
But hey, my record on calling the end to this bull market has been consistently broken….


