Tag Archives: market valuations

Multiple Temptation

I thought it was time for a quick catch up on all things reinsurance and specialty insurance since my last post a year ago. At that time, it looked like the underlying rating environment was gaining momentum and a hoped-for return to underwriting profitability looked on the cards. Of course, since then, the big game changer has been COVID-19.

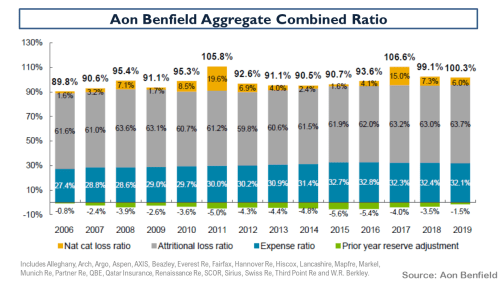
A quick catch-up on the 2019 results, as below, from the Aon Reinsurance Aggregate (ARA) results of selected firms illustrates the position as we entered this year. It is interesting to note that reserve releases have virtually dried up and the 2019 accident year excluding cats is around 96%.

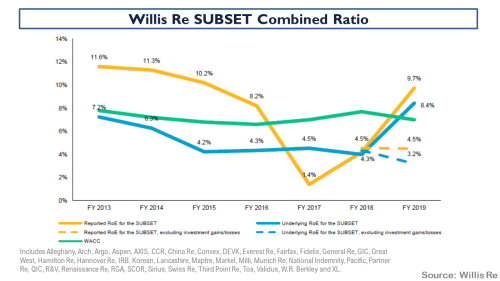
The Willis Re subset of aggregate results is broadly similar to the ARA (although it contains a few more of the lesser players and some life reinsurers and excludes firms like Beazley and Hiscox) and it shows that on an underling basis (i.e. accident year with normalised cat load), the trend is still upwards and more rate improvement is needed to improve attritional loss ratios.

The breakdown of the pre-tax results of the ARA portfolio, as below, shows that investment returns and gains saved the day in 2019.

The ROE’s of the Willis portfolio when these gains were stripped out illustrates again how underwriting performance needs to improve.

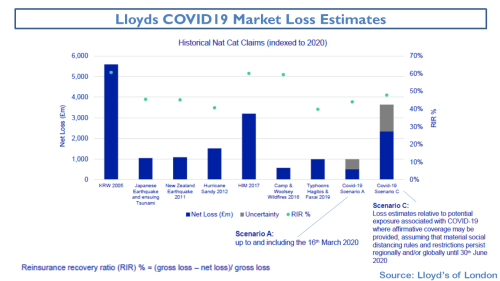
Of course, COVID-19 has impacted the sector both in terms of actual realised losses (e.g. event cancellations) and with the cloud of uncertainty over reserves for multiple exposures yet to be fully realised. There remains much uncertainty in the sector about the exact size of the potential losses with industry estimates ranging widely. Swiss Re recently put the figure at between $50-80 billion. To date, firms have established reserves of just over $20 billion. One of the key uncertainties is the potential outcome of litigation around business interruption cover. The case brought in the UK by the FCA on behalf of policyholders hopes to expedite lengthy legal cases over the main policy wordings with an outcome expected in mid-September. Lloyds industry insurance loss estimate is within the Swiss Re range and their latest June estimate is shown below against other historical events.

I think Alex Maloney of Lancashire summarised the situation well when he said that “COVID-19 is an ongoing event and a loss which will take years to mature”, adding that for “the wider industry the first-party claims picture will not be clear until 2021”. Evan Greenberg of Chubb described the pandemic as a slow rolling global catastrophe impacting virtually all countries, unlike other natural catastrophes it has no geographic or time limits and the event continues as we speak” and predicted that “together the health and consequent economic crisis will likely produce the largest loss in insurance history, particularly considering its worldwide scope and how both sides of the balance sheet are ultimately impacted”.

The immediate impact of COVID-19 has been on rates with a significant acceleration of rate hardening across most lines of business, with some specialty lines such as certain D&O covers have seen massive increases of 50%+. Many firms are reporting H1 aggregate rate increases of between 10% to 15% across their diversified portfolios. Insurance rate increases over the coming months and reinsurance rates at the January renewals, assuming no material natural cats in H2 2020, will be the key test as to whether a true hard market has arrived. Some insurers are already talking about increasing their risk retentions and their PMLs for next year in response to reinsurance rate hardening.

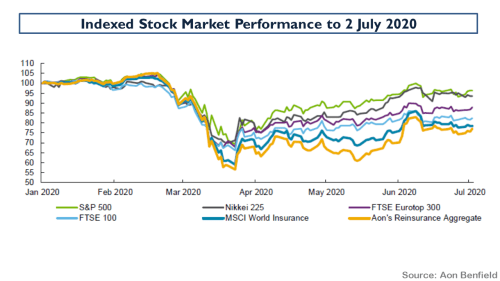
Valuations in the sector have taken a hit as the graph below from Aon on stock performance shows.

Leaving the uncertainty around COVID-19 to one side, tangible book multiples amongst several of my favourite firms since this March 2018 post, most of whom have recently raised additional capital in anticipation of a broad hard market in specialty insurance and reinsurance market, look tempting, as below.

The question is, can you leave aside the impact of COVID-19? That question is worthy of some further research, particularly on the day that Hiscox increased their COVID-19 reserves from $150 million to $230 million and indicated a range of a £10 million to £250 million hit if the UK business interruption case went against them (the top of the range estimate would reduce NTAs by 9%).

Food for thought.

Creepy Things

It has been a while since I looked at the state of the reinsurance and specialty insurance markets. Recent market commentary and insurers’ narratives at recent results have suggested market rates are finally firming up, amidst talk of reserve releases drying up and loss creep on recent events.

Just yesterday, Bronek Masojada the CEO of Hiscox commented that “the market is in a better position than it has been for some time”. The Lancashire CEO Alex Maloney said he was “encouraged by the emerging evidence that the (re)insurance market is now experiencing the long-anticipated improvements in discipline and pricing”. The Chubb CEO Evan Greenberg said that “pricing continued to tighten in the quarter while spreading to more classes and segments of business, particularly in the U.S. and London wholesale market”.

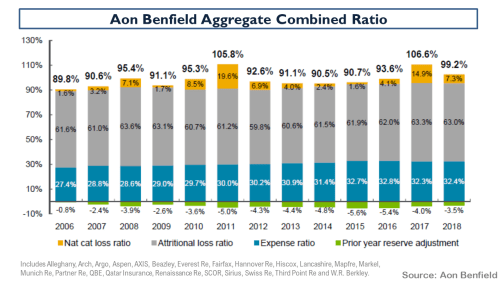
A look at the historical breakdown of combined ratios in the Aon Benfield Aggregate portfolio from April (here) and Lloyds results below illustrate the downward trend in reserve releases in the market to the end of 2018. The exhibits also indicate the expense disadvantage that Lloyds continues to operate under (and the reason behind the recently announced modernisation drive).

click to enlarge

click to enlarge

In the Willis Re mid-year report called “A Discerning Market” their CEO James Kent said “there are signs that the longstanding concern over the level of reserve redundancy in past year reserves is coming to fruition” and that in “some classes, there is a clear trend of worsening loss ratios in recent underwriting years due to a prolonged soft market and an increase in loss severity.

 In their H1 presentation, Hiscox had an exhibit that quantified some of the loss creep from recent losses, as below.

click to enlarge

The US Florida hurricane losses have been impacted by factors such as assignment of benefits (AOB) in litigated water claims and subsequently inflating repair costs. Typhoon Jebi losses have been impacted by overlapping losses and demand surge from Typhoon Trami, the Osaka earthquake and demand from Olympics construction. Arch CEO Marc Grandisson believes that the market missed the business interruption and contingent BI exposures in Jebi estimates.

The fact that catastrophic losses are unpredictable, even after the event, is no surprise to students of insurance history (this post on the history of Lloyds is a testament to unpredictability). Technology and advances in modelling techniques have unquestionably improved risk management in insurance in recent years. Notwithstanding these advances, uncertainty and the unknown should always be considered when model outputs such as probability of loss and expected loss are taken as a given in determining risk premium.

To get more insight into reserve trends, it’s worth taking a closer look at two firms that have historically shown healthy reserve releases – Partner Re and Beazley. From 2011 to 2016, Partner Re’s non-life business had an average reserve release of $675 million per year which fell to $450 million in 2017, and to $250 million in 2018. For H1 2019, that figure was $15 million of reserve strengthening. The exhibit below shows the trend with 2019 results estimated based upon being able to achieve reserve releases of $100 million for the year and assuming no major catastrophic claims in 2019. Despite the reduction in reserve releases, the firm has grown its non-life business by double digits in H1 2019 and claims it is “well-positioned to benefit from this improved margin environment”.

click to enlarge

Beazley is one of the best insurers operating from London with a long history of mixing innovation with a balanced portfolio. It has doubled its net tangible assets (NTA) per share over the past 10 years and trades today at a 2.7 multiple to NTA. Beazley is also predicting double digit growth due to an improving rating environment whilst predicting “the scale of the losses that we, in common with the broader market, have incurred over the past two years means that below average reserve releases will continue this year”.

click to enlarge

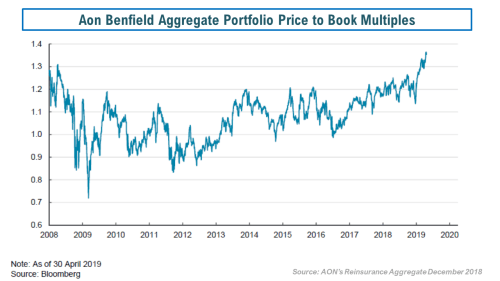
And that’s the rub. Although reserves are dwindling, rate improvements should help specialty (re)insurers to rebuild reserves and improve profitability back above its cost of capital, assuming normal catastrophe loss levels. However, market valuations, as reflected by the Aon Benfield price to book exhibit below, look like they have all that baked in already.

click to enlarge

And that’s a creepy thing.

Broken Record II

As the S&P500 hit an intraday all-time high yesterday, it’s been nearly 9 months since I posted on the valuation of the S&P500 (here). Since then, I have touched on factors like the reversal of global QE flows by Central Banks (here) and the lax credit terms that may be exposed by tightening monetary conditions (here). Although the traditional pull back after labor day in the US hasn’t been a big feature in recent years, the market feels frothy and a pullback seems plausible. The TINA (There Is No Alternative) trade is looking distinctly tired as the bull market approaches the 3,500-day mark. So now is an opportune time to review some of the arguments on valuations.

Fortune magazine recently had an interesting summary piece on the mounting headwinds in the US which indicate that “the current economic expansion is much nearer its end than its beginning”. Higher interest rates and the uncertainty from the ongoing Trump trade squabble are obvious headwinds that have caused nervous investors to moderate slightly valuation multiples from late last year. The Fortune article points to factors like low unemployment rates and restrictions on immigration pushing up wage costs, rising oil prices, the fleeting nature of Trump’s tax cuts against the long-term impact on federal debt, high corporate debt levels (with debt to EBITDA levels at 15 years high) and the over-optimistic earnings growth estimated by analysts.

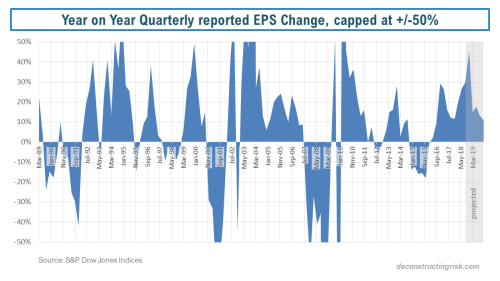
That last point may seem harsh given the 24% and 10% growth in reported quarterly EPS and revenue respectively in Q2 2018 over Q2 2017, according to Factset as at 10/08/2018. The graph below shows the quarterly reported growth projections by analysts, as per S&P Dow Jones Indices, with a fall off in quarterly growth in 2019 from the mid-20’s down to a 10-15% range, as items like the tax cuts wash out. Clearly 10-15% earnings growth in 2019 is still assuming strong earnings and has some commentators questioning whether analysts are being too optimistic given the potential headwinds outlined above.

click to enlarge

According to Factset as at 10/08/2018, the 12-month forward PE of 16.6 is around the 5-year average level and 15% above the 10-year average, as below. As at the S&P500 high on 21/08/2018, the 12-month forward PE is 16.8.

click to enlarge

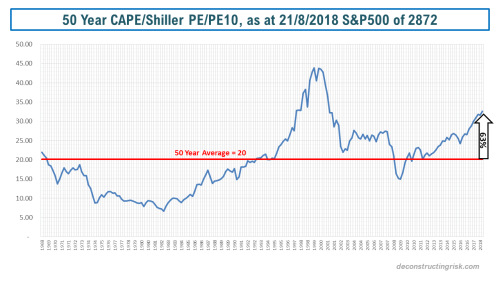
In terms of the Shiller PE or the cyclically adjusted PE (PE10), the graph below shows that the current PE10 ratio of 32.65 as at the S&P500 high on 21/08/2018, which is 63% higher than 50-year average of 20. For the purists, the current PE10 is 89% above the 100-year average.

click to enlargeCAPE Shiller PE PE10 as at 21082018 S&P500 high

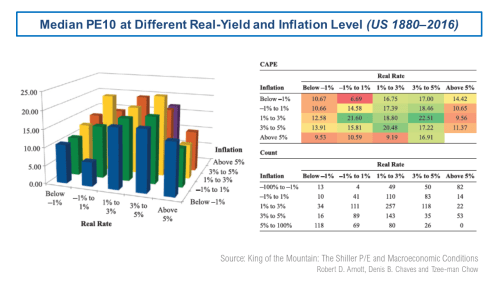
According to this very interesting research paper called King of the Mountain, the PE10 metric varies across different macro-economic conditions, specifically the level of real interest rates and inflation. The authors further claim that PE10 becomes a statistically significant and economically meaningful predictor of shorter-term returns under the assumption that PE10 levels mean-revert toward the levels suggested by prevailing macroeconomic conditions rather than toward long-term averages. The graph below shows the results from the research for different real yield and inflation levels, the so-called valuation mountain.

click to enlarge

At a real yield around 1% and inflation around 2%, the research suggests a median PE around 20 is reasonable. Although I know that median is not the same as mean, the 20 figure is consistent with the 50-year PE10 average. The debates on CAPE/PE10 as a valuation metric have been extensively aired in this blog (here and here are examples) and range around the use of historically applicable earnings data, adjustments around changes in accounting methodology (such as FAS 142/144 on intangible write downs), relevant time periods to reflect structural changes in the economy, changes in dividend pay-out ratios, the increased contribution of foreign earnings in US firms, and the reduced contribution of labour costs (due to low real wage inflation).

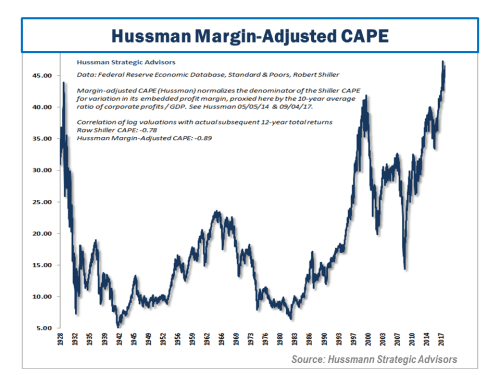
One hotly debated issue around CAPE/PE10 is the impact of the changing profit margin levels. One conservative adjustment to PE10 for changes in profit margins is the John Hussman adjusted CAPE/PE10, as below, which attempts to normalise profit margins in the metric. This metric indicates that the current market is at an all time high, above the 1920s and internet bubbles (it sure doesn’t feel like that!!). In Hussman’s most recent market commentary, he states that “we project market losses over the completion of this cycle on the order of -64% for the S&P 500 Index”.

click to enlarge

Given the technological changes in business models and structures across economic systems, I believe that assuming current profit margins “normalise” to the average is too conservative, particularly given the potential for AI and digital transformation to cut costs across a range of business models over the medium term. Based upon my crude adjustment to the PE10 for 2010 and prior, as outlined in the previous Broken Record post (i.e. adjusted to 8.5%), using US corporate profits as a % of US GDP as a proxy for profit margins, the current PE10 of 32.65 is 21% above my profit margin adjusted 50-year average of 27, as shown below.

click to enlargeCAPE Shiller PE PE10 adjusted as at 21082018 S&P500 high

So, in summary, the different ranges of overvaluation for the S&P500 at its current high are from 15% to 60%. If the 2019 estimates of 10-15% quarterly EPS growth start to look optimistic, whether through deepening trade tensions or tighter monetary policy, I could see a 10% to 15% pullback. If economic headwinds, as above, start to get serious and the prospect of a recession gets real (although these things normally come quickly as a surprise), then something more serious could be possible.

On the flipside, I struggle to see where significant upside can come from in terms of getting earnings growth in 2019 past the 10-15% range. A breakthrough in trade tensions may be possible although unlikely before the mid-term elections. All in all, the best it looks like to me in the short term is the S&P500 going sideways from here, absent a post-labor day spurt of profit taking.

But hey, my record on calling the end to this bull market has been consistently broken….