Following on from my initial post on AIG and before AIG’s Q3 results due on Halloween, I spent some time digging into the main drivers of the new AIG’s performance. In the interests of full disclosure, I do not currently own, nor have I in the past owned, stock in AIG.
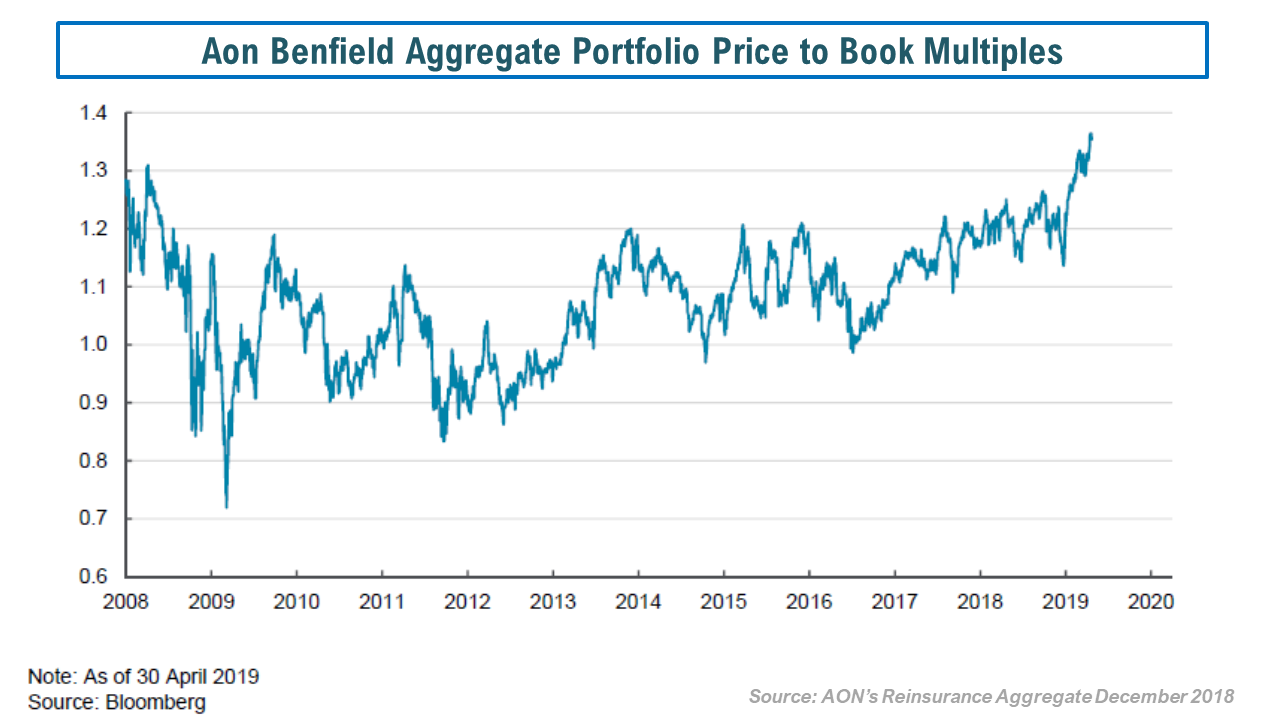
AIG’s valuation has improved recently breaking through $50 in September before briefly retreating and again breaking above $52 currently as we run-up to the Q3 results, as can be seen in the latest price to book multiple graph below.
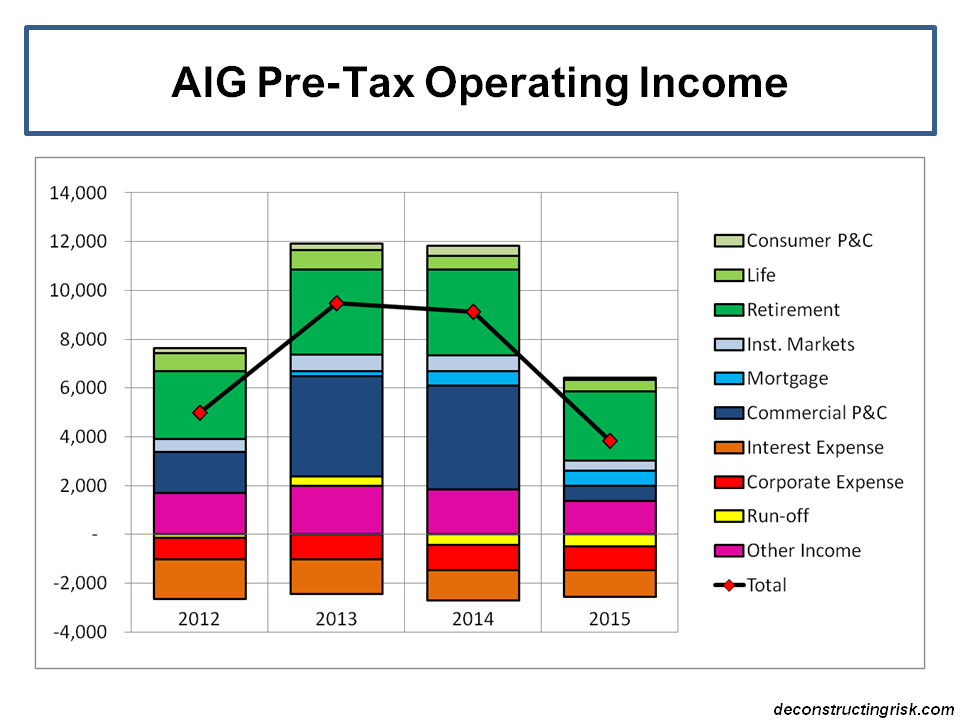
click to enlarge In the new AIG, there are 3 main business drivers – P&C, life & retirement, and a hodgepodge under the title of other (made up of the mortgage business, global capital markets (GCM), and the direct investment book (DIB), legal reserves, interest and corporate expenses).
Their Q2 presentation showed that capital is approximately 50%, 40% and 10% split against the businesses in P&C, life & retirement, and the other section, as per the graph below. Clearly, the P&C division has not contributed to operating income in proportion to its capital base in recent years.
click to enlarge The 2012 employee count of 63,000 is split 45,000 in the P&C division (with 30,000 in international), 12,000 in the life & retirement division and 6,000 in the other business units.
P&C Division
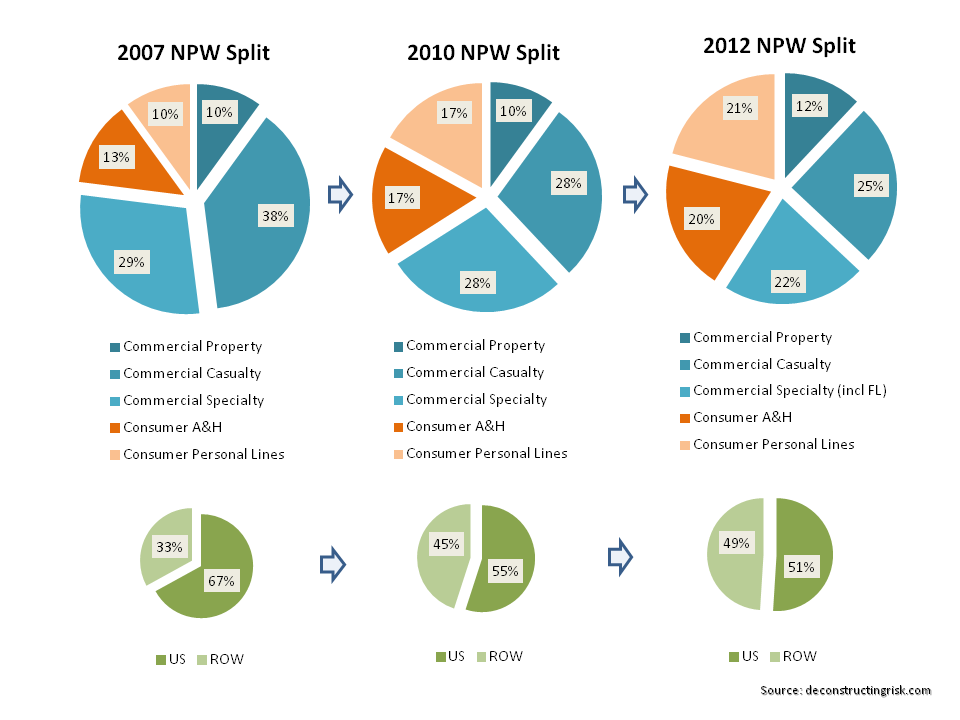
Over the past 5 years, AIG has shifted their business mix away from an US commercial focus to a more balanced commercial & consumer (60:40) and US & international (60:40) mix, as per the graph below.
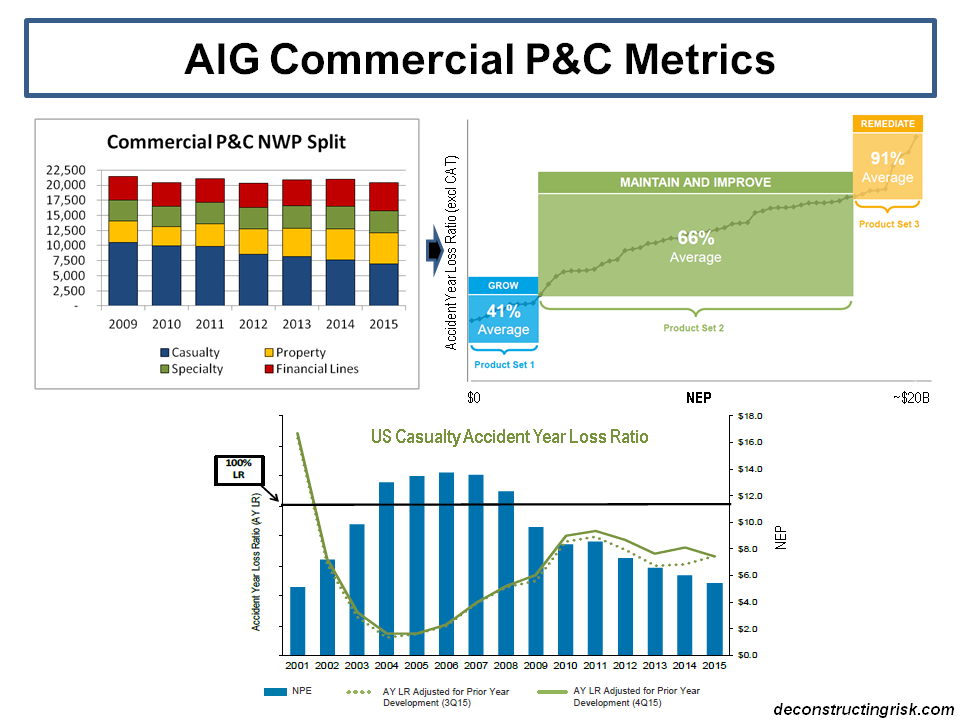
click to enlarge The focus for AIG is on higher value commercial and consumer products and geographical diversity with a greater emphasis on technical underwriting discipline. In particular, following significant reserve strengthening in 2009 and 2010, AIG has refined its approach to underwriting and reserving excess casualty, exited excess workers compensation (WC) and dramatically reduced their exposure to the specialty WC business (with small monocline guaranteed cost risks) that grew so rapidly in the early to mid 2000s.
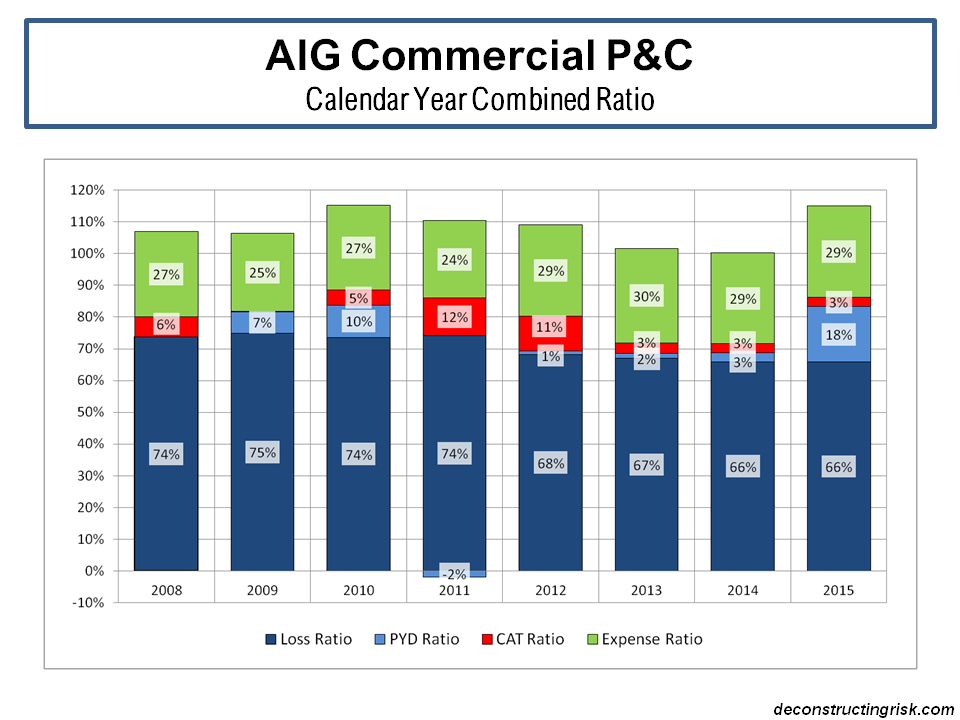
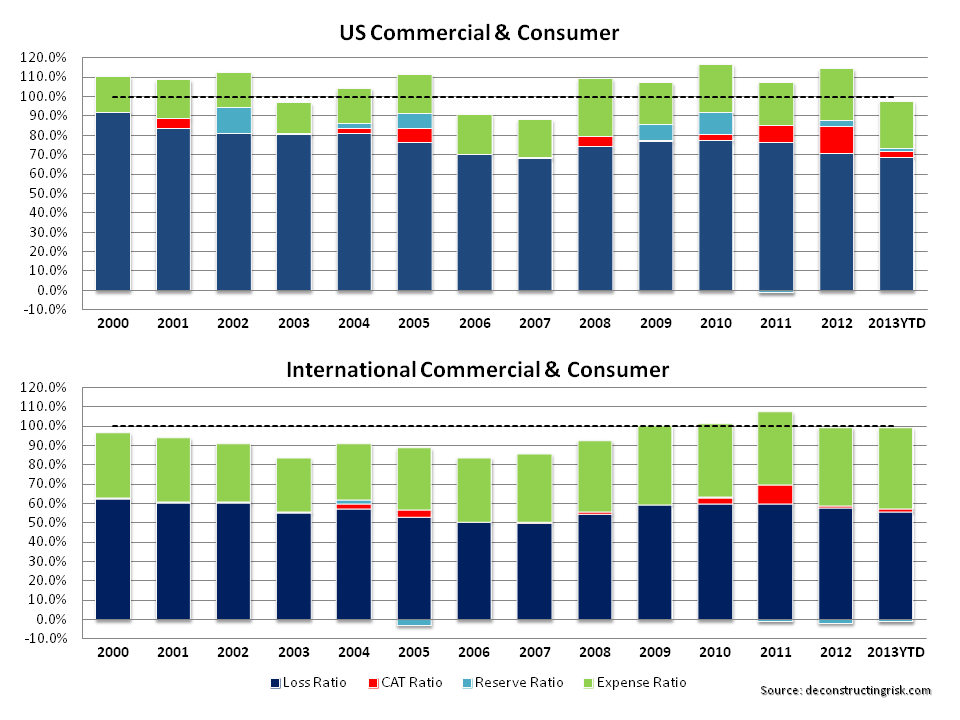
These changes in business mix make the usefulness of historical results difficult. However, I do think it’s important to try to understand the future through the past. Although the current segment reporting by AIG is detailed in terms of US & International commercial and consumer lines shown separately, this was not the case in the past. I went through past reports to get the combined loss ratio details on the US commercial & consumer and the International business segments, as per the graph below. I excluded previous business segments that are not relevant to the new AIG such as the Transatlantic Re and other P&C lines (other included the excess WC business that blew up in 2009 and 2010). Again, I would caveat any of the following statements with a warning about the changes in business mix.
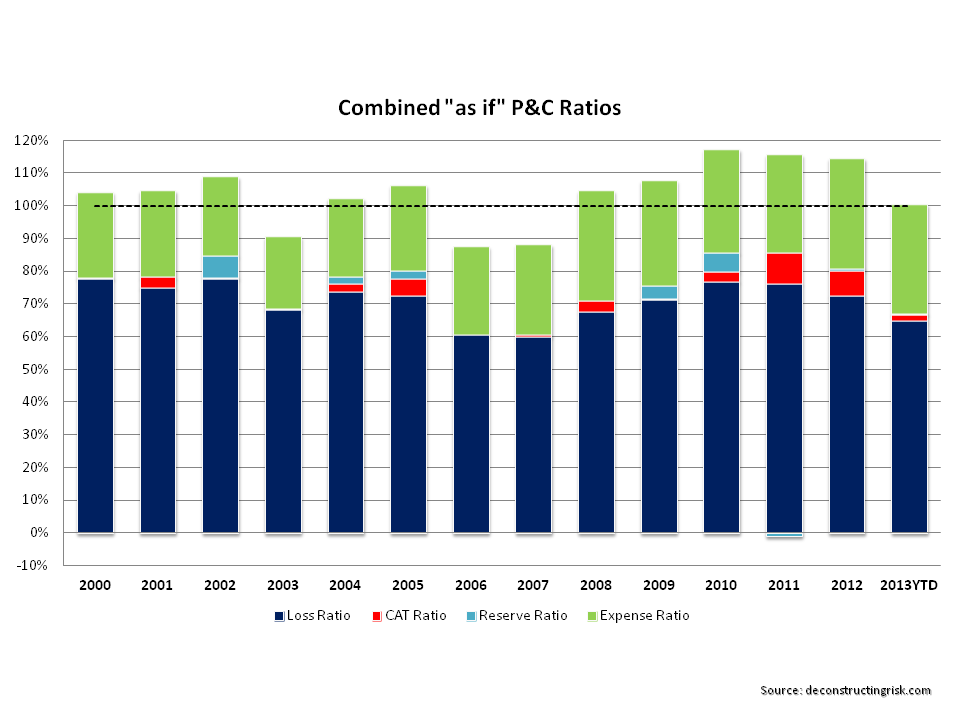
click to enlarge I then recalibrated the historical ratios using the 2012 business mix to get the “as if” graph below. Although these ratios need to be treated with caution, they do give some insight into the profile of the current portfolio. There is a clear favourable trend towards underwriting profitability with 2013 heading below 100% in the absence of significant catastrophe losses.
click to enlarge Positives for the US commercial business include a favourable pricing environment, as per the graph below, and a restructuring of the reinsurance protection including a new excess casualty quota share treaty and global per risk property treaty. Negatives remain question marks over the adequacy of reserves and the loss of senior underwriting talent to Berkshire’s new E&S insurer.
click to enlarge Also, the bad press around the brand must have impacted the quality of AIG’s business in the US. It is arguable that the impact may be less pronounced outside of the US and the ratio graphs above show that the results have been better from international business. The higher acquisition ratios in consumer, particularly on the international side, and the higher overhead as a result of the build out of the international business and the greater technical focus on underwriting & reserving is impacting the expense ratio and is not expected to level off until next year.
The increased diversification in AIG’s business mix is an obvious plus and makes AIG less dependent upon the volatility and uncertainty of excess long tail business. Whether AIG can succeed on a larger scale in the competitive and less specialty consumer lines is an unknown. After all, they are not getting the new business from thin air and are competing against strong local and global insurers for the business. Diversity for diversity’s sake (or more likely because of some quant misestimation of tail correlations in capital models) will, I suspect, become the industry achilles’ heel in the years to come. Notwithstanding this risk, at least AIG is growing in business lines where it has previous experience.
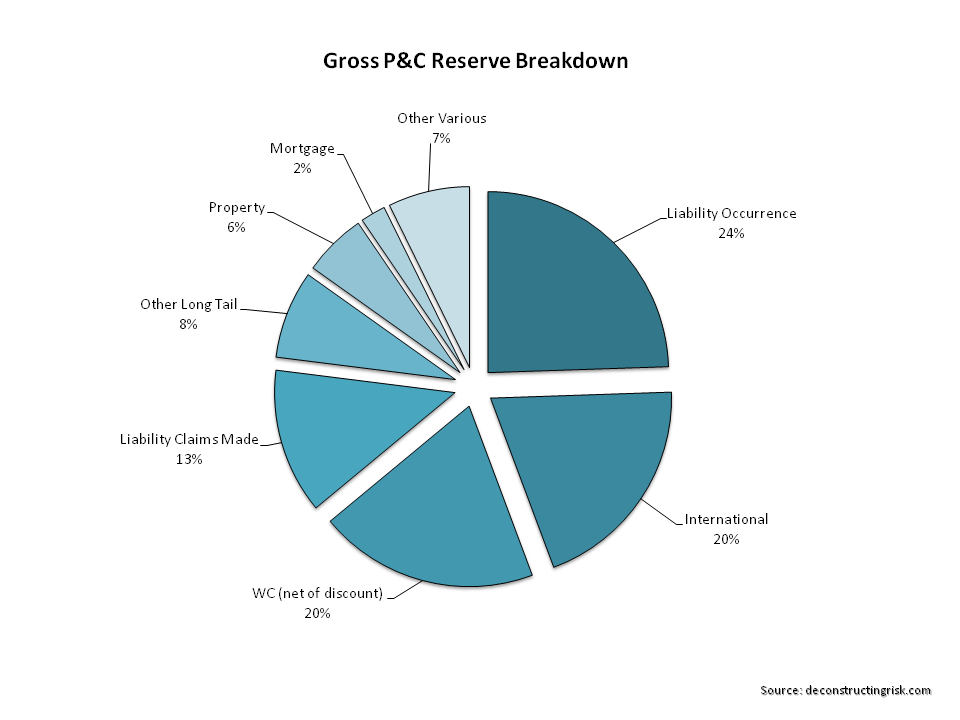
The graphs above exclude the asbestos and excess WC reserve strengthening from 2010 and 2009. I assume the 2011 deal with Berkshire on the bulk of AIG P&C’s net domestic asbestos takes care of any future deterioration with approx $1.5 billion of limit above the reserves transferred. As at year-end 2012, the gross reserve split is as per the graph below.
click to enlarge I also had a quick look through AIG’s Schedule P as at year-end 2012. The gross and net ratios, on an accident year basis, show that AIG has gained little benefit in the 2007 to 2012 period and likely justify AIG’s restructuring of their reinsurance programme. The increased percentage of reserves ceded in accident year 2012 indicates more use of their reinsurance. Without doing a complete actuarial review, it’s difficult to tell whether reserves are adequate. Based upon my experiences, my gut would say that the reserves look okay, not overtly strong or obviously weak. The 2007 to 2010 accident years look potentially vulnerable.
click to enlarge The excess casualty adverse development (approx $260m) in 2012 were based in part upon a refined actuarial analysis considering the impact of changing attachment points on frequency of excess claims and limit structures on the severity of excess claims. It amazes me that so many (re)insurers still use claims triangle chain ladder methods for excess business (check out the annual reports or SEC filings of some well know global insurers and you’ll see what I mean). AIG has strengthened its corporate actuarial function and its ERM framework is attempting to increase the feedback loop between accounting, claims, underwriting and actuarial. Time will tell whether the new processes will result in more timely reserve estimates and less prior year deterioration.
Investment income at AIG P&C has been remarkably stable in recent years when measured against net earned premium as the graph below illustrates. A healthy return on alternative investments of 14% in 2013YTD (compared to 7% 2012YTD) gave the returns in H1 2013 an additional boost. Compared to London based specialty insurers, the asset profile at AIG looks aggressive. Compared to other US based insurers, less so although the allocation of a third in municipal and structured bonds does put AIG on the aggressive side.
click to enlarge AIG stated that in 2013 “we expect to continue to refine our investment strategy, which includes asset diversification and yield enhancement opportunities that meet our liquidity, duration and credit quality objectives as well as current risk-return and tax objectives”.
Based upon the trends in the P&C business continuing and assuming no material reserve deterioration or catastrophe losses, I estimate that a base case for the P&C technical results for 2014 of $1.15 billion, whereby 2014 is a “normal” year. If investment income maintains a 14% of NEP return, my estimates would mean P&C pre-tax income of $5.85 billion for 2014.
Life & Retirement Division
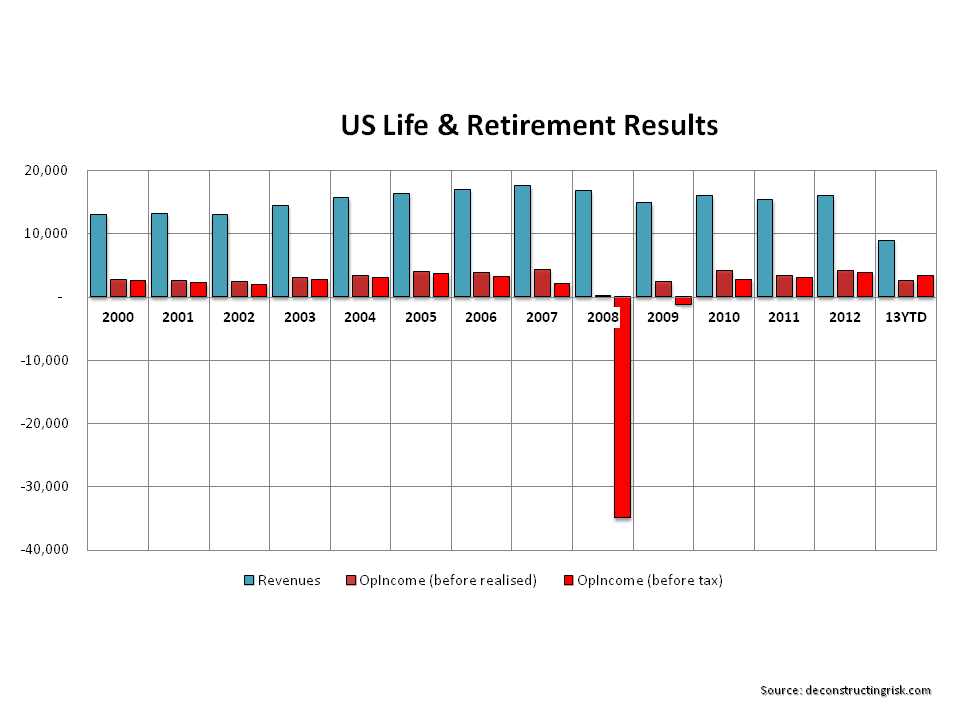
A quick review of the historical results of the US life and retirement business shows both the operating strength of the business and its exposure to market risk, as per the graph below.
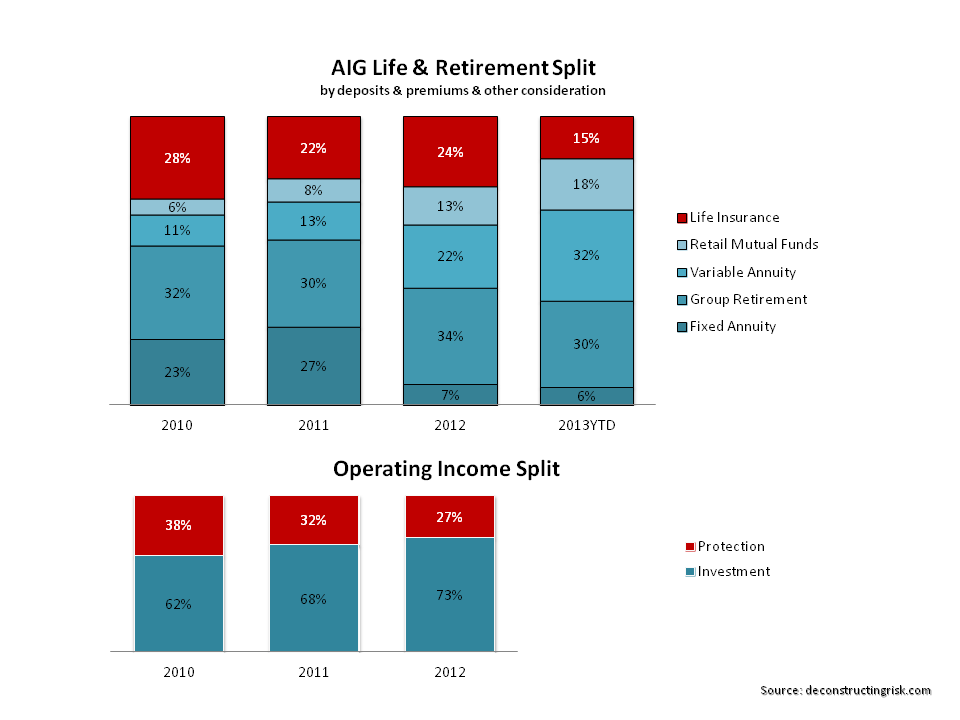
click to enlarge A breakdown of the products sold by AIG’s life & retirement division, as per the graph below, show the lower yields resulting from the global macro-economic quantitative easing has reduced demand for low yielding fixed annuity products and increased demand for variable annuity products with guarantee features. Positives cited by AIG in its increased focus on VA products include favourable market dynamics for these products (reduction in the number of suppliers & increased market demand) and strong de-risking features such as VIX indexing of rider fees, volatility control funds and required minimum allocations to fixed accounts.
click to enlarge The graph above shows a trend in operating income towards spread investment products away from protection (e.g. mortality & morbidity) products. To maintain the profits in its spread business, AIG invests approximately 75% of its life and retirement assets in corporate and structured bonds. As the graph below shows, since 2010, AIG is increasingly looking to enhanced yields by way of assets like commercial mortgage loans, private equity, hedge funds, other alternative investments, and common and preferred stock. AIG states that “opportunistic investments in structured securities and other yield enhancement opportunities continue to be made with the objective of increasing net investment income”.
click to enlarge The jump in net realised gains in H1 2013 is coming primarily from RMBS and CDO/ABS assets. It is impossible to predict where this item will go for the remainder of 2013 so I would simply select a base target of $4.25 billion in pre-tax annual income for the L&R division for a 2014 “normal” year, assuming stable markets and a continuation of low interest rate expectations for the medium term.
In relation to the challenges the low interest rate environment presents an insurer like AIG, they highlight the following mitigants they can take:
- Opportunistic investments in structured securities and re-deployment of cash to increase yields.
- Continued disciplined approach to new business pricing.
- Actively managing renewal credited rates.
- Re-priced certain life insurance and annuity products to reflect current low rate environment.
- Re-filed certain products to continue lowering minimum rate guarantees.
All of these actions sound fine in theory. Reality may present different challenges, particularly if interest rates increase sharply. Results from this business remain highly correlated to macro-economic events.
Other Business
And so, to the hodgepodge! This is the area of most uncertainty for the results of the new AIG. First, I looked at the items in this segment after excluding the recent impacts of AIA, Maiden Lane III, and discontinued businesses. The graph below shows the items to be considered.
click to enlarge AIG’s overall debt has reduced considerably over the recent past from over $100 billion at the end of 2010 to approx $43 billion as at June (split $15B financial debt, $21.5B operating debt, and $6.5B sub-debt). The interest expense relating to the other segment is projected to reduce by $200 million for 2014. Corporate expenses also look like running at approximately $1 billion per year, up from 2012, due to group wide initiatives like enhanced ERM. Legal reserves and other items, primarily charges on the extinguishing of debt, look impossible to predict in the short term. A base case for expenses of $3 billion looks realistic for a “normalised” 2014. Although an additional buffer of $o.5-1 billion for surprises could be justified, I am not assuming such in the base case.
On the income side, we need to look at the mortgage business, GCM and DIB.
Mortgage Insurance Business
The mortgage guarantee business has obviously had an interesting ride through the financial crisis. The graph below tells its own story.
click to enlarge There has been some debate on whether the United Guaranty units were strategically important to the new AIG. With a new capital maintenance agreement from group in July, that issue has been resolved. After taking their hits on their legacy business and with competitors withdrawing from the market, I am relaxed about AIG continuing in this business as the risk adjusted returns of new business looks attractive. As at Q2 2013, profitable business written from 2009 onwards represented over 60% of their risk in-force, which compares favourably to their peers still in the market. I would be comfortable with pencilling in $200 million of net income from this business in the short to medium term.
Global Capital Markets (GCM) and Direct Investment Book (DIB)
AIG describes GCM as follows:
“GCM consist of the operations of AIG Markets, Inc. (AIG Markets) and the remaining derivatives portfolio of AIG Financial Products Corp. and AIG Trading Group Inc. and their respective subsidiaries (collectively AIGFP). AIG Markets acts as the derivatives intermediary between AIG and its subsidiaries and third parties to provide hedging services (primarily of interest rate and currency derivatives). The AIGFP portfolio continues to be wound down and is managed consistent with AIG’s risk management objectives. Although the portfolio may experience periodic fair value volatility, it consists predominantly of transactions that AIG believes are of low complexity, low risk or currently not economically appropriate to unwind based on a cost versus benefit analysis.”
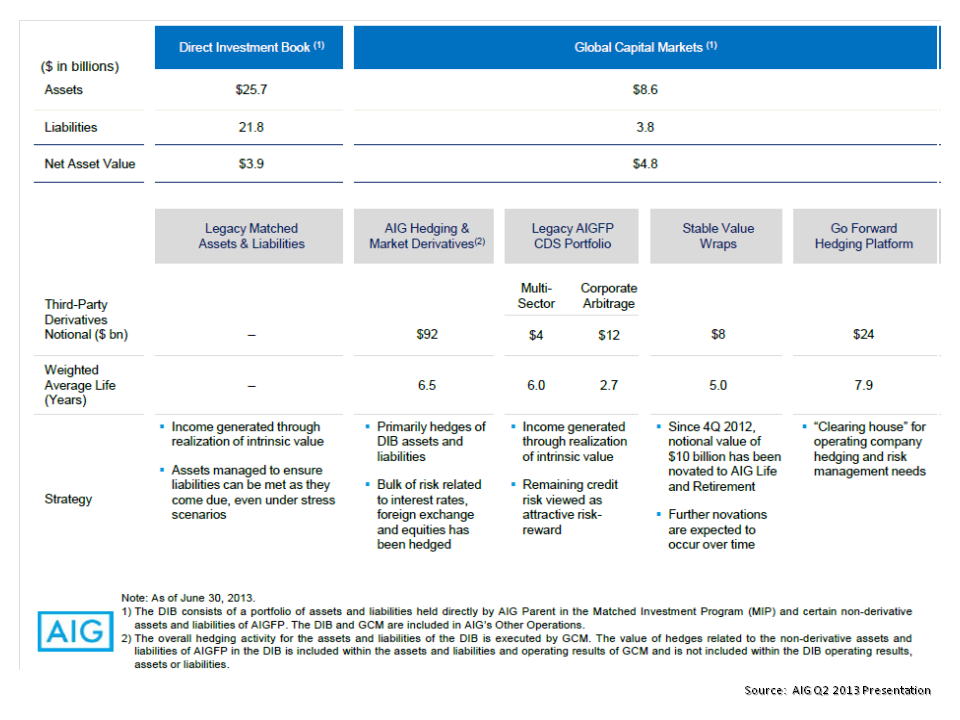
A slide from AIG’s Q2 presentation further outlines the portfolio of GCM and DIB, as reproduced below.
click to enlarge AIG describes the DIB as follows:
“DIB consists of a portfolio of assets and liabilities held directly by AIG Parent in the Matched Investment Program (MIP) and certain subsidiaries not related to AIG’s core insurance operations (including certain non-derivative assets and liabilities of AIGFP). The management of the DIB portfolio is focused on an orderly wind down to maximize returns consistent with AIG’s risk management objectives. Certain non-derivative assets and liabilities of the DIB are accounted for under the fair value option and thus operating results are subject to periodic market volatility.”
Another slide from AIG’s Q2 presentation further outlines the profile of DIB and is also reproduced below.
click to enlarge I really do not have any great insights on these two items. The average contribution of $1.3 billion from both items ($1B from DIB and $300M from GCM) since 2010 has obviously had the benefit of reducing interest rates and improving credit profiles. These favourable trends, particularly reducing interest rates, will likely not continue. Again, the results are heavily correlated to the macro-economic situation. The slides above also make it clear that whatever income these units have provided, they (particularly DIB) will have a reducing impact over time.
As a base case (and this is really nothing more than a guess), I would assume annual income of $1.0 billion a year reducing by 25% from 2014 onwards (may be pessimistic given 2013 YTD is at $1.3 billion!).
Conclusion and Valuation
My first observation would be how surprised I was to find that almost every aspect of the old AIG’s business model was impacted by the financial crisis and subsequent poor underwriting results. I obviously haven’t looked over the discontinued businesses like AIA which may have performed better and provided some balance. I had thought that the old AIG’s problems were centred around the losses from AIGFP and the securities lending programme, and the subsequent liquidity strains those businesses resulted in (in particular AIGFP’s decision to write CDS that allowed the counterparty to demand collateral at a level equal to their marks, akin to letting an insured dictate the reserves!). However, the red ink was all over the US investment life business, the mortgage business, the P&C business and the asset side. It would be fascinating to see a hypothetical analysis on the old AIG excluding the AIGFP business to see if it would have survived without a major recapitalisation.
The new AIG puts a lot of emphasis on its new ERM framework and importance of a more diversified and balanced business model. It is surprising therefore to see how much of the new AIG remains exposed to macro-economic events. A more balanced business may emerge as the life & retirement portfolio adjusts and as businesses like DIB runs off and GCM downsizes to a pure internal group AIG hedging intermediary.
Taking the base case estimates for a normalised 2014 outlined above and making some other assumptions on items such as tax, I am coming out with net income of slightly above $6.5 billion for 2014. This estimate may look pessimistic given H1 2013 net income is already at $5 billion but I am assuming that the income from DIB & GCM and that the realised gains and alternative investment yield for H1 2013 do not continue above trend going forward.
For what it is worth (and really this is nothing more than a guess), I estimate net income for AIG for H2 3013 of $2.25 billion, bringing the net income for 2013 to a whopping $7.25 billion!. It will be interesting to see the Q3 results, particularly to see if the realised gains and DIB/GCM positive results continue.
Assuming 40% of net income is used for dividend or buybacks, I therefore could see AIG reaching a book value per share of $70 by year-end 2014. If the trading multiple for AIG were to increase from the near 80% today to 90% by then, that’s a share price target of $63 or 20% above today’s $52. A 100% book multiple means a 34% upside. Obviously, if AIG’s execution was flawless and the “AIG discount” were to disappear into history and a more normal premium of 120% of book were to apply, then the upside is 60%!
The risks for AIG are however not insignificant and include:
- Risks from aircraft leasing business, whose sale is uncertain. Although not legally guaranteed by the Group, there is an implicit liability there to maintain value.
- The success of the new P&C business, particularly internationally, & the reserves, particularly for commercial business and business written from 2008 to 2010.
- Life margins given the pressures on yields and the enhanced market risk required to chase yield.
- The run-off of the DIB business and the operations at GCM. Exposure to sudden blow-up in risk positions always a concern
- Legal reserves could really explode now that cases are getting settled. Also, the new AIG remains exposed to claims on businesses they have sold, such as ALICO.
- As at the end of 2012, AIG had approximately $40 billion of NOL carry forwards. To maintain their value AIG had to put restrictions in place on ownership over 5%. Loss of these item could depress net income if full tax was paid.
- Finally, this is AIG and there is no doubt some potential for unexploded bombs that observers, like me, have missed
So bottom line, is AIG over or undervalued at $52? My response would be that I think its undervalued and a 12 to 18 month target of $60 to $70 per share doesn’t seem outrageous to me. That said, will I be running out and buying it? No, the upside/downside doesn’t feel right yet. I’d like to see what Halloween brings, particularly in relation to P&C reserves, realized gains and the items in the other bucket. I (as always with me) run the risk of being too late to the party if Q3 results are good and/or they announce juicy dividends or some similar shareholder action.
If you really fancy AIG and have the appetite, the 10 year warrants issued in January 2011 may be your thing. The strike is $45 and they currently trade around $21. There is some adjustment for dividends that I need to understand further. If I get more comfortable with AIG after the Q3, the warrants may be my preferred route to play (unless the dividend adjustment doesn’t compensate for not owning the stock) if the price is right.