Tag Archives: London based specialty insurers

Insurance M&A Pickup

It’s been a while since I posted on the specialty insurance sector and I hope to post some more detailed thoughts and analysis when I get the time in the coming months. M&A activity has picked up recently with the XL/AXA and AIG/Validus deals being the latest examples of big insurers bulking up through M&A. Deloitte has an interesting report out on some of the factors behind the increased activity. The graph below shows the trend of the average price to book M&A multiples for P&C insurers.

click to enlarge

As regular readers will know, my preferred metric is price to tangible book value and the exhibit below shows that the multiples on recent deals are increasing and well above the standard multiple around 1.5X. That said, the prices are not as high as the silly prices of above 2X paid by Japanese insurers in 2015. Not yet anyway!

click to enlarge

Unless there are major synergies, either on the operating side or on the capital side (which seems to be AXA’s justification for the near 2X multiple on the XL deal), I just can’t see how a 2X multiple is justified in a mature sector. Assuming these firms can earn a 10% return on tangible assets over multiple cycles, a 2X multiple equates to 20X earnings!

Time will tell who the next M&A target will be….

Hot Take-outs

In many episodes of fervent investment activity within a particular hot spot, like the current insurance M&A party, there is a point where you think “really?”. The deal by Mitsui Sumitomo to take over Amlin at 2.4 times tangible book is one such moment. A takeover of Amlin was predicted by analysts, as per this post, so that’s no surprise but the price is.

With the usual caveat on the need to be careful when comparing multiples for US, Bermuda, London and European insurers given the different accounting standards, the graph below from a December post, shows the historical tangible book value levels and the improving multiples being applied by the market to London firms such as Amlin.

click to enlargeHistorical Tangible Book Multiples for Reinsurers & Specialty Insurers

Comparable multiples from recent deals, as per the graph below, show the high multiple of the Mitsui/Amlin deal. Amlin has a 10 year average ROE around 20% but a more realistic measure is the recent 5 year average of 11%. In today’s market, the short to medium term ROE expectation is likely to be in the high single digits. Even at 10%, the 2.4 multiple looks aggressive.

click to enlargeM&A Tangible Book Multiples September 2015

There is little doubt that the insurance M&A party will continue and that the multiples may be racy. In the London market, the remaining independent players are getting valued as such, as per the graph below tracking valuations at points in time.

click to enlargeLondon Specialty Insurers Tangible Book Values

When the hangover comes, a 2.4 multiple will look even sillier than its does now at this point in the pricing cycle. In the meantime, its party like 1999 time!

Insurers keep on swinging

In a previous post, I compared the M&A action in the reinsurance and specialty insurance space to a rush for the bowl of keys in a swingers party. Well, the ACE/Chubb deal has brought the party to a new level where anything seems possible. The only rule now seems to be a size restriction to avoid a G-SIFI label (although MetLife and certain US stakeholders are fighting to water down those proposals for insurers).

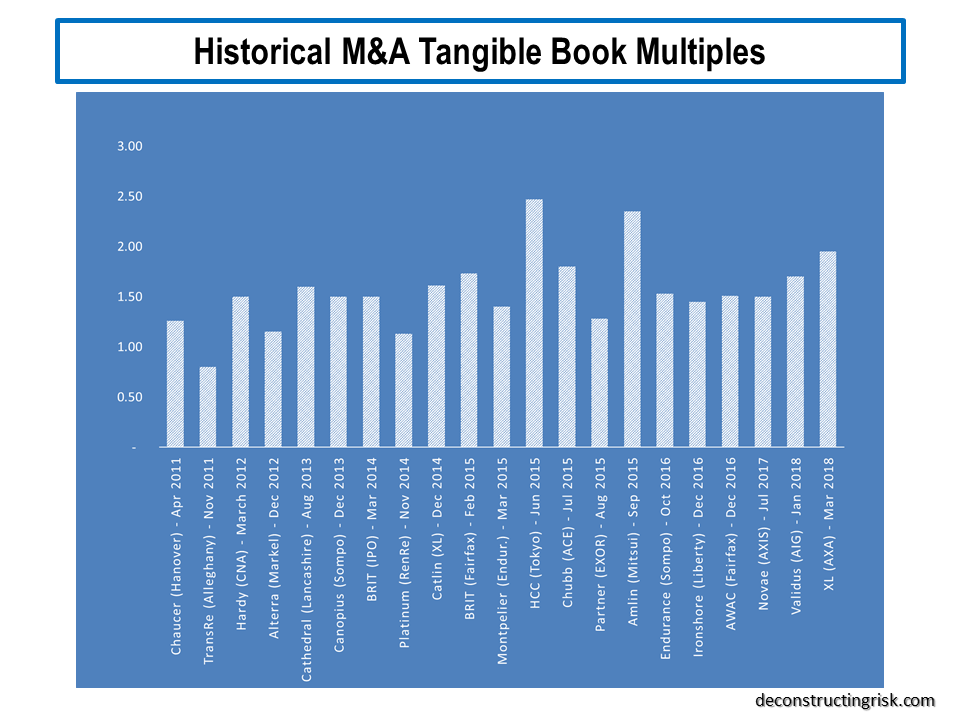
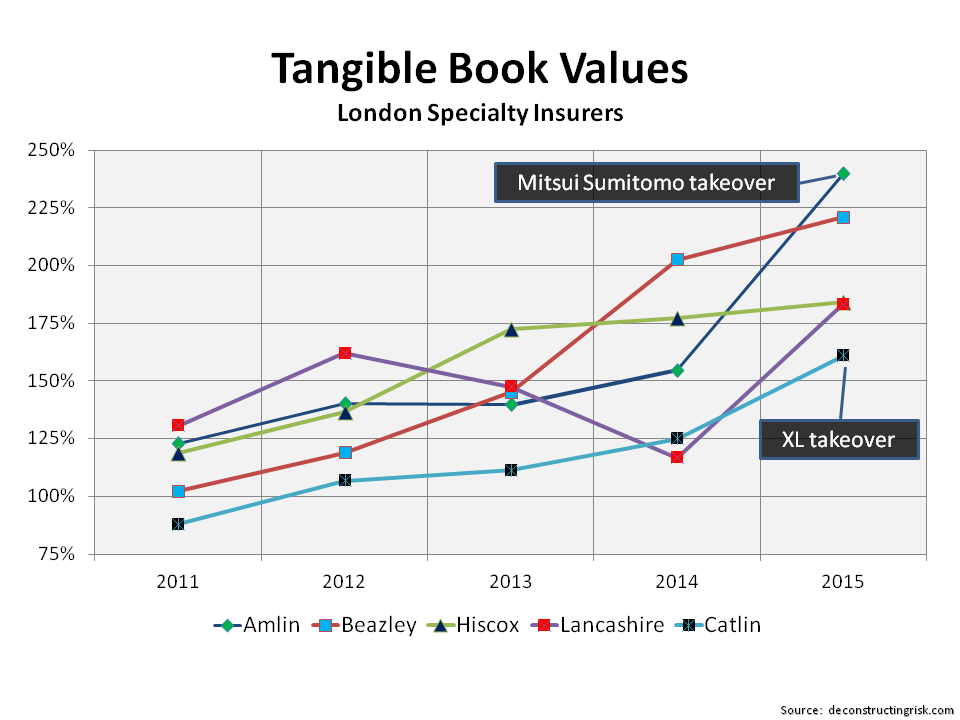
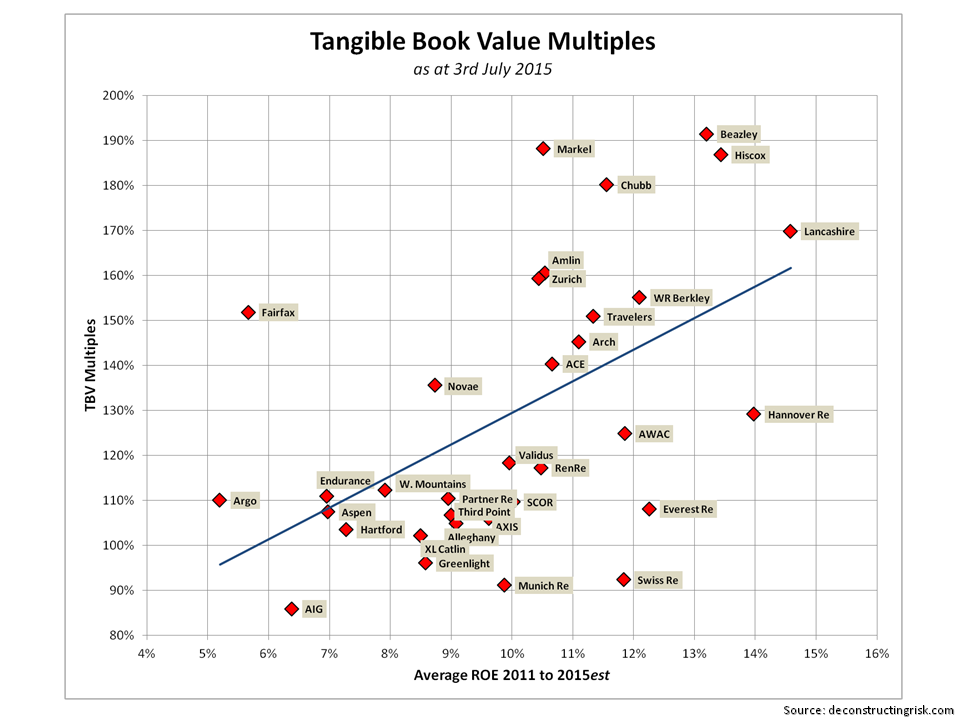
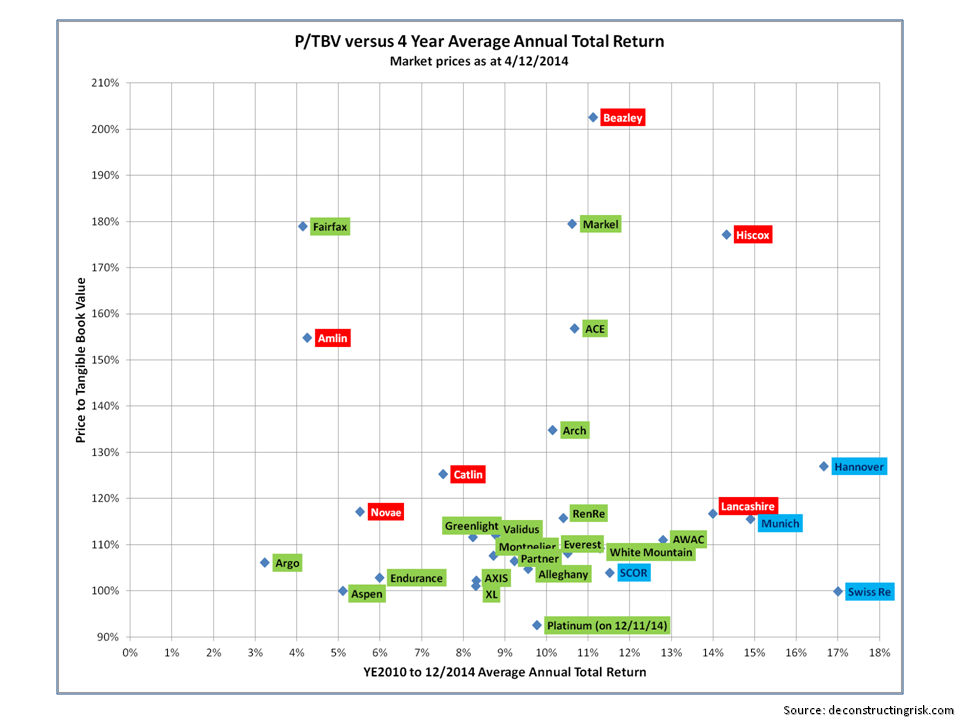
I expanded the number of insurers in my pool for an update of the tangible book multiples (see previous post from December) as per the graphic below. As always, these figures come with a health warning in that care needs to be taken when comparing US, European and UK firms due to the differing accounting treatment (for example I have kept the present value of future profits as a tangible item). I estimated the 2015 ROE based upon Q1 results and my view of the current market for the 2011 to 2015 average.

click to enlargeReinsurers & Specialty Insurers NTA Multiples July 2015

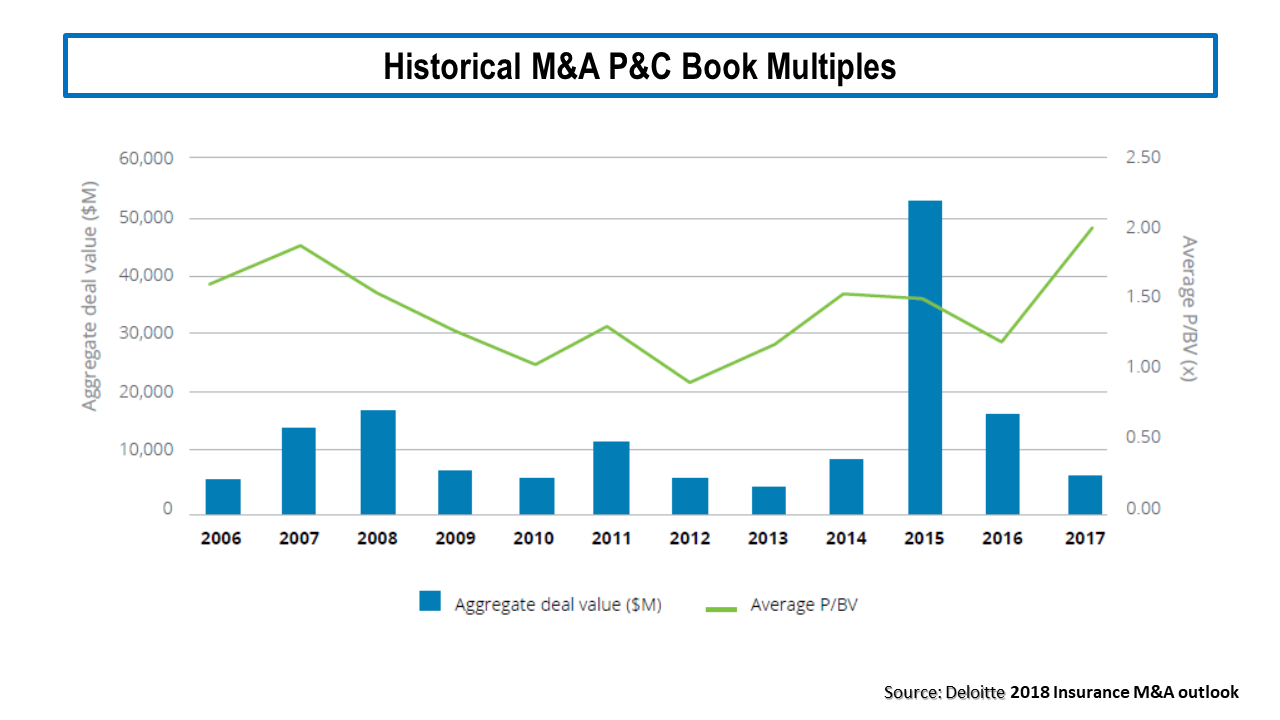
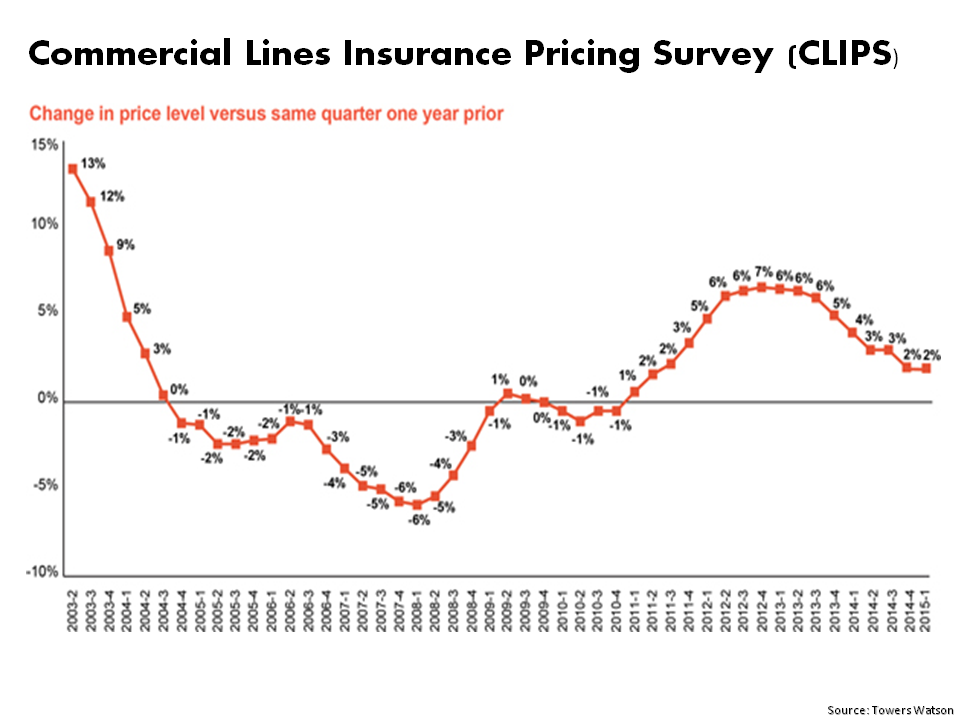
I am not knowledgeable enough to speculate on who may be the most likely next couplings (for what its worth, regular readers will know I think Lancashire will be a target at some stage). This article outlines who Eamonn Flanagan at Shore Capital thinks is next, with Amlin being his top pick. What is clear is that the valuation of many players is primarily based upon their M&A potential rather than the underlying operating results given pricing in the market. Reinsurance pricing seems to have stabilised although I suspect policy terms & conditions remains an area of concern. On the commercial insurance side, reports from market participants like Lockton (see here) and Towers Watson (see graph below) show an ever competitive market.

click to enlargeCommercial Lines Insurance Pricing Survey Towers Watson Q1 2015

Experience has thought me that pricing is the key to future results for insurers and, although the market is much more disciplined than the late 1990s, I think many will be lucky to produce double-digit ROEs in the near term on an accident year basis (beware those dipping too much into the reserve pot!).

I am also nervous about the amount of unrealised gains which are inflating book values that may reverse when interest rates rise. For example, unrealised gains make up 8%, 13% and 18% of the Hartford, Zurich, and Swiss Re’s book value respectively as at Q1. So investing primarily to pick up an M&A premium seems like a mugs game to me in the current market.

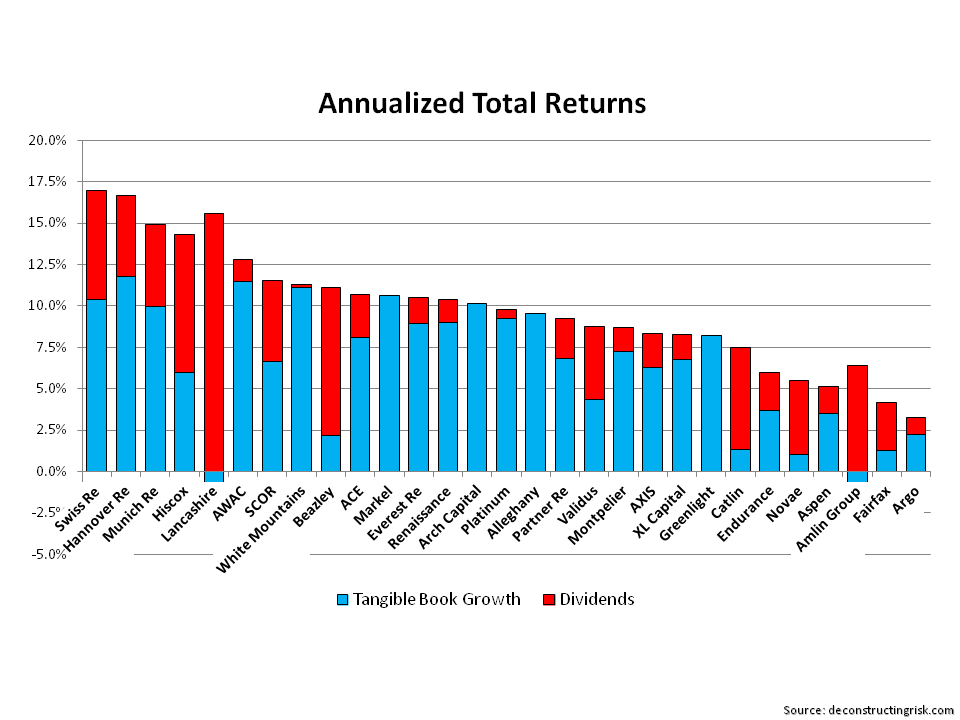
M&A obviously brings considerable execution risk which may result in one plus one not equalling two. Accepting that the financial crisis hit the big guys like AIG and Hartford pretty hard, the graph below suggests that being too big may not be beautiful where average ROE (and by extension, market valuation) is the metric for beauty.

click to enlargeIs big beautiful in insurance

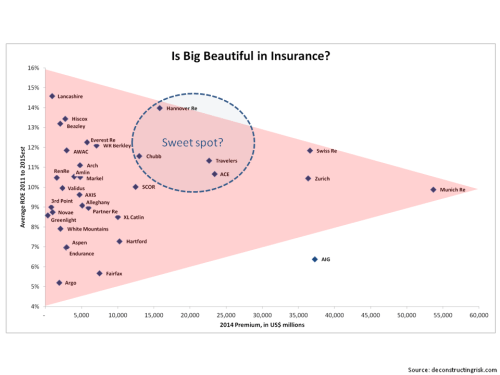
In fact, the graph above suggests that the $15-$25 billion range in terms of premiums may be the sweet spot for ROE. Staying as a specialist in the $2-7 billion premium range may have worked in the past but, I suspect, will be harder to replicate in the future.

Updated Insurance Multiples

It has been a while since I looked at net tangible asset multiples for reinsurers and selected specialty insurers (the last such post is here). Motivated by the collapse in Lancashire’s multiple (briefly mentioned in a previous post) since they went ex-dividend, I redid the tangible book multiple figures. Previously I have used average operating ROEs as the x-axis but this time I have used annualized total returns since year-end 2010 (to capture the 2011 catastrophe year with the recent results of the past 3 years). Annualized total returns are made up of tangible book growth and dividends paid in 2011 to today. The split between tangible book growth and dividends, on an annualized basis across the past 4 years, for each firm as per the graph below (when calculating tangible book values, as is my usual practise disclosed previously, I excluded all goodwill and intangibles, except for the present value of future profits (PVFP) for life reinsurance business for European reinsurers).

click to enlargeReinsurers & Specialty Insurer Total Return December 2014

The graph of tangible book multiples to annualized returns is below. [Note – although insurance accounting has converged somewhat in recent years, caution still needs to be taken when comparing UK, European, and Bermudian/US firms due to the differing accounting regimes under which results are reported].

click to enlargeReinsurers & Specialty Insurers NTA Multiples December 2014

I split the firms into different colours – green is for the Bermudian & US firms, red is for London market firms, and blue is for the European composite reinsurers. In terms of who else may get involved in M&A following the Renaissance/Platinum deal, its interesting to see most of the Bermudians bunched up so close to each other in valuation and return profiles. The higher valued and larger firms may be the instigators in taking over smaller competitors but it looks more likely that medium sized firms need to get with today’s realities and seek tie-ups together. Who will wait it out in the hope of some market changing event or who will get it together in 2015 will be fascinating to watch!!

Follow-on: To get an idea of historical changes in the tangible book multiples in the three groupings above, the graph below shows the trends. The multiples in each year are simple averages across the firms (and not all are at the same point in the year) but the graph nonetheless gives an idea of changing market sentiment. Although the London and European firms are a smaller sample than the Bermudian/US firms, the graph indicates that the market is confident that the underwriting indiscipline of years past have been overcome in the London market, thus justifying a premium multiple. Time will tell on that score…..

click to enlargeHistorical Tangible Book Multiples for Reinsurers & Specialty Insurers

Smart money heading for the exits?

Private equity is rushing to the exits in London with such sterling businesses as Poundland and Pets at Home coming to the market. PE has exited insurance investments, following the successful DirectLine float, for names like Esure, Just Retirement, and Partnership. It was therefore interesting to see Apollo and CVC refloat 25% of BRIT Insurance last week after taking them off the market just 3 short years ago.

The private equity guys made out pretty good. They bought BRIT in 2011 for £890 million, restructured the business & sold the UK retail business and other renewal rights, took £550 million of dividends, and have now floating 25% of the business at a value of £960 million. To give them their due, they are now committing to a 6 month lock-up and BRIT have indicated a shareholder friendly dividend of £75 million plus a special dividend if results in 2014 are good.

I don’t really know BRIT that well since they have been given the once over by Apollo/CVC. Their portfolio looks like fairly standard Lloyds of London business. Although they highlight that they lead 50% of their business, I suspect that BRIT will come under pressure as the trend towards the bigger established London insurers continues. Below is a graph of the tangible book value multiples, based off today’s price, against the average three year calendar year combined ratio.

click to enlargeLondon Specialty Insurers NTA multiples March 2014