So, a lot has happened with Centurylink (CTL) since my last post in November. CTL is down 30% since then (and over 40% since its August high) and the big news is the dividend cut of over 50% fueling further fears about growth. As a long-term investor in the telecom sector, such moves, although disappointing, don’t surprise me. It was always going to be a big ask to clean up some of the old CTL businesses in short order. As I stressed in previous posts on CTL (most recently here), investing in a business wireline telecom with legacy headwinds is high risk, some call them melting ice-cubes, and the dividend yield reflected that. I am accustomed to the bumpy ride it entails after 20 odd years of playing in this sandpit (see this old post)! Spending some of that juicy dividend to buy insurance through options may seem like a waste of money at the time, as all insurance does, but in this case, it has helped mitigate the downside pain. I have been buying puts here and there over the past year or so, particularly where I saw value (generally on the upswings). For example, last August when CTL was trading comfortably above $20, the January 2020 puts at a $15 strike were available around 80 cents whereas these options are now valued over $3. Before I go into detail on my thoughts on CTL following the latest results, I wanted to zoom out and look at the broader picture.
The business or enterprise wireline telecommunications market has flatlined, at best, and is in a transitional fight for its survival. Legacy services are rapidly been eroded by new technologies and the growth in newer services is struggling to make up for the top-line loss of legacy services (as per this post). Potential new sources of growth include deep fiber reach and transport needed for the much hyped 5G (see this post on 5G), increased traffic from new OTT video offerings from players such as Disney (see this post on telecom’s troubles), and the rapid increase in “as a service (aaS)” enterprise products enabled by the cloud era. I found a section from Verizon’s 10k captured the dynamic nature of the competitive enterprise marketplace, as below.
“In the Enterprise Solutions market, competition remains high, primarily as a result of increased industry focus on technology convergence. We compete in this area with system integrators, carriers, and hardware and software providers. In addition, some of the largest IT services companies are making strategic acquisitions, divesting non-strategic assets or forging new alliances to improve cost structure and focus on solutions which are growth catalysts for technology spending. Many new alliances and acquisitions have focused on emerging fields, such as cloud computing, software delivery, communication applications and other computing tasks via the network, rather than by the use of in-house machines. Carriers have also utilized acquisitions to make significant inroads into enterprise outsourcing markets that have long been dominated by the major IT outsourcers.”
So, what may the telecom provider of the future look like? In this report from last year PwC speculated on the profile of two successful telecoms of the future – BaseLink and DigiLife. BaseLink, after several unsuccessful attempts to diversify, found success in a strategy of focusing on the network as a service (NaaS) by automating its processes, reducing the workforce, densifying its fiber network through M&A, purchased 5G spectrum and modernising its network by embracing software-defined networking and network function virtualization. In addition, it focused on product offerings for specific industry verticals such as media, gaming, health, financial services, and autonomous driving. DigiLife, on the other hand, saw the need for a neutral global cloud-based data platform that offered consumers a trusted means of protecting their digital lifestyle foot-print from the giant technology firms whilst offering consumers the option to trade their data, either voluntarily or for compensation, through a data exchange. Obviously, both cases are purely hypothetical, but they do illustrate the tension in adapting business models from an engineering approach of providing capital intensive network products to a more service client driven approach that provides cost effective and flexible solutions. I do find it interesting that Verizon has taken on the NaaS term in its latest investor meeting when talking about services to be provided over its intelligent edge network (iEN).
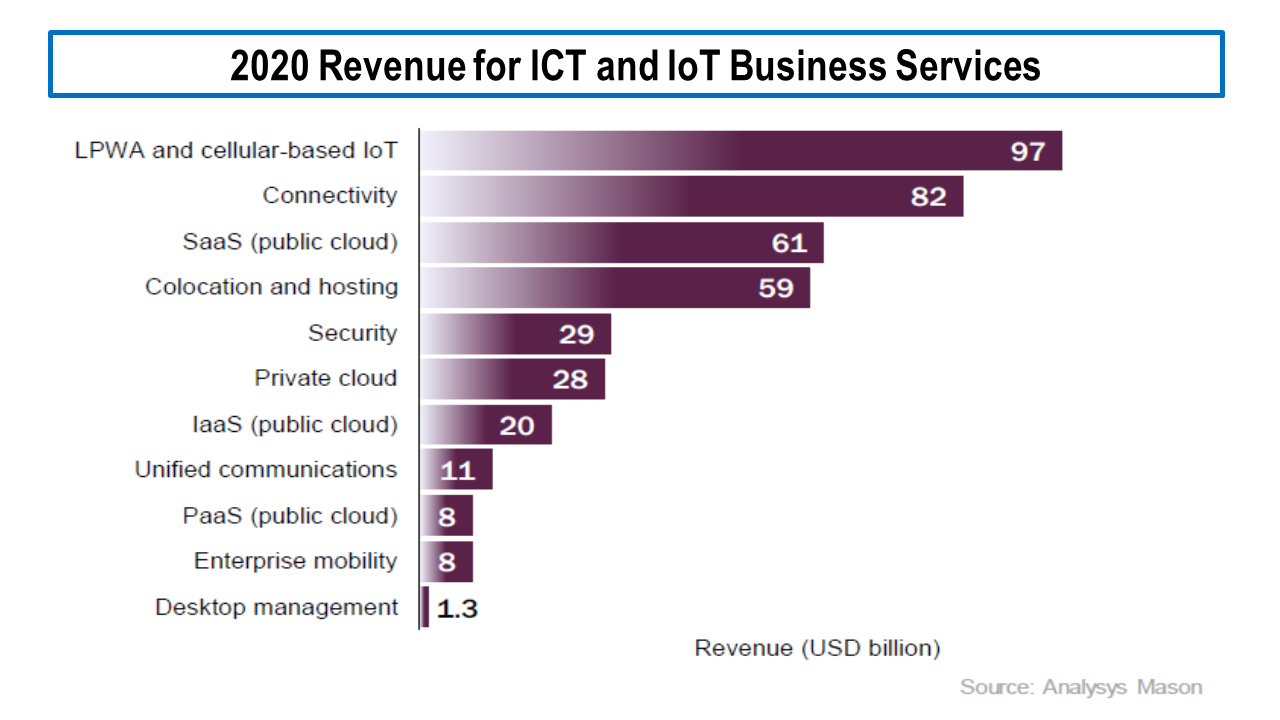
In this recent Analysys Mason report, commissioned to endorse a specific provider, they state there is “a time-limited opportunity to become the single point of contact for their enterprise customers’ information and communication needs if they put in place digital platforms that enable enterprises to buy business applications, IT infrastructure services, and cloud-based connectivity with a unified digital experience”. Analysys Mason calls this platform a “Enterprise Platform as a Service (EPaaS)” and estimates its value at $300+ billion on top of their enterprise connectivity market, as detailed below.
click to enlarge
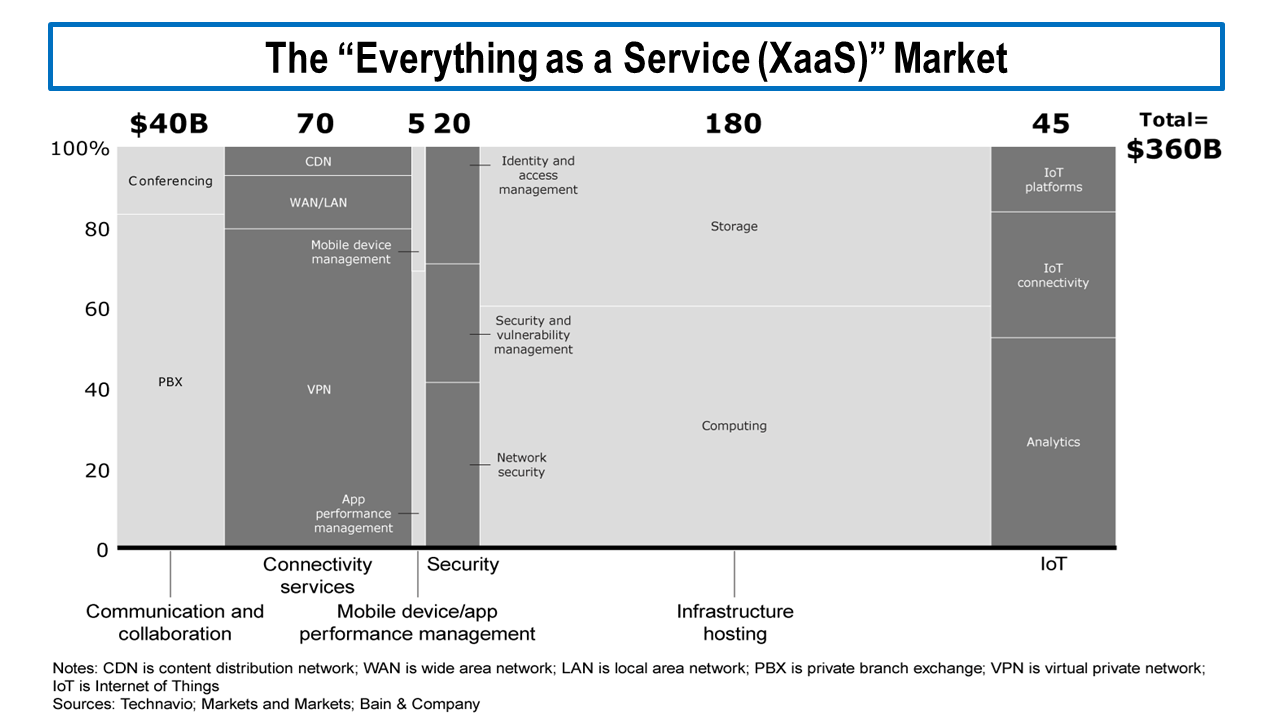
Bain has a more upbeat vision of the future for some telecoms (here) based upon an “everything-as-a-service” (XaaS) model with a $400 billion-plus addressable market by 2025, as per the exhibit below.
click to enlarge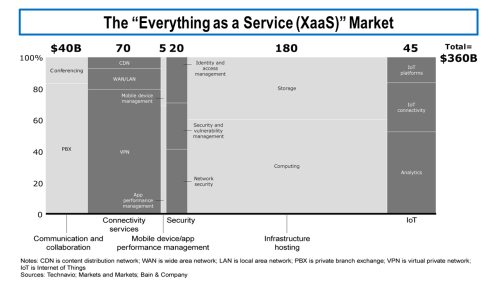
Bain acknowledges that “much of this business is already out of reach due to the scale and prior moves of massive hyperscale companies like Google, Facebook and Amazon, which aim not only to lead the public cloud and cloud services industries, but to expand into numerous related businesses as well”. The growth of the large public cloud providers has been much publicised and can be seen in the projections of the largest 3 providers below.
click to enlarge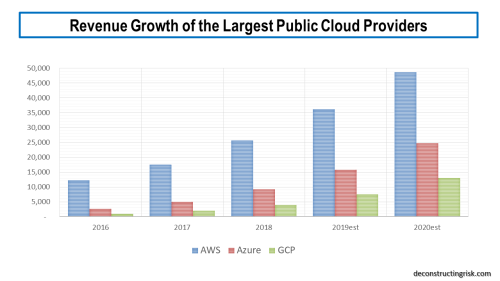
Hybrid cloud, where firms use a combination of their own on-premise infrastructure and one or more of the public firms, is the hot topic of the moment and highlights the need for enterprise specific connectivity and bandwidth to tie a firm’s assets to their public cloud provider(s). Although some firms will likely migrate all or most of their IT needs to the cloud, many will continue to run some applications on-premises for security and compliance reasons, whilst utilising the public cloud providers for other applications where scale and flexibility are needed (not to mention cost considerations). IDT claimed that 50% of IT spending in 2018 was cloud based. Firms such as IBM are betting big on the growth in hybrid cloud with their recent acquisition of Red Hat.
With a plethora of “aaS” acronyms, in September Gartner projected that 90% of firms will purchase public cloud services from an integrated infrastructure as a service (IaaS) and/or a platform as a service (PaaS) provider, stating that “strategic initiatives such as digital transformation projects resulting in the adoption of multi-cloud and hybrid cloud fuel the growth of the IaaS market”. A copy of the Gartner projections is below.
click to enlarge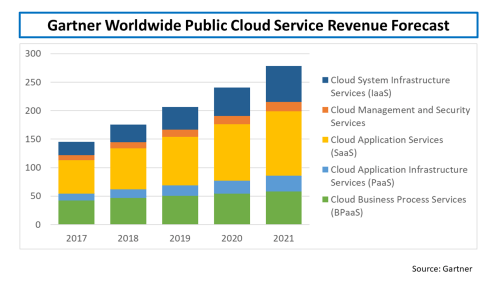
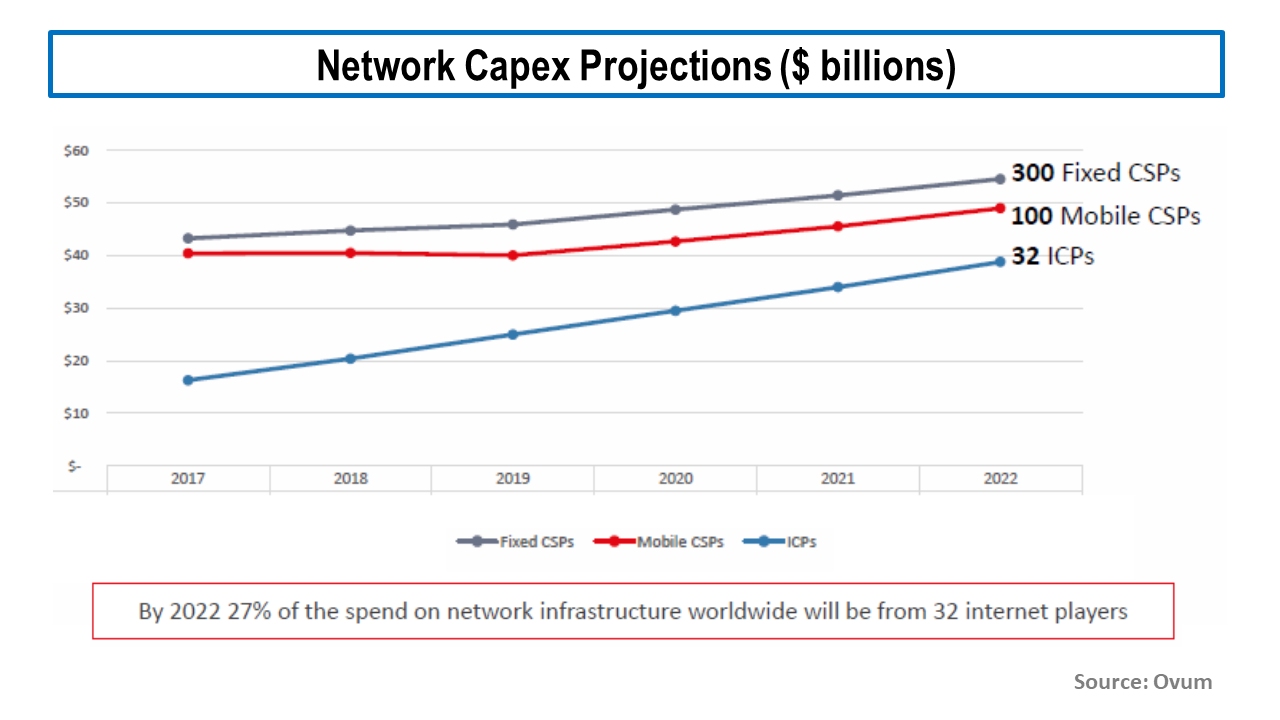
The recent announcement by Google of a $13 billion capital expenditure in 2019 on US data centres is a testament to how aggressive the big internet players are. The projections below from Ovum (from this presentation) estimate that the big players will be responsible for approx. 30% of all network capex by 2020.
click to enlarge
Notwithstanding the growth in the large cloud providers, Bain states that by 2025 “more than half of telecom B2B revenue growth will have been derived from XaaS models if these companies adopt strategies that differentiate them from hyperscale cloud players”. Clearly, a major challenge for traditional telecoms will require them to change their business models and cultures to adapt to the needs of providing capacity on a flexible “aaS” basis.
Bain emphasizes the need for telecoms to tackle legacy IT systems and organizational complexity saying, “companies that successfully transform their commercial engine reboot their IT systems, embrace the importance of data and artificial intelligence (AI), and significantly overhaul their operating models”. McKinsey, in this article, also states that “such a transformation encompasses both the digitizing of core customer journeys and internal processes, as well as using data to drive real insights”.
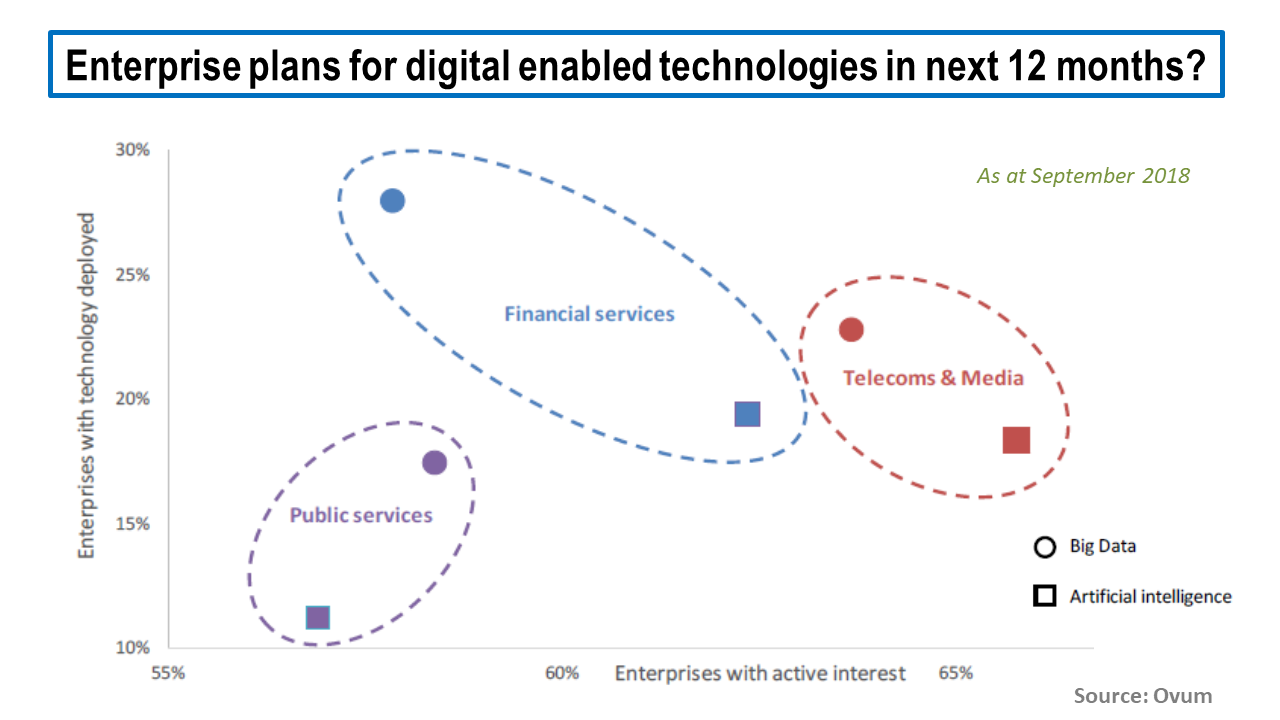
Some in the telecom industry are clearly taking the need to adapt and transform seriously, as a survey from last September by Ovum illustrates, as below. The top 3 areas of focus for telecoms were network fault predictions, customer operations, and self-optimizing networks.
click to enlarge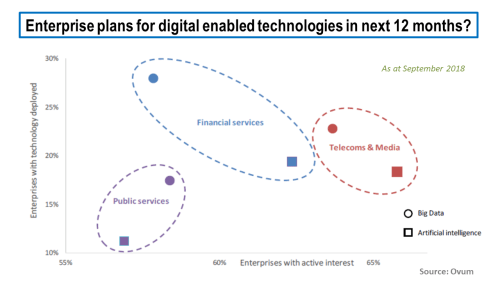
The challenge of adapting to the new market realities is a massive one, particularly when pitted against such agile and strong competitors. The case of AT&T, the largest wireline business telecom, illustrates the challenges, as its revenues over the past 3 years show.
click to enlarge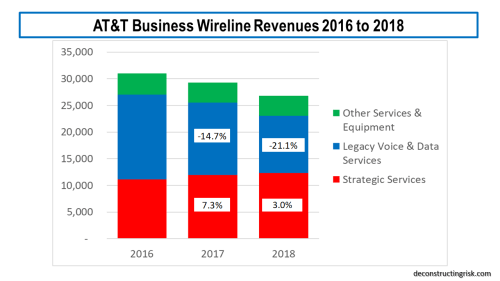
After adjusting for the impact of the new revenue recognition accounting standard ASC606, I estimate at a sequential quarterly growth in strategic revenues of 1.1% and sequential quarterly decline in legacy revenues of 3.7%, it will take another 7 years before the overall annual business levels reaches 2018 levels again! Clearly better growth is needed in strategic services. AT&T contend that they “are rapidly converting to a software-based network and managing the migration of wireline customers to services using IP” and this transition will continue “through at least 2020”. AT&T further contend that “software-based technologies align with our global leadership in software defined network (SDN) and network function virtualization (NFV)” and commit “to virtualize 75% of our network by 2020”. Verizon is also implementing rapid changes, reducing its workforce, and through their “One Fiber” initiative (building 25,000 miles of fiber outside their ILEC footprint) is “building a single highly resilient and scalable fiber network that will allow us to efficiently provide advanced data services to customers across our consumer, business and enterprise customer groups”. Verizon are calling their optimised fiber network that will operate across all their segments, including wireless, the Intelligent Edge Network. Both firms warn that legacy wireline services will continue to decline through 2019 and beyond.
Before I go into more detail on CTL, it’s worth reiterating the point that Jeff Storey opened the Q4 call on concerning the unique and extensive set of fiber assets that CTL has assembled. These assets are highly relevant for the future networked economy. Shareholder Southeastern highlights the high value that “entities such as infrastructure funds and cable companies have paid in recent private transactions for fiber assets”. The price that the public fiber assets of entities like Zayo and Lightpath (and possibly parts of Windstream now they are in Chapter 11) will likely highlight this further.
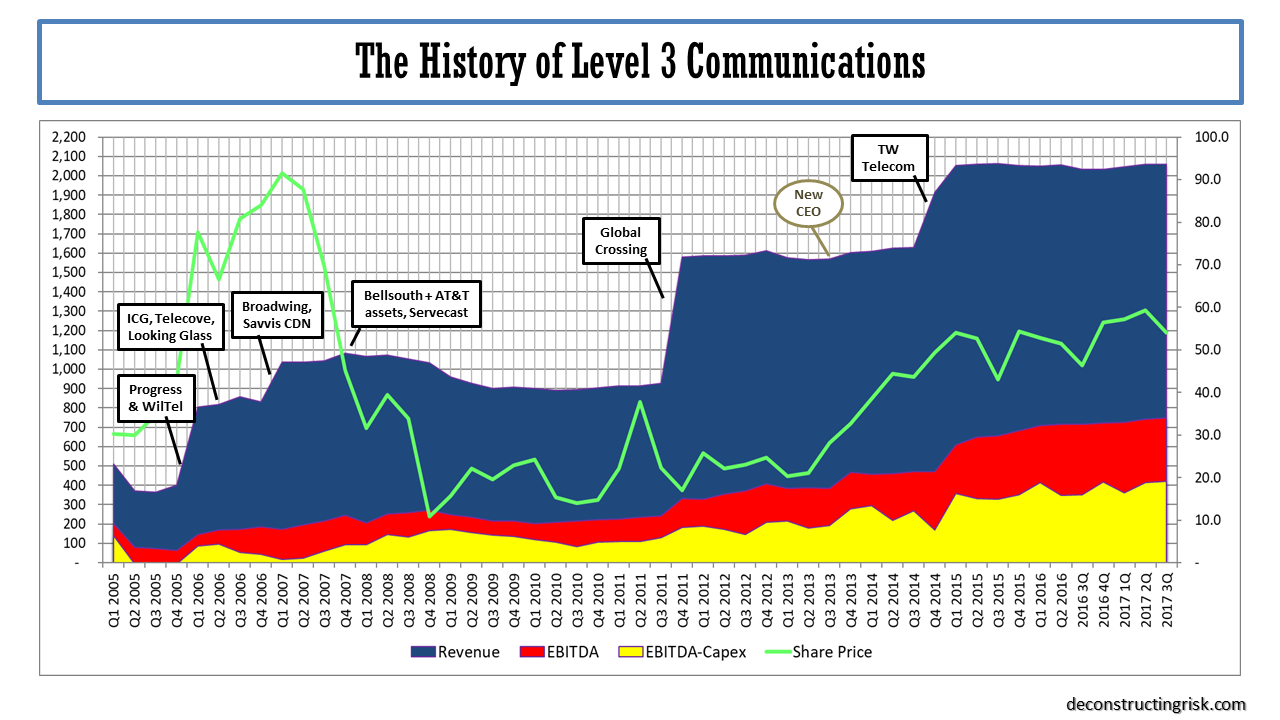
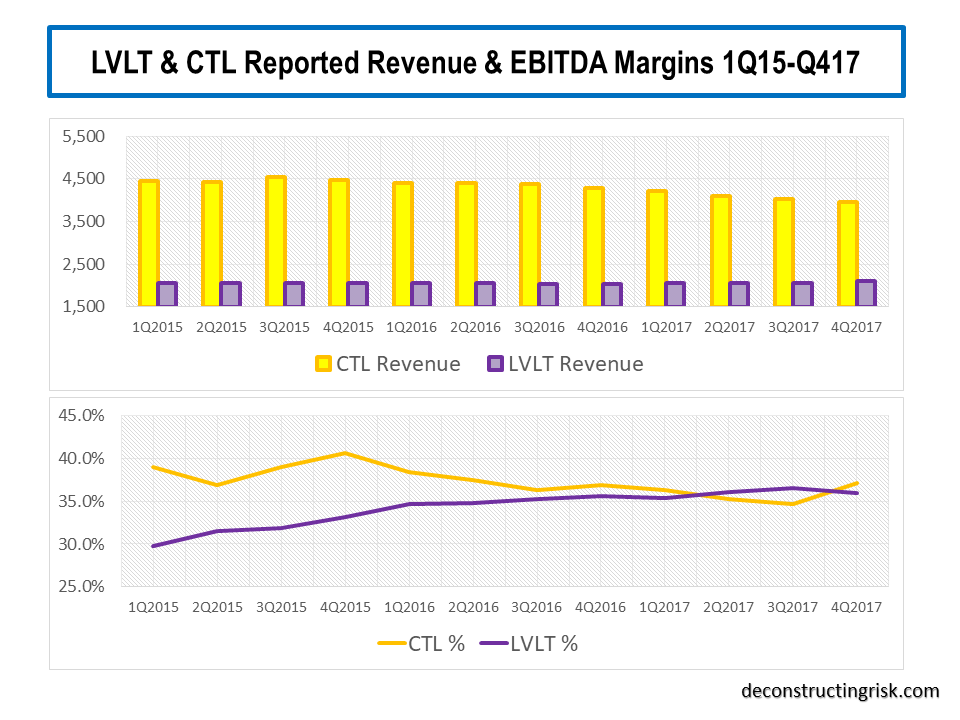
The operating history of Level 3 (LVLT) before the merger with CTL, as illustrated below, shows how a stable or growing top-line is a pre-condition to the market granting a suitable valuation. LVLT’s history also shows how it takes time to get to such a stable or growing top-line following a merger and overcoming the tailwinds of the old CTL’s legacy business may take longer than previous LVLT purchases!
click to enlarge
Despite the argument from CTL management that the reason behind the dividend cut was purely to deleverage quicker, thereby reducing credit risk and increasing their financial flexibility, the market suspicion is that the action reflects a weakening in top-line projections. I did think that the modest pace of previous projected deleveraging, getting below a 3 times debt to EBITDA level by 2023 in my previous base scenario (as per this post), could have created issues in a raising interest rate environment and/or an economic downturn. Since last year, reduced leverage targets at competitors AT&T and Verizon of 2.5 and less than 2 by year end 2019 illustrates heighten market concerns over debts levels (except for Charter which happily remains a market darling with leverage above 4). Notwithstanding this environment, CTL’s decision to cut the dividend so soon after rigorously defending the previous level does raise a red flag.
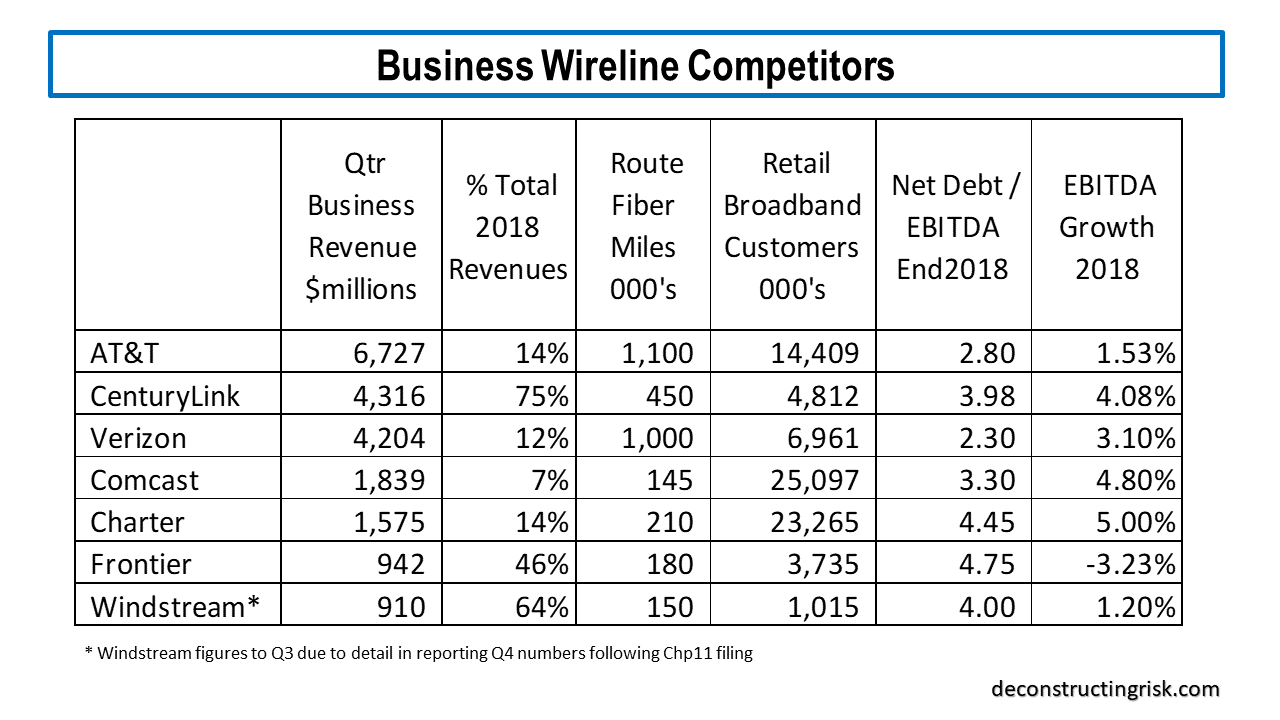
As per my previous post, I am just going to focus on a base and pessimistic case for CTL in this post. It is too early in the technology convergence story to explicitly factor in any upside from the issues discussed above. Take 5G, for example. The hype has gone into overdrive recently with both AT&T and Verizon claiming they will have extensive coverage everywhere and will be able to gain market share in product areas like wireless broadband. Admittingly, they both have over a million route miles of fiber (albeit that material amounts are in their ILEC regions), but they cannot be everywhere. 5G coverage for critical functions like autonomous driving or business critical IoT monitoring will need ubiquitous coverage, including backup options. Its not the same as mobile users putting up with bad reception in black spots. In Europe, the major carriers are already talking about sharing infrastructure. CTL has 450,000 route fiber miles with a global reach, 350 metro market networks, and 150,000 buildings on net. Given the need for dense fiber to support 5G networks, CTL should be able to pick up some business (even if it does loose some broadband customers!). The CEO of Orange Business Services Helmut Reisinger claims that by 2025 60% of data will be generated by enterprises. Below are a couple of metrics relating to the largest public US based business wireline (e.g. enterprise + wholesale) players for context.
click to enlarge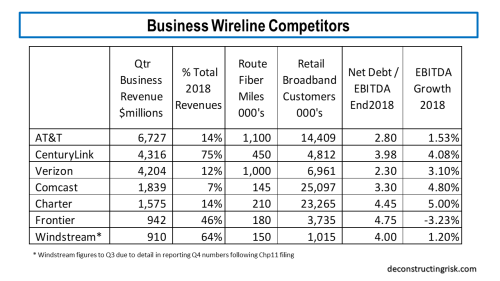
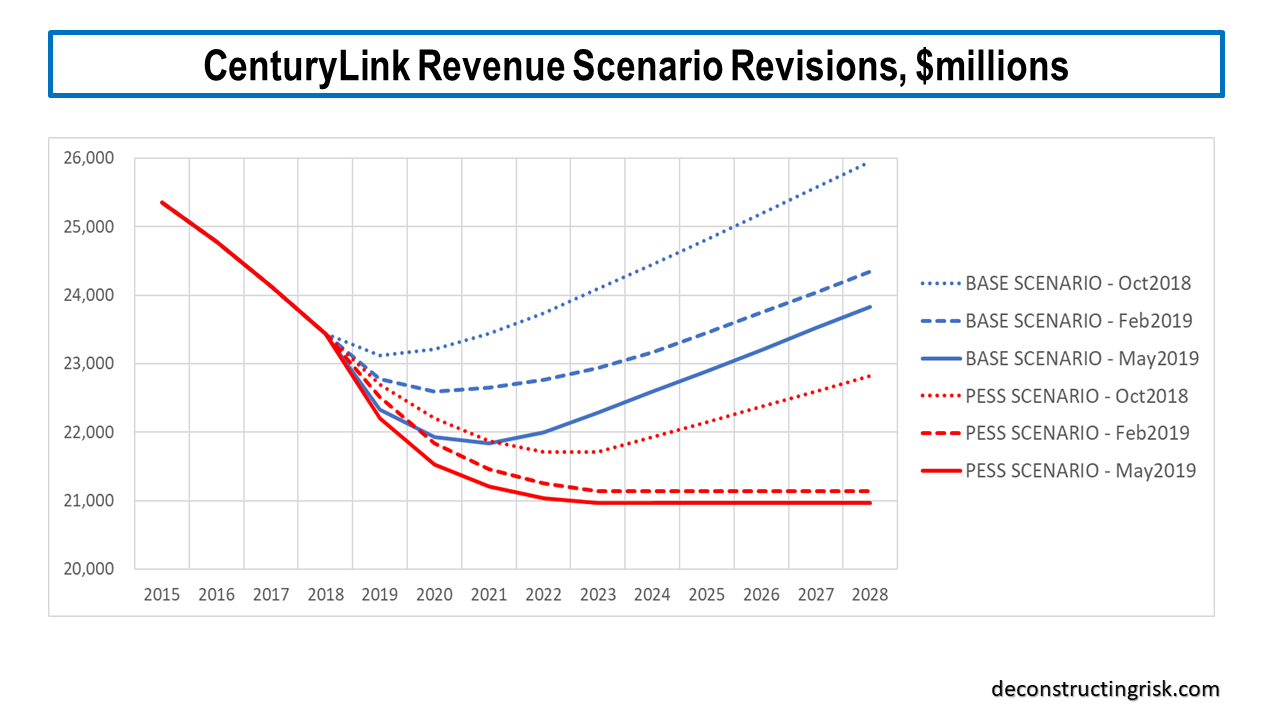
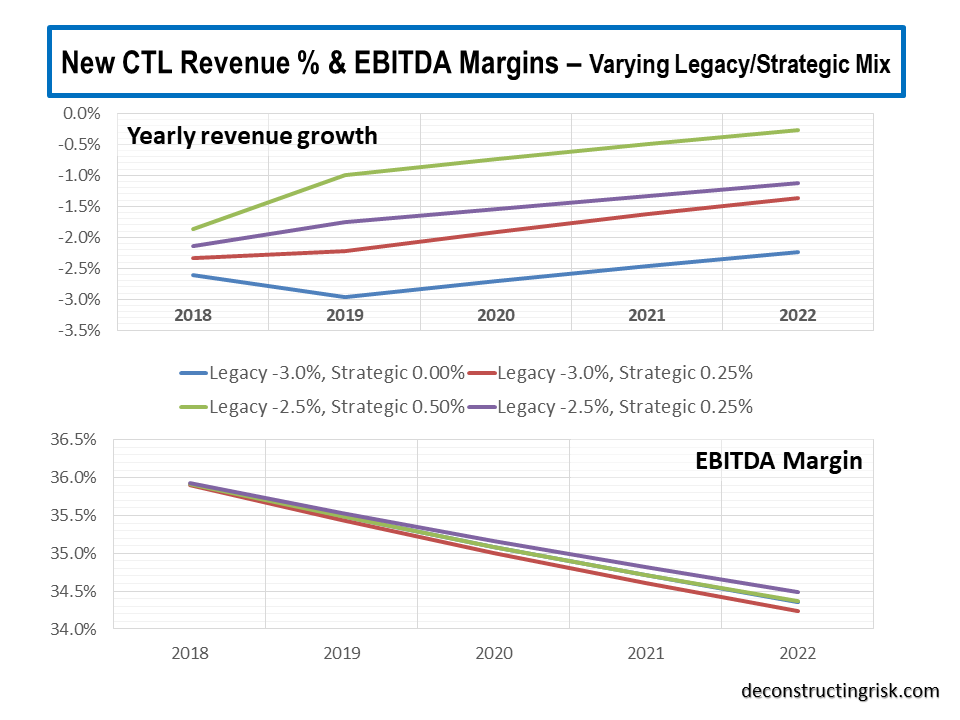
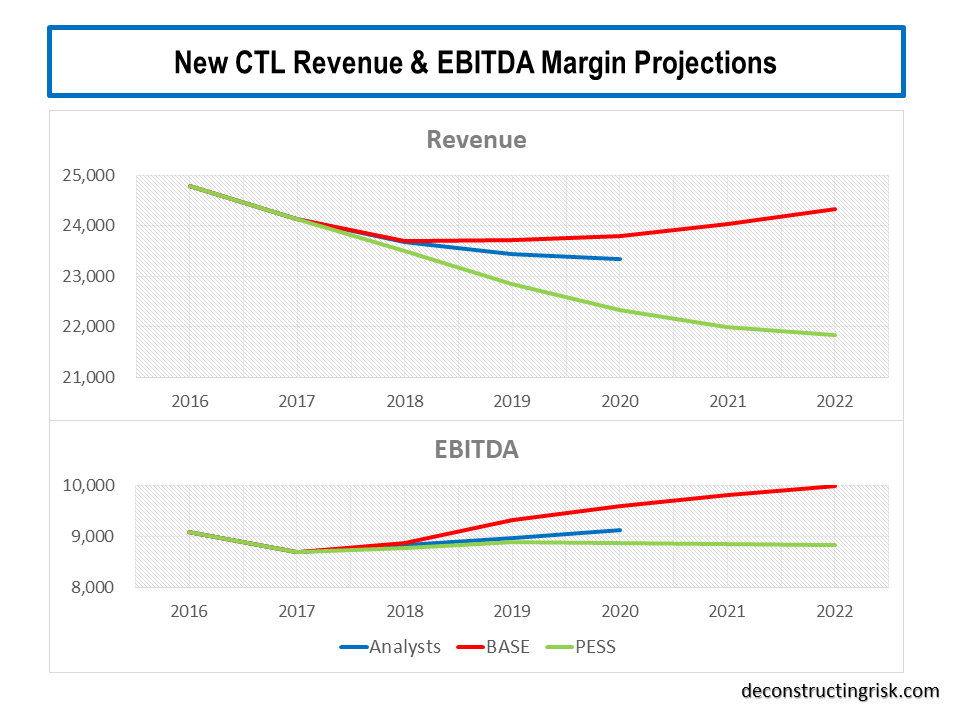
As a result of the dividend cut, I have reduced the top-line assumptions in my previous base and pessimistic scenarios, as illustrated below. My estimates are based upon a mix of 3 separate projections – using the trends by business unit, by product, and by assumed consumer and enterprise legacy versus strategic trends. One positive to come from the Q4 call was better insight into their 3-year operating plan and, of course, clarity on the quantum of further synergies and transformation costs.
click to enlarge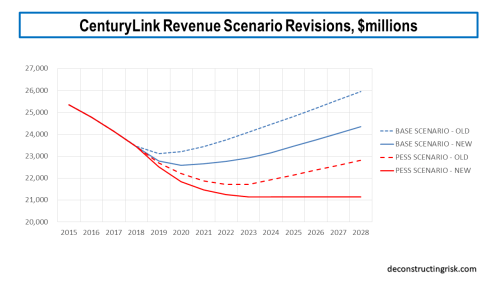
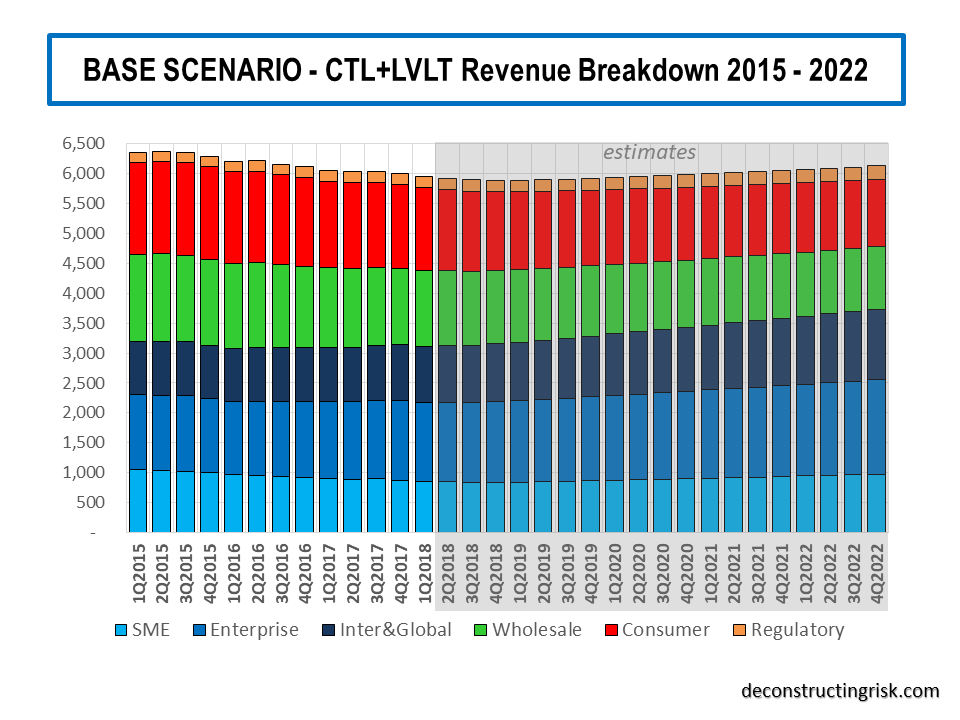
My new base scenario assumes revenue declines bottom out in 2020 at $22.6 billion representing an approximate 9% fall from the 2016 total, growing modestly thereafter at an average annual growth rate of 94 basis points for the following 8 years. My new pessimistic scenario assumes revenue declines bottom out in 2023 at just over $21 billion representing an approximate 15% fall from the 2016 total, and flat-lines thereafter.
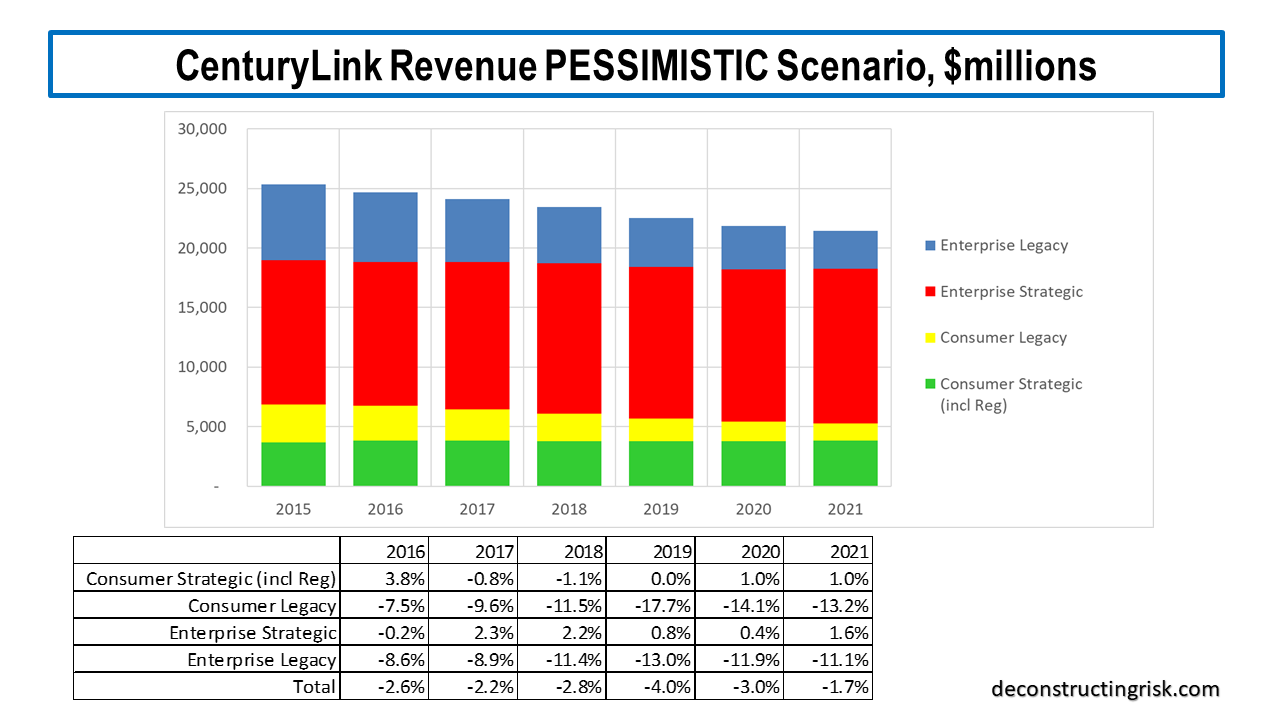
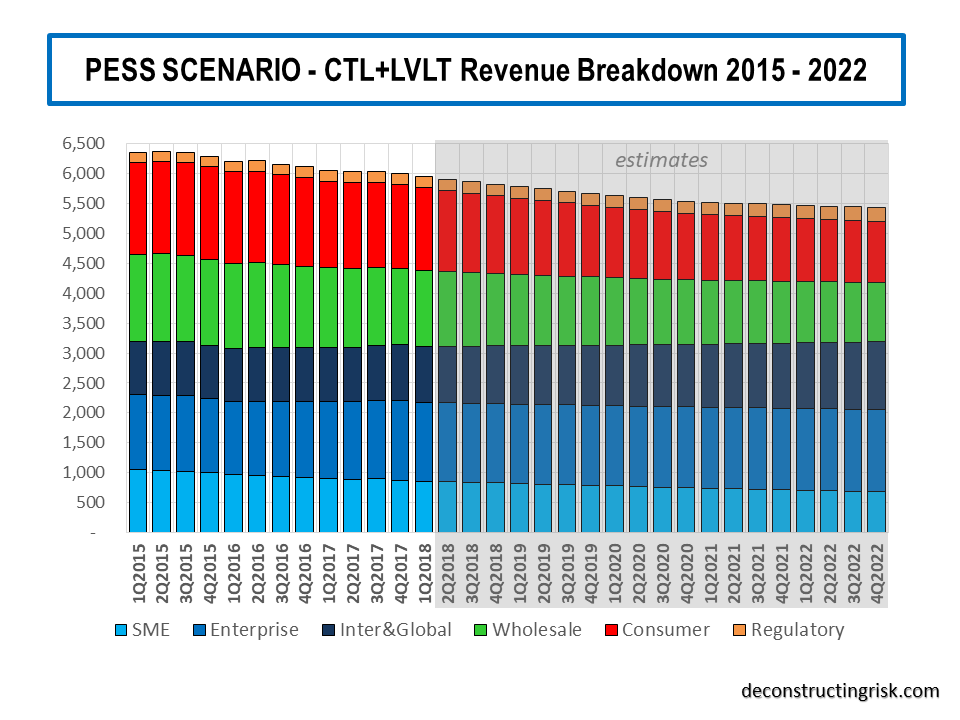
A breakdown of what each scenario looks like split between legacy and strategic revenues for the consumer and business segments is presented below. These figures are my guestimates based upon the pre-2017 CTL category splits and my estimates of LVLT’s legacy and strategic revenues. The 2018 and forward splits are my estimates, so caution is warranted in reading too much into them.
click to enlarge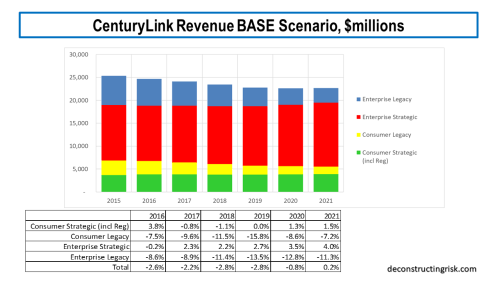
click to enlarge
The key driver of CTL’s future is the growth in the strategic enterprise line. For 2018, I estimate that it makes up 55% of total revenues (with legacy enterprise making up 20%). Strategic consumer business (including the regulatory business) makes up 16% with legacy consumer 10%. So, CTL must contend with the headwind of approximately 30% of its business being legacy (which by the way will never go to zero). The history of the telecom over the past 30 years shows that new technologies are constantly cannibalising the business, so today’s strategic will be tomorrow’s legacy! By way of comparison with AT&T on the business revenues only, I estimate that CTL’s strategy:legacy split is 73:27 with AT&T’s 46:40:14 strategy:legacy:other split (although care always must be taken over different firms’ definitions of strategic and legacy).
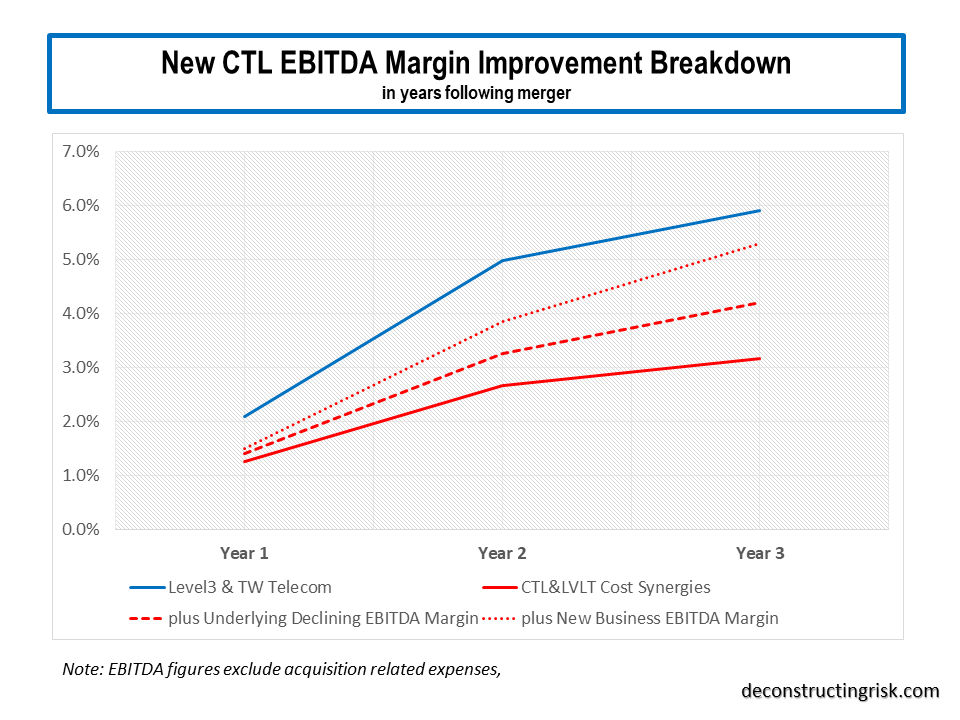
Now for the good news (and the only reason I still bother with this melting icecube)! The split between legacy and strategic is important as generally the legacy business is higher margin, particularly in the consumer segment (see this post for more on its importance). My model calculates the underlying EBITDA erosion as the legacy revenues burn off and then applies the synergies achieved to date and the newly announced transformation synergies over the next 3 years. I have assumed that the full $1 billion of synergies will be achieved over the next 3 years based on management’s record of execution in the past and based off the original $250-350 million of projected gross margin improvement from network groaming (which history shows they are expert at delivering on) as existing business is moved on-net that are included within the transformation cost projections. I have also assumed that the top range of the one-off costs of $650 million will be required. I am assuming the synergies will be realised roughly evenly over the next 3 years with the bulk of the one-off costs occurring in the first 2 years.
Another important consideration is the $100 million hit to EBITDA due to the change in the leasing accounting standard in 2019. CTL are the only company I can find that have explicitly quantified the impact of this change in their 2019 guidance.
My model takes all these items into consideration and calculates that, in the base revenue scenario above, CTL can achieve a 42% adjusted EBITDA margin by 2021 and I am assuming this margin is maintained thereafter. In the pessimistic revenue scenario above, CTL can achieve a 41.5% adjusted EBITDA margin by 2021 and I am assuming this margin is also maintained thereafter. By 2021, CTL have now guided for, including those synergies already achieved and those projected over the next 3 years, between 7.25% and 7.5% of margin improvement compared to the underlying EBITDA margin adjusted for the business mix changes and revenue declines.
In my analysis, I am assuming capital expenditure at 16% of revenues throughout. The changes under way in the sector, as outlined throughout this post, highlight the need for CTL to continue to invest in their network to remain competitive. CTL management have always stressed the importance of their network and operational cost advantage in competing in this sector (which their enterprise margins attest to) and given the cost transformation and investment programmes under way across nearly all their competitors, it is vital that they continue to invest to profitably grow their strategic businesses.
For the base scenario, I estimate they can meet the mid-range of the 3.25 to 2.75 leverage target by the end of 2021 whilst maintaining the $1 dividend, as illustrated below. I have not assumed there will be any further cash-flow special items such as tax rebates or a pension contributions above the usual annual $100 million. Such items, if positive, could get CTL to the lower range of their leverage target by end 2021. Assuming the 2018 results are normalised for the tax rebates, the additional pension contribution, the lease accounting change and 16% capex, my calculations in the base scenario point to ongoing improvements in the level of EBITDA and free cash-flow for each of the next 3 years, averaging above 2% and 8% respectively.
click to enlarge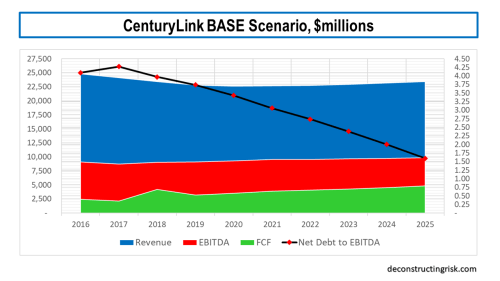
For the pessimistic scenario, I estimate they can get below the top of the 3.25 to 2.75 leverage target by the end 2021 if the $1 dividend is eliminated in 2020, with more aggressive deleveraging than the base scenario thereafter, as illustrated below. Again, I have not assumed there will be any further cash-flow special items. Assuming the 2018 results are normalised as above, my calculations in the pessimistic scenario point to a flat to small decline from the $9 billion level of EBITDA and free cash-flow growth averaging 5% for each of the next 3 years.
click to enlarge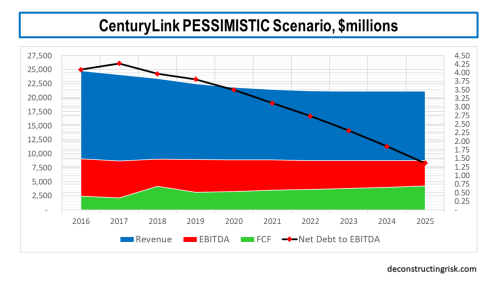
Based upon the improved credit profile of CTL in both scenarios and maintaining a WACC of 8% in my calculations (the termination growth rate is scenario dependent), it will be no surprise that my DCF valuation has improved for CTL to $30 and $18 for the base and pessimistic scenarios respectively (compared to $23 and $14 in my previous post). These figures suggest CTL is seriously undervalued over the medium to long term.
Most analysts have reduced their target price on CTL in recent weeks, often citing a lack of any upside catalysts, to around $14. The stock is currently trading around $13. A comparison of valuations with their main competitors, using average analyst estimates, is below, on the current enterprise value (EV) to 2018-2021 EBITDA multiples. I have not included Windstream (WIN) due to uncertainty over their future as a result of their current Chapter 11 status after their sale and leaseback arrangements fell apart. Also, the Frontier (FTR) figure is relatively meaningless given that their debt makes up 98% of their EV (due to their fall in EBITDA in 2018 and their 4.75 debt to EBITDA leverage). Although some commentators lump CTL in with WIN and FTR, the exhibit above showing metrics on wireline competitors shows the comparisons are superficial. If CTL were valued between a 6 and 6.5 multiple, which feels fair given their improving credit risk profile, the current share price should be around $20.
click to enlarge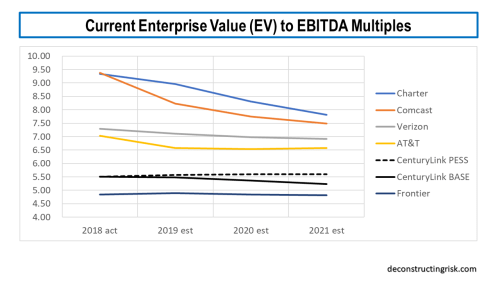
So, in summary, I remain bullish on CTL in the medium to long term but, like the analysts, I am concerned about catalysts for the stock in the short term. If my base scenario is correct, then 2019 will see revenue erosion similar to 2018 before stabilizing in 2020. I can see the share price go lower through 2019 if the current negative sentiment and top-line focus continues. I have therefore reduced my exposure and cashed in on some of the protections. I could be wrong, and CTL could again beat its guidance in 2019 and show the market that the dividend cut wasn’t about operating trends. I would be delighted to be proven wrong.
My take on the dividend cut is slightly different than the market. CEO Jeff Storey would have known that his credibility would take a hit over the dividend cut but I think he is considering the endgame. At 59 and with a history of heart problems, I think Storey is focussed on his legacy. In 3 years, a transformed and deleveraged CTL will be in a much stronger place than today.
It is possible that CTL could be a target before 2021, by say T-Mobile or Sprint if their deal falls apart. But none of their competitors (aside from Verizon which would have anti-trust issues) are strong enough currently. CTL has too much debt for a go private deal from the leveraged players (unless the buyer sees the upside of buying out the equity and accelerating the transformation and deleveraging initiatives). I can’t see any of the top 3 cloud players being interested (they get cheap capacity from the market as it is) or be allowed to by regulators. It’s possible one of the smaller cloud firms, like IBM, may consider making a sector changing strategic move, buts it’s a long shot. All in all, I very much doubt a buyer will emerge in the short-term although it will be interesting to see if Southeastern can unearth anything. More pain before more gain is an apt summary for the current downtrodden CTL shareholder.