Tag Archives: machine learning

CTL: Pain before gain?

Before I unleash my musings on the latest Centurylink (CTL) results, building on this recent CTL post, I will touch on some industry trends and some CTL specific items that are relevant in my opinion. As regular readers will know, the increased use of artificial intelligence (AI) by businesses, particularly in business processes, is an area that fascinates me (as per this post). How such process improvements will change a capital- and labour-intensive sector such as telecom (as per this post) is one of the reasons I see such potential for CTL.

Whilst reading some recent articles on digital developments (such as this and this and this), I cannot but be struck by the expanded networking needs of this future. All this vast amount of new data will have to be crunched by machines, likely in data centres, and updated constantly by real time data from the field. Networks in this era (see this post on 5G) will need to be highly efficient, fluid and scalable, and have a deep reach. Very different from the fixed cost dumb pipe telecoms of old!

CTL have outlined their ambition to be such a network provider and are undertaking a digital transformation programme of their business to achieve that goal. CEO Jeff Storey has gone as far as saying that CTL “is not a telecom company, but that we are a technology company”. Time will tell on that one!

Today, industry trends from business telecom revenues (i.e. enterprises from SME to global giants plus wholesale business) are flat to declining, as highlighted in this post. Deciphering recent trends has not been made any easier by the introduction of the new revenue recognition accounting standard ASC606. Where possible, the updated graph below shows revenues under the new standard from Q1 2018.

click to enlarge

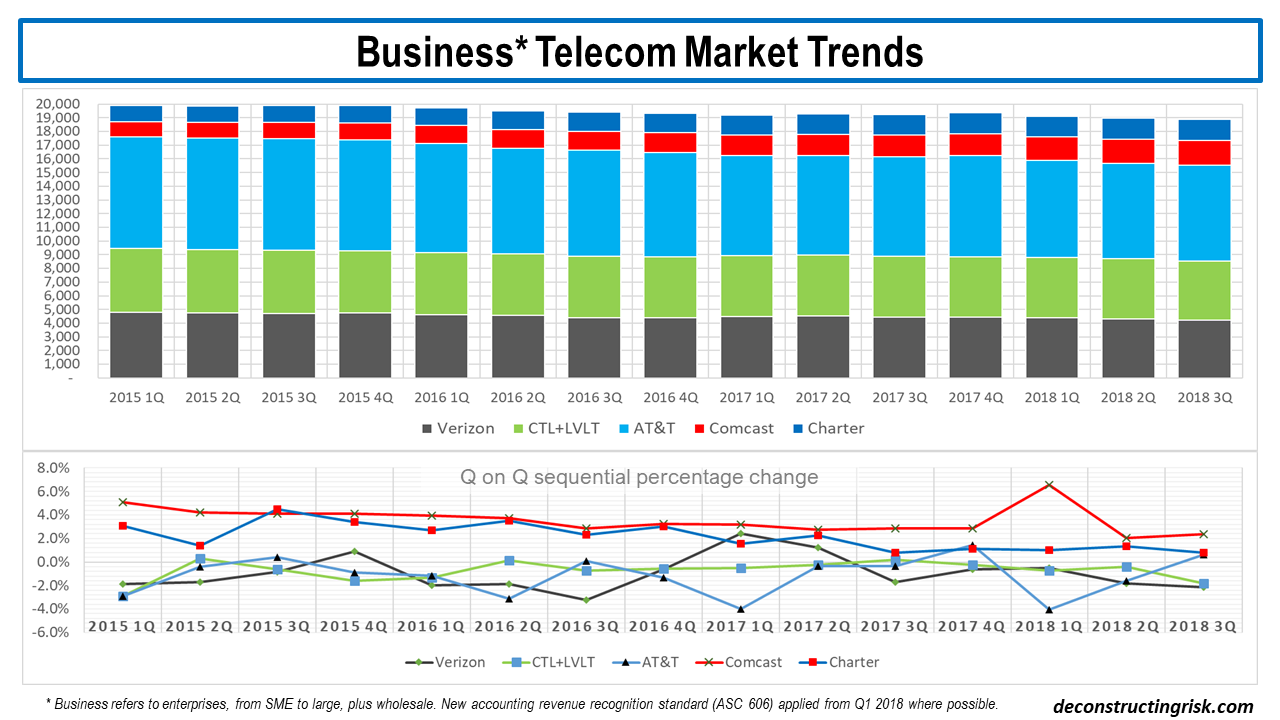
This data shows an estimated annual decline in overall annual revenues for 2018 of 1.5%, compared to 1.2% in 2017 and 2% for each of the preceding 2 years. Over the past 8 quarters, that’s about a 33-basis point sequential quarterly drop on average. Different firms are showing differing impacts from the accounting change on their business revenue. Comcast showed a 6.5% jump in Q1 2018 before returning to trend whilst AT&T showed a 4% drop in Q1 2018 before returning to more normal quarterly changes. Rather than trying to dismantle the impact of the accounting change, its easier to simply accept the change as its obvious the underlying trends remain, as the bottom graph above illustrates. Whilst accepting these 5 firms do not make up all the US, let alone the global, telecom market, some interesting statistics from this data are shown below.

click to enlarge

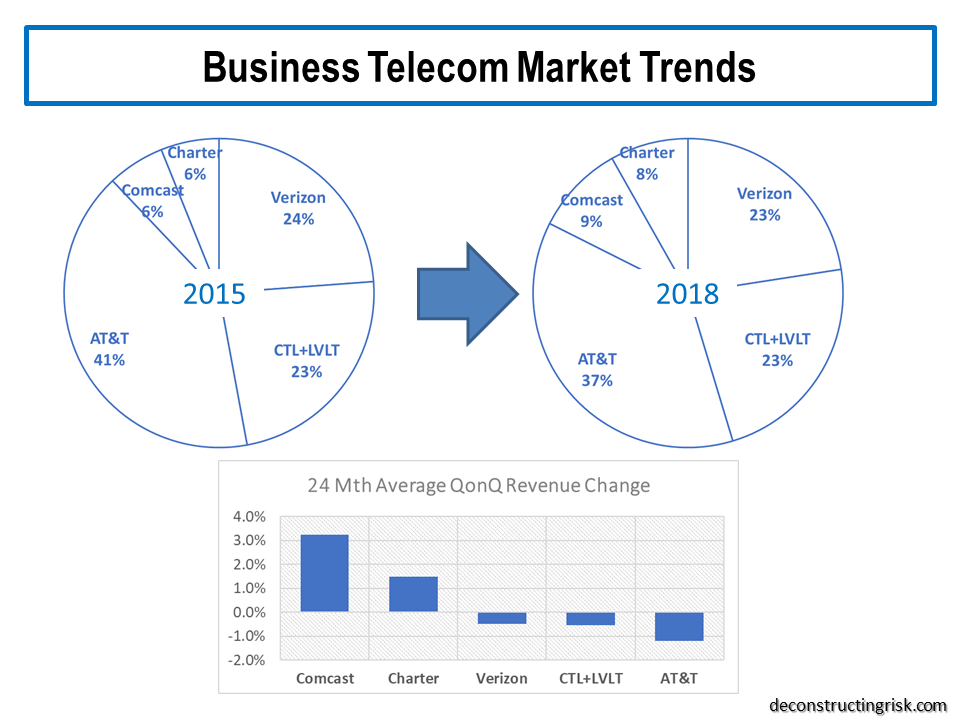
Although the accounting change has likely skewed figures in the short term, the exhibit above shows that AT&T is losing market share whilst the cable firms are growing their business revenues albeit from lower bases than the big players. Verizon and the new CTL have performed slightly below market trends (i.e. 50 basis point average quarterly sequential declines versus overall at 33 basis points).

Before I get onto CTL’s Q3 results, this article from Light Reading illustrates some of the changes underway at the firm to transform its business. The changes are centred around 4 themes – increasing network visibility, delivering business-owned automation, encouraging a lean mindset, and skills transformation.

On network viability, CTL is layering federation tools on top of its existing systems. Federated architecture (FA) is a pattern in enterprise architecture that allows interoperability and information sharing between semi-autonomous de-centrally organized lines of business, information technology systems and applications. The initial phase of this federation was with customer and sales systems such as those used for quoting, order entry, order status, inventory management and ticketing. The goal is to move towards a common sales ecosystem and standard portals that automate customer’s journeys from order to activation and beyond. A common narrative of CTL’s transformation is to give customers the tools to manage their networking capabilities like they do using the cloud. This is more of a network as a service or network on demand that CTL say is the future for telecom providers. This interview with the newly appointed CTO of CTL gives further insight into what the firm is doing in this on demand area, including changes underway to meet the increased SD-WAN demand and the upcoming deluge of data in the 5G era.

Business owned automation is allowing different business units to own their own automation projects, whilst been supported by centralised centres of excellence in areas such as robotic process automation (RPA), digital collaboration, mobility and analytics. Training is provided by the centralised units. Empowering the business units encourages a key cultural change in adopting a lean mindset across the firm. Ensuring that people in the firm are retrained and motivated is a core part of CTL’s plans as change only comes from within and as the firm continues to downsize (they have already reduced headcount by 12%) its important that staff morale and skills transformation is a focus as the business changes.

So, moving on to CTL’s Q3 results. The market has not reacted well to the Q on Q drop of 3.6% in revenues, with weakness seen across all business segments, and the stock is trading down around $19 as a result. The trends highlighted above have been exasperated by CTL dropping or renegotiating lower margin business such as contracts involving customer premises equipment (so called CPE). Of the $80 million quarterly revenue drop (under ASC606) in Q3, $30 million was attributed to the culling of low margin business. The remaining $50 million drop is about twice the average drop in recent times, thereby raising analyst concerns about an increase in trend revenue declines.

However, there are two points to note here. Firstly, using revenue figures before the application of ASC606, the net drop was more in line at $37 million (i.e. $67-$30) and comparable with the Q2 non-ASC606 drop of $40 million. Secondly, and more importantly, the trend is lumpy and given CTL’s transformation focus, it makes total sense to me for CTL to cull low margin non-network centric revenues. Management were explicit in stating their intention “to focus on the network-centric things” and that this business is “distracting our organization and it’s not giving us anything, so we’ll stop it”. To me, that demonstrates confidence in the direction of the business. As Storey emphasised, when referring to culling low margin business, “we manage this business for free cash flow, free cash flow per share, these are good things to be doing”.

Analysts concern that cutting expenses longer term cannot be a sustainable business plan without revenue growth at some point is certainly valid (and is one of the key risks with CTL). Indeed, I estimate that there is about $900 million and $500 million of quarterly legacy business and consumer revenues respectively (about 15% and 10% of total quarterly revenues) that could fall off at an accelerated pace as CTL refocuses the business over the medium term. CTL’s return to top line growth could be several years off yet. More on this later.

Another area of concern from analysts was the fact that CTL will spend approx. $500 million less on capex in 2018 compared to original projections (with levels projected to return to a more normal 16% of revenues for 2019 and beyond). This could be interrupted as a desire not to invest in the business to inflate free cash-flow, never a good sign for any company. However, again management explained this as a desire to refocus capital spending away from items like copper upgrades and towards strategic areas. They cited the approval to bring on-net another 7,000 to 8,000 buildings and the use of strategic targeting of capex (using AI) across consumer and business geographies to maximise returns in urban areas where 5G infrastructure will be needed in the future. Again, a more disciplined approach to capex makes total sense to me and demonstrates the discipline this management team is imposing on the business.

What seems to have been missed in the reaction to Q3 results is the extraordinary progress they have made on margin improvements. The EBITDA margin again grew to 39.3% with the projected operational synergies of $850 million now targeted to be achieved by year end. Management are keen to move the focus from integration to digital transformation from 2019. Achieving the targeted operational synergies so soon, particularly when we know that network expense synergies do not come through until 2 to 3 years after a merger, is an amazing achievement. It also highlights that their projected cost synergies of $850 million were way way under-baked. As I highlighted in this recent CTL post, I suspected this under-baking was to protect against the risk of any further acceleration in the underling margin erosion at the old CTL business as legacy business declined.

CTL’s discipline in extracting costs, as seen by actions such as the (painful) 12% headcount reduction, is central to my confidence in CTL’s management achieving their strategic aims. I do not believe that a further $250 million and $200 million of cost synergies in 2019 and 2020 respectfully through further synergies, network grooming efforts and the digital transformation initiative is unreasonable. That would bring overall cost synergies to $1.3 billion, a level consistent to what LVLT achieved in the TWTC merger.

So, given the likelihood of an increased purposeful erosion in low margin legacy business over the next several years combined with a higher level of cost extraction, I have recalculated my base and pessimistic scenarios from my previous post.

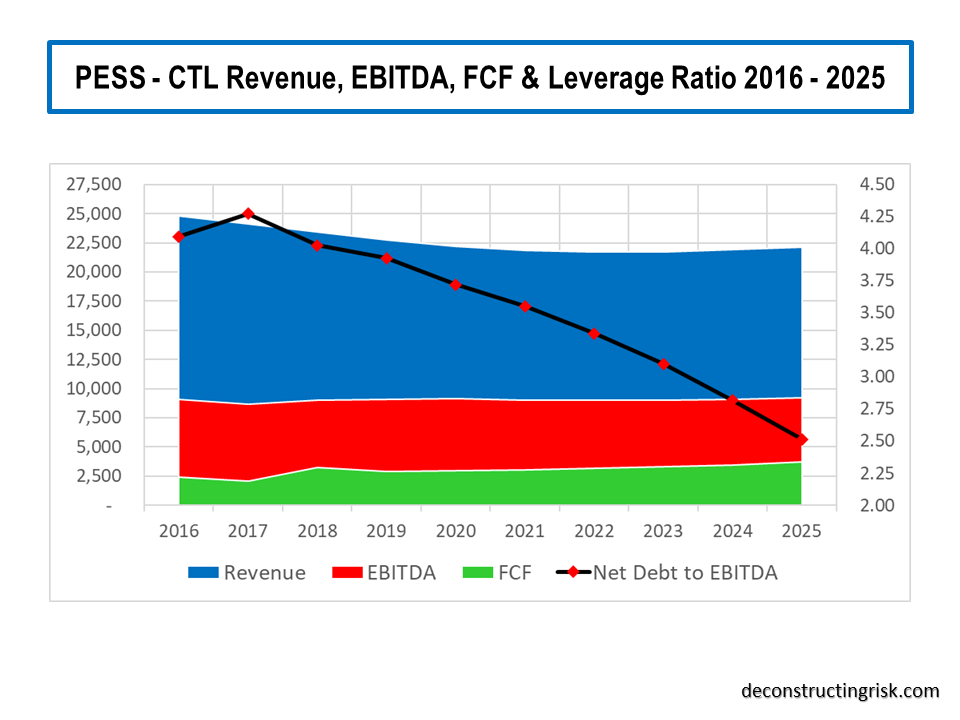
My base scenario, as per the graph below, shows annual revenues effectively flatlining over the next 3 years (2019 to 2021) around $23.3 to $23.6 billion before returning to modest top-line growth thereafter (i.e. between 1% and 1.5% annual growth) with an EBITDA margin of 42% achieved by the end of 2021 and maintained thereafter. This revenue profile mirrors that of previous LVLT mergers, albeit a longer period of flatlining revenues due to the amount of old legacy CTL to burn off. Capex is assumed at 16% of revenue from 2019 onwards. My projections also include further interest rate increases in 2019 and 2020 (as a reminder every 25-basis point change in interest rate results in an 8.5 basis point change in CTL’s blended rate). The current dividend rate is maintained throughout with FCF coverage ratio reducing from the low 70’s in 2019 to around 60% by the end of 2021. My DCF valuation for CTL under these base projections is $23 per share. That’s about 20% above its current level around $19 plus a 11% dividend yield.

click to enlarge

My pessimistic scenario, as per the graph below, assumes that the hoped-for revival of CTL into an on-demand service provider in the 5G age does not result in revenue growth after the legacy business has eroded for whatever reason (other technological advances over the need for a deep fiber network optic been the most likely). Annual revenue continues to decline to below $22 billion by 2021 and does not get above that level again until 2025. Although this scenario would be extreme, its not unknown in the telecom industry for future jumps in data traffic to result in falling revenues (eh, remember the telecom winter!). EBITDA margin levels get to 41% by the end of 2021 and slowly rise to 41.5% thereafter on further cost cutting. Capex and interest rate assumptions are as per the base scenario.

click to enlarge

In the pessimistic scenario the dividend level of $2.16 per share must be cut by 50% from 2020 to reflect the new reality and to deleverage the balance sheet. Although the share price would likely suffer greatly in such a scenario, my DCF valuation is $14 per share, 26% below the current $19 share price, not forgetting the reduced dividend yield after the 50% cut.

As per my previous post on CTL, I see little point in contemplating an optimistic scenario until such time as revenue trends are clearer. A buy-out at a juicy premium is the most likely upside case.

Consideration should be given in any projections over the medium term on the impact and timing of the next recession which is certain to happen over the 2019 to 2025 period. Jeff Storey has argued in the past that recession is good for firms like CTL as enterprises look to save money through switching from legacy services to more efficient on demand services. Although there is an element of truth to this argument, the next recession will likely put further pressures on CTL’s top-line (alternatively, an outbreak of inflation may help pricing pressures!!). Higher interest rates and lower multiples are a risk to the valuation of firms like CTL and the uncertainty over the future macro-economic environment make CTL a risky investment. Notwithstanding the inevitability of a recession at some time, I do feel that the revenue projections above are already conservative given the explosion in network demand that is likely over the next decade, although increased signs of recession in late 2019 or 2020 would temper my risk appetite on CTL.

To me, one of the biggest risks to CTL is the CEO’s health. Given Sunit Patel has left for T-Mobile (who I hope may be a potential buyer of CTL after they get the Sprint deal embedded and/or abandoned) and the new CFO will take some time to get accepted in the role, any potential for CTL not to have Jeff Storey at the helm over the next 2 years would be very damaging. Identifying and publicly promoting a successor to Jeff Storey is something the Board should be actively considering in their contingency planning.

For now, though, I am reasonably comfortable with the risk reward profile on CTL here, absent any significant slow down in the US economy.

More ILS illuminations

A continuation of the theme in this post.

The pictures and stories that have emerged from the impact of the tsunami from the Sulawesi earthquake in Indonesia are heart-breaking. With nearly 2,000 officially declared dead, it is estimated that another 5,000 are missing with hundreds of thousands more severely impacted. This event will be used as an vivid example of the impact of soil liquefaction whereby water pressure generated by the earthquake causes soil to behave like a liquid with massive destructive impacts. The effect on so many people of this natural disaster in this part of the world contrasts sharply with the impact on developed countries of natural disasters. It again highlights the wealth divide within our world and how technologies in the western world could benefit so many people around the world if only money and wealth were not such a determinant of who survives and who dies from nature’s wrath.

The death toll from Hurricane Florence on the US, in contrast, is around 40 people. The possibility of another US hurricane making landfall this week, currently called Tropical Storm Michael, is unfolding. The economic losses of Hurricane Florence are currently estimated between $25 billion and $30 billion, primarily from flood damage. Insured losses will be low in comparison, with some estimates around $3-5 billion (one estimate is as high as $10 billion). The insured losses are likely to be incurred by the National Flood Insurance Program (NFIP), private flood insurers (surplus line players including some Lloyds’ Syndicates), crop and auto insurers, with a modest level of losses ceded to the traditional reinsurance and insurance-linked securities (ILS) markets.

The reason for the low level of insured loss is the low take-up rate of flood policies (flood is excluded from standard homeowner policies), estimated around 15% of insurance policies in the impacted region, with a higher propensity on the commercial side. Florence again highlights the protection gap issue (i.e. percentage difference between insured and economic loss) whereby insurance is failing in its fundamental economic purpose of spreading the economic impact of unforeseen natural events. Indeed, the contrast with the Sulawesi earthquake shows insurance failings on a global inequality level. If insurance and the sector is not performing its economic purpose, then it simply is a rent taker and a drag on economic development.

After that last sentiment, it may therefore seem strange for me to spend the rest of this blog highlighting a potential underestimating of risk premia for improbable events when a string of events has been artfully dodged by the sector (hey, I am guilty of many inconsistencies)!

As outlined in this recent post, the insurance sector is grappling with the effect of new capital dampening pricing after the 2017 losses, directly flattening the insurance cycle. It can be argued that this new source of low-cost capital is having a positive impact on insurance availability and could be the answer to protection gap issues, such as those outlined above. And that may be true, although under-priced risk premia have a way of coming home to roost with serious longer-term effects.

The objective of most business models in the financial services sector is to maximise the risk adjusted returns from a selected portfolio, whether that be stocks or bonds for asset managers, credit risks for banks or insurance risks for insurers. Many of these firms have many thousands of potential risks to select from and so the skill or alpha that each claim derives from their ability to select risks and to build a robust portfolio. If for example, a manager wants to build a portfolio of 20 risks from a possible 100 risks, the combinations are 536 trillion (with 18 zeros as per the British definition)! And that doesn’t consider the sizing of each of the 20 positions in the portfolio. It’s no wonder that the financial sector is embracing artificial intelligence (AI) as a tool to assist firms in optimizing portfolios and potential risk weighted returns (here and here are interesting recent articles from the asset management and reinsurance sectors). I have little doubt that AI and machine learning will be a core technique in any portfolio optimisation process of the future.

I decided to look at the mechanics behind the ILS fund sector again (previous posts on the topic include this post and this old post). I constructed an “average” portfolio that broadly reflects current market conditions. It’s important to stress that there is a whole variety of portfolios that can be constructed from the relatively small number of available ILS assets out there. Some are pure natural catastrophe only, some are focused at the high excess level only, the vintage and risk profile of the assets of many will reflect the length of time they have been in business, many consist of an increasing number of private negotiated deals. As a result, the risk-return profiles of many ILS portfolios will dramatically differ from the “average”. This exercise is simply to highlight the impact of the change of several variables on an assumed, albeit imperfect, sample portfolio. The profile of my “average” sample portfolio is shown below, by exposure, expected loss and pricing.

click to enlarge

The weighted average expected loss of the portfolio is 2.5% versus the aggregate coupon of 5%. It’s important to highlight that the expected loss of a portfolio of low probability events can be misleading and is often misunderstood. Its not the loss expected but simply the average over all simulations. The likelihood of there being any losses is low, by definition, and in the clear majority of cases losses are small.

To illustrate the point, using my assumed loss exceedance curves for each exposure, with no correlation between the exposures except for the multi-peril coverage within each region, I looked at the distribution of losses over net premium, as below. Net premium is the aggregate coupon received less a management fee. The management fee is on assets under management and is assumed to be 1.5% for the sample portfolio, resulting in a net premium of 3.5% in the base scenario. I also looked at the impact of price increases and decreases averaging approximate +/-20% across the portfolio, resulting in net premium of 4.5% and 2.5% respectively. I guesstimate that the +20% scenario is roughly where an “average” ILS portfolio was 5 years ago.

click to enlarge

I have no doubt that the experts in the field would quibble with my model assumptions as they are crude. However, experience has thought me that over-modelling can lead to false sense of security and an over optimistic benefit for diversification (which is my concern about the ILS sector in general). My distributions are based upon 250,000 simulations. Others will point out that I haven’t considered the return on invested collateral assets. I would counter this with my belief that investors should only consider insurance risk premium when considering ILS investments as the return on collateral assets is a return they could make without taking any insurance risk.

My analysis shows that currently investors should only make a loss on this “average” portfolio once every 4 years (i.e. 25% of the time). Back 5 years ago, I estimate that probability at approximately 17% or roughly once every 6 years. If pricing deteriorates further, to the point where net premium is equal to the aggregate expected loss on the portfolio, that probability increases to 36% or roughly once every 3 years

The statistics on the tail show that in the base scenario of a net premium of 3.5% the 1 in 500-year aggregate loss on the portfolio is 430% of net premium compared to 340% for a net premium of 4.5% and 600% for a net premium of 2.5%. At an extreme level of a 1 in 10,000-year aggregate loss to the portfolio is 600% of net premium compared to 480% for a net premium of 4.5% and 800% for a net premium of 2.5%.

If I further assume a pure property catastrophe reinsurer (of which there are none left) had to hold capital sufficient to cover a 1 in 10,000-year loss to compete with a fully collaterised ILS player, then the 600% of net premium equates to collateral of 21%. Using reverse engineering, it could therefore be said that ILS capital providers must have diversification benefits (assuming they do collaterise at 100% rather than use leverage or hedge with other ILS providers or reinsurers) of approximately 80% on their capital to be able to compete with pure property catastrophe reinsurers. That is a significant level of diversification ILS capital providers are assuming for this “non-correlating asset class”. By the way, a more likely level of capital for a pure property catastrophe reinsurer would be 1 in 500 which means the ILS investor is likely assuming diversification benefits of more that 85%. Assuming a mega-catastrophic event or string of large events only requires marginal capital of 15% or less with other economic-driven assets may be seen to be optimistic in the future in my view (although I hope the scenario will never be illustrated in real life!).

Finally, given the pressure management fees are under in the ILS sector (as per this post), I thought it would be interesting to look at the base scenario of an aggregate coupon of 5% with different management fee levels, as below. As you would expect, the portfolio risk profile improves as the level of management fees decrease.

click to enlarge

Given the ongoing pressure on insurance risk premia, it is likely that pressure on fees and other expenses will intensify and the use of machines and IA in portfolio construction will increase. The commodification of insurance risks looks set to expand and increase, all driven by an over-optimistic view of diversification within the insurance class and between other asset classes. But then again, that may just lead to the more wide-spread availability of insurance in catastrophe exposed regions. Maybe one day, even in places like Sulawesi.

Heterogeneous Future

It seems like wherever you look these days there is references to the transformational power of artificial intelligence (AI), including cognitive or machine learning (ML), on businesses and our future. A previous post on AI and insurance referred to some of the changes ongoing in financial services in relation to core business processes and costs. This industry article highlights how machine learning (specifically multi-objective genetic algorithms) can be used in portfolio optimization by (re)insurers. To further my understanding on the topic, I recently bought a copy of a new book called “Advances in Financial Machine Learning” by Marcos Lopez de Prado, although I suspect I will be out of my depth on the technical elements of the book. Other posts on this blog (such as this one) on the telecom sector refer to the impact intelligent networks are having on telecom business models. One example is the efficiencies Centurylink (CTL) have shown in their capital expenditure allocation processes from using AI and this got me thinking about the competitive impact such technology will have on costs across numerous traditional industries.

AI is a complex topic and in its broadest context it covers computer systems that can sense their environment, think, and in some cases learn, and take applicable actions according to their objectives. To illustrate the complexity of the topic, neural networks are a subset of machine learning techniques. Essentially, they are AI systems based on simulating connected “neural units” loosely modelling the way that neurons interact in the brain. Neural networks need large data sets to be “trained” and the number of layers of simulated interconnected neurons, often numbering in their millions, determine how “deep” the learning can be. Before I embarrass myself in demonstrating how little I know about the technicalities of this topic, it’s safe to say AI as referred to in this post encompasses the broadest definition, unless a referenced report or article specifically narrows the definition to a subset of the broader definition and is highlighted as such.

According to IDC (here), “interest and awareness of AI is at a fever pitch” and global spending on AI systems is projected to grow from approximately $20 billion this year to $50 billion in 2021. David Schubmehl of IDC stated that “by 2019, 40% of digital transformation initiatives will use AI services and by 2021, 75% of enterprise applications will use AI”. By the end of this year, retail will be the largest spender on AI, followed by banking, discrete manufacturing, and healthcare. Retail AI use cases include automated customer service agents, expert shopping advisors and product recommendations, and merchandising for omni channel operations. Banking AI use cases include automated threat intelligence and prevention systems, fraud analysis and investigation, and program advisors and recommendation systems. Discrete manufacturing AI use cases including automated preventative maintenance, quality management investigation and recommendation systems. Improved diagnosis and treatment systems are a key focus in healthcare.

In this April 2018 report, McKinsey highlights numerous use cases concluding that ”AI can most often be adopted and create value where other analytics methods and techniques are also creating value”. McKinsey emphasis that “abundant volumes of rich data from images, audio, and video, and large-scale text are the essential starting point and lifeblood of creating value with AI”. McKinsey’s AI focus in the report is particularly in relation to deep learning techniques such as feed forward neural networks, recurrent neural networks, and convolutional neural networks.

Examples highlighted by McKinsey include a European trucking company who reduced fuel costs by 15 percent by using AI to optimize routing of delivery traffic, an airline who uses AI to predict congestion and weather-related problems to avoid costly cancellations, and a travel company who increase ancillary revenue by 10-15% using a recommender system algorithm trained on product and customer data to offer additional services. Other specific areas highlighted by McKinsey are captured in the following paragraph:

“AI’s ability to conduct preventive maintenance and field force scheduling, as well as optimizing production and assembly processes, means that it also has considerable application possibilities and value potential across sectors including advanced electronics and semiconductors, automotive and assembly, chemicals, basic materials, transportation and logistics, oil and gas, pharmaceuticals and medical products, aerospace and defense, agriculture, and consumer packaged goods. In advanced electronics and semiconductors, for example, harnessing data to adjust production and supply-chain operations can minimize spending on utilities and raw materials, cutting overall production costs by 5 to 10 percent in our use cases.”

McKinsey calculated the value potential of AI from neural networks across numerous sectors, as per the graph below, amounting to $3.5 to $5.8 trillion. Value potential is defined as both in the form of increased profits for companies and lower prices or higher quality products and services captured by customers, based off the 2016 global economy. They did not estimate the value potential of creating entirely new product or service categories, such as autonomous driving.

click to enlarge

McKinsey identified several challenges and limitations with applying AI techniques, as follows:

  • Making an effective use of neural networks requires labelled training data sets and therefore data quality is a key issue. Ironically, machine learning often requires large amounts of manual effort in “teaching” machines to learn. The experience of Microsoft with their chatter bot Tay in 2016 illustrates the shortcoming of learning from bad data!
  • Obtaining data sets that are sufficiently large and comprehensive to be used for comprehensive training is also an issue. According to the authors of the book “Deep Learning”, a supervised deep-learning algorithm will generally achieve acceptable performance with around 5,000 labelled examples per category and will match or exceed human level performance when trained with a data set containing at least 10 million labelled examples.
  • Explaining the results from large and complex models in terms of existing practices and regulatory frameworks is another issue. Product certifications in health care, automotive, chemicals, aerospace industries and regulations in the financial services sector can be an obstacle if processes and outcomes are not clearly explainable and auditable. Some nascent approaches to increasing model transparency, including local-interpretable-model-agnostic explanations (LIME), may help resolve this explanation challenge.
  • AI models continue to have difficulties in carrying their experiences from one set of circumstances to another, applying a generalisation to learning. That means companies must commit resources to train new models for similar use cases. Transfer learning, in which an AI model is trained to accomplish a certain task and then quickly applies that learning to a similar but distinct activity, is one area of focus in response to this issue.
  • Finally, one area that has been the subject of focus is the risk of bias in data and algorithms. As bias is part of the human condition, it is engrained in our behaviour and historical data. This article in the New Scientist highlights five examples.

In 2016, Accenture estimated that US GDP could be $8.3 trillion higher in 2035 because of AI, doubling growth rates largely due to AI induced productivity gains. More recently in February this year, PwC published a report on an extensive macro-economic impact of AI and projected a baseline scenario that global GDP will be 14% higher due to AI, with the US and China benefiting the most. Using a Spatial Computable General Equilibrium Model (SCGE) of the global economy, PwC quantifies the total economic impact (as measured by GDP) of AI on the global economy via both productivity gains and consumption-side product enhancements over the period 2017-2030. The impact on the seven regions modelled by 2030 can be seen below.

click to enlarge

PwC estimates that the economic impact of AI will be driven by productivity gains from businesses automating processes as well as augmenting their existing labour force with AI technologies (assisted, autonomous and augmented intelligence) and by increased consumer demand resulting from the availability of personalised and/or higher-quality AI-enhanced products and services.

In terms of sectors, PwC estimate the services industry that encompasses health, education, public services and recreation stands to gain the most, with retail and wholesale trade as well as accommodation and food services also expected to see a large boost. Transport and logistics as well as financial and professional services will also see significant but smaller GDP gains by 2030 because of AI although they estimate that the financial service sector gains relatively quickly in the short term. Unsurprisingly, PwC finds that capital intensive industries have the greatest productivity gains from AI uptake and specifically highlight the Technology, Media and Telecommunications (TMT) sector as having substantial marginal productivity gains from uptaking replacement and augmenting AI. The sectoral gains estimated by PwC by 2030 are shown below.

click to enlarge

A key element of these new processes is the computing capabilities needed to process so much data that underlies AI. This recent article in the FT highlighted how the postulated demise of Moore’s law after its 50-year run is impacting the micro-chip sector. Mike Mayberry of Intel commented that “the future is more heterogeneous” when referring to the need for the chip industry to optimise chip design for specific tasks. DARPA, the US defence department’s research arm, has allocated $1.5 billion in research grants on the chips of the future, such as chip architectures that combine both power and flexibility using reprogrammable “software-defined hardware”. This increase in focus from the US is a direct counter against China’s plans to develop its intellectual and technical abilities in semiconductors over the coming years beyond simple manufacturing.

One of the current leaders in specialised chip design is Nvidia (NVDA) who developed software lead chips for video cards in the gaming sector through their graphics processing unit (GPU). The GPU accelerates applications running on standard central processing units (CPU) by offloading some of the compute-intensive and time-consuming portions of the code whilst the rest of the application still runs on the CPU. The chips developed by NVDA for gamers have proven ideal in handling the huge volumes of data needed to train deep learning systems that are used in AI. The exhibit below from NVDA illustrates how they assert that new processes such as GPU can overcome the slowdown in capability from the density limitation of Moore’s Law.

click to enlarge

NVDA, whose stock is up over 400% in the past 24 months, has been a darling of the stock market in recent years and reported strong financial figures for their quarter to end April, as shown below. Their quarterly figures to the end of July are eagerly expected next month. NVDA has been range bound in recent months, with the trade war often cited as a concern with their products sold approximately 20%, 20%, and 30% into supply chains in China, other Asia Pacific countries, and Taiwan respectively

click to enlarge

Although seen as the current leader, NVDA is not alone in this space. AMD recently reported strong Q1 2018 results, with revenues up 40%, and has a range of specialised chip designs to compete in the datacentre, auto, and machine learning sectors. AMD’s improved results also reduce risk on their balance sheet with leverage decreasing from 4.6X to 3.4X and projected to decline further. AMD’s stock is up approximately 70% year to date. AMD’s 7-nanonmeter product launch planned for later this year also compares favourably against Intel’s delayed release date to 2019 for its 10-nanometer chips.

Intel has historically rolled out a new generation of computer chips every two years, enabling chips that were consistently more powerful than their predecessors even as the cost of that computing power fell. But as Intel has run up against the limits of physics, they have reverted to making upgrades to its aging 14nm processor node, which they say performs 70% better than when initially released four years ago. Despite advances by NVDA and AMD in data centres, Intel chips still dominate. In relation to the AI market, Intel is focused on an approach called field-programmable gate array (FPGA) which is an integrated circuit designed to be configured by a customer or a designer after manufacturing. This approach of domain-specific architectures is seen as an important trend in the sector for the future.

Another interesting development is Google (GOOG) recently reported move to commercially sell, through its cloud-computing service, its own big-data chip design that it has been using internally for some time. Known as a tensor processing unit (TPU), the chip was specifically developed by GOOG for neural network machine learning and is an AI accelerator application-specific integrated circuit (ASIC). For example, in Google photos an individual TPU can process over 100 million photos a day. What GOOG will do with this technology will be an interesting development to watch.

Given the need for access to large labelled data sets and significant computing infrastructure, the large internet firms like Google, Facebook (FB), Microsoft (MSFT), Amazon (AMZN) and Chinese firms like Baidu (BIDU) and Tencent (TCEHY) are natural leaders in using and commercialising AI. Other firms highlighted by analysts as riding the AI wave include Xilinx (XLNX), a developer of high-performance FPGAs, and Yext (YEXT), who specialise in managing digital information relevant to specific brands, and Twilio (TWLO), a specialist invoice and text communication analysis. YEXT and TWLO are loss making. All of these stocks, possibly excluding the Chinese ones, are trading at lofty valuations. If the current wobbles on the stock market do lead to a significant fall in technology valuations, the stocks on my watchlist will be NVDA, BIDU and GOOG. I’d ignore the one trick ponys, particularly the loss making ones! Specifically, Google is one I have been trying to get in for years at a sensible value and I will watch NVDA’s results next month with keen interest as they have consistently broken estimates in recent quarters. Now, if only the market would fall from its current heights to allow for a sensible entry point…….maybe enabled by algorithmic trading or a massive trend move by the passives!

Artificial Insurance

The digital transformation of existing business models is a theme of our age. Robotic process automation (RPA) is one of the many acronyms to have found its way into the terminology of businesses today. I highlighted the potential for telecoms to digitalise their business models in this post. Klaus Schwab of the World Economic Forum in his book “Fourth Industrial Revolution” refers to the current era as one whereby “new technologies that are fusing the physical, digital and biological worlds, impacting all disciplines, economies and industries, and even challenging ideas about what it means to be human”.

The financial services business is one that is regularly touted as been rife for transformation with fintech being the much-hyped buzz word. I last posted here and here on fintech and insurtech, the use of technology innovations designed to squeeze out savings and efficiency from existing insurance business models.

Artificial intelligence (AI) is used as an umbrella term for everything from process automation, to robotics and to machine learning. As referred to in this post on equity markets, the Financial Stability Board (FSB) released a report called “Artificial Intelligence and Machine Learning in Financial Services” in November 2017. In relation to insurance, the FSB report highlights that “some insurance companies are actively using machine learning to improve the pricing or marketing of insurance products by incorporating real-time, highly granular data, such as online shopping behaviour or telemetrics (sensors in connected devices, such as car odometers)”. Other areas highlighted include machine learning techniques in claims processing and the preventative benefits of remote sensors connected through the internet of things. Consultants are falling over themselves to get on the bandwagon as reports from the likes of Deloitte, EY, PwC, Capgemini, and Accenture illustrate.

One of the better recent reports on the topic is this one from the reinsurer SCOR. CEO Denis Kessler states that “information is becoming a commodity, and AI will enable us to process all of it” and that “AI and data will take us into a world of ex-ante predictability and ex-post monitoring, which will change the way risks are observed, carried, realized and settled”. Kessler believes that AI will impact the insurance sector in 3 ways:

  • Reducing information asymmetry and bringing comprehensive and dynamic observability in the insurance transaction,
  • Improving efficiencies and insurance product innovation, and
  • Creating new “intrinsic“ AI risks.

I found one article in the SCOR report by Nicolas Miailhe of the Future Society at the Harvard Kennedy School particularly interesting. Whilst talking about the overall AI market, Miailhe states that “the general consensus remains that the market is on the brink of a revolution, which will be characterized by an asymmetric global oligopoly” and the “market is qualified as oligopolistic because of the association between the scale effects and network effects which drive concentration”.  When referring to an oligopoly, Miailhe highlights two global blocks – GAFA (Google/Apple/Facebook/Amazon) and BATX (Baidu/Alibaba/Tencent/Xiaomi). In the insurance context, Miailhe states that “more often than not, this will mean that the insured must relinquish control, and at times, the ownership of data” and that “the delivery of these new services will intrude heavily on privacy”.

At a more mundane level, Miailhe highlights the difficulty for stakeholders such as auditors and regulators to understand the business models of the future which “delegate the risk-profiling process to computer systems that run software based on “black box” algorithms”. Miailhe also cautions that bias can infiltrate algorithms as “algorithms are written by people, and machine-learning algorithms adjust what they do according to people’s behaviour”.

In a statement that seems particularly relevant today in terms of the current issue around Facebook and data privacy, Miailhe warns that “the issues of auditability, certification and tension between transparency and competitive dynamics are becoming apparent and will play a key role in facilitating or hindering the dissemination of AI systems”.

Now, that’s not something you’ll hear from the usual cheer leaders.

The Bionic Invisible Hand

Technology is omnipresent. The impacts of technology on markets and market structures are a topic of much debate recently. Some point to its influence to explain the lack of volatility in equity markets (ignoring this week’s wobble). Marko Kolanovic, a JPMorgan analyst, has been reported to have estimated that a mere 10% US equity market trading is now conducted by discretionary human traders.

The first wave of high frequency trading (HFT) brought about distortive practises by certain players such as front running and spoofing, as detailed in Michael Lewis’s bestselling exposé Flash Boys. Now HFT firms are struggling to wring profits from the incremental millisecond, as reported in this FT article, with 2017 revenues for HFT firms trading US stocks falling below $1 billion in 2017 from over $7 billion in 2009, according to the consultancy Tabb Group. According to Doug Duquette of Vertex Analytics “it has got to the point where the speed is so ubiquitous that there really isn’t much left to get”.

The focus now is on the impact of various rules-based automatic investment systems, ranging from exchange traded funds (ETFs) to computerised high-speed trading programs to new machine learning and artificial intelligence (AI) innovations. As Tom Watson said about HFT in 2011, these new technologies have the potential to give “Adam Smith’s invisible hand a bionic upgrade by making it better, stronger and faster like Steve Austin in the Six Million Dollar Man”.

As reported in another FT article, some experts estimate that computers are now generating around 50% to 70% of trading in equity markets, 60% of futures and more than 50% of treasuries. According to Morningstar, by year-end 2017 the total assets of actively managed funds stood at $11.4 trillion compared with $6.7 trillion for passive funds in the US.

Although the term “quant fund” covers a multitude of mutual and hedge fund strategies, assuming certain classifications are estimated to manage around $1 trillion in assets out of total assets under management (AUM) invested in mutual funds globally of over $40 trillion. It is believed that machine learning or AI only drives a small subset of quant funds’ trades although such systems are thought to be used as investment tools for developing strategies by an increasing number of investment professionals.

Before I delve into these issues further, I want to take a brief detour into the wonderful world of quantitative finance expert Paul Wilmott and his recent book, with David Orrell, called “The Money Formula: Dodgy Finance, Pseudo Science, and How Mathematicians Took Over the Markets”. I am going to try to summarize the pertinent issues highlighted by the authors in the following sequence of my favourite quotes from the book:

“If anybody can flog an already sick horse to death, it is an economist.”

“Whenever a model becomes too popular, it influences the market and therefore tends to undermine the assumptions on which it was built.”

“Real price data tend to follow something closer to a power-law distribution and are characterized by extreme events and bursts of intense volatility…which are typical of complex systems that are operating at a state known as self-organized criticality…sometimes called the edge of chaos.”

“In quantitative finance, the weakest links are the models.”

“The only half decent, yet still toy, models in finance are the lognormal random walk models for those instruments whose level we don’t care about.”

“The more apparently realistic you make a model, the less useful it often becomes, and the complexity of the equations turns the model into a black box. The key then is to keep with simple models, but make sure that the model is capturing the key dynamics of the system, and only use it within its zone of validity.”

“The economy is not a machine, it is a living, organic system, and the numbers it produces have a complicated relationship with the underlying reality.”

“Calibration is a simple way of hiding model risk, you choose the parameters so that your model superficially appears to value everything correctly when really, it’s doing no such thing.”

“When their [quants] schemes, their quantitative seizing – cratered, the central banks stepped in to fill the hole with quantitative easing.”

“Bandwagons beget bubbles, and bubbles beget crashes.”

“Today, it is the risk that has been created by high speed algorithms, all based on similar models, all racing to be the first to do the same thing.”

“We have outsourced ethical judgments to the invisible hand, or increasingly to algorithms, with the result that our own ability to make ethical decisions in economic matters has atrophied.”

According to Morningstar’s annual fund flow report, flows into US mutual funds and ETFs reached a record $684.6 billion in 2017 due to massive inflows into passive funds. Among fund categories, the biggest winners were passive U.S. equity, international equity and taxable bond funds with each having inflows of more than $200 billion. “Indexing is no longer limited to U.S. equity and expanding into other asset classes” according to the Morningstar report.

click to enlarge

Paul Singer of Elliott hedge fund, known for its aggressive activism and distressed debt focus (famous for its Argentine debt battles), dramatically said “passive investing is in danger of devouring capitalism” and called it “a blob which is destructive to the growth-creating and consensus-building prospects of free market capitalism”.

In 2016, JP Morgan’s Nikolaos Panagirtzoglou stated that “the shift towards passive funds has the potential to concentrate investments to a few large products” and “this concentration potentially increases systemic risk making markets more susceptible to the flows of a few large passive products”. He further stated that “this shift exacerbates the market uptrend creating more protracted periods of low volatility and momentum” and that “when markets eventually reverse, the correction becomes deeper and volatility rises as money flows away from passive funds back towards active managers who tend to outperform in periods of weak market performance”.

The International Organization of Securities Commissions (IOSCO), proving that regulators are always late to the party (hopefully not too late), is to broaden its analysis on the ETF sector in 2018, beyond a previous review on liquidity management, to consider whether serious market distortions might occur due to the growth of ETFs, as per this FT article. Paul Andrews, a veteran US regulator and secretary general of IOSCO, called ETFs “financial engineering at its finest”, stated that “ETFs are [now] a critical piece of market infrastructure” and that “we are on autopilot in many respects with market capitalisation-weighted ETFs”.

Artemis Capital Management, in this report highlighted in my previous post, believe that “passive investing is now just a momentum play on liquidity” and that “large capital flows into stocks occur for no reason other than the fact that they are highly liquid members of an index”. Artemis believes that “active managers serve as a volatility buffer” and that if such a buffer is withdrawn then “there is no incremental seller to control overvaluation on the way up and no incremental buyer to stop a crash on the way down”.

Algorithmic trading (automated trading, black-box trading, or simply algo-trading) is the process of using computers programmed to follow a defined set of instructions for placing a trade in order to generate profits at a speed and frequency that is impossible for a human trader.

Machine learning uses statistical techniques to infer relationships between data. The artificial intelligence “agent” does not have an algorithm to tell it which relationships it should find but infers, or learns if you like, from the data using statistical analysis to revise its hypotheses. In supervised learning, the machine is presented with examples of input data together with the desired output. The AI agent works out a relationship between the two and uses this relationship to make predictions given further input data. Supervised learning techniques, such as Bayesian regression, are useful where firms have a flow of input data and would like to make predictions.

Unsupervised learning, in contrast, does without learning examples. The AI agent instead tries to find relationships between input data by itself. Unsupervised learning can be used for classification problems determining which data points are similar to each other. As an example of unsupervised learning, cluster analysis is a statistical technique whereby data or objects are classified into groups (clusters) that are similar to one another but different from data or objects in other clusters.

Firms like Bloomberg use cluster analysis in their liquidity assessment tool which aims to cluster bonds with sufficiently similar behaviour so their historical data can be shared and used to make general predictions for all bonds in that cluster. Naz Quadri of Bloomberg, with the wonderful title of head of quant engineering and research, said that “some applications of clustering were more useful than others” and that their analysis suggests “clustering is most useful, and results are more stable, when it is used with a structural market impact model”. Market impact models are widely used to minimise the effect of a firm’s own trading on market prices and are an example of machine learning in practise.

In November 2017, the Financial Stability Board (FSB) released a report called “Artificial Intelligence and Machine Learning in Financial Services”. In the report the FSB highlighted some of the current and potential use cases of AI and machine learning, as follows:

  • Financial institutions and vendors are using AI and machine learning methods to assess credit quality, to price and market insurance contracts, and to automate client interaction.
  • Institutions are optimising scarce capital with AI and machine learning techniques, as well as back-testing models and analysing the market impact of trading large positions.
  • Hedge funds, broker-dealers, and other firms are using AI and machine learning to find signals for higher (and uncorrelated) returns and optimise trading execution.
  • Both public and private sector institutions may use these technologies for regulatory compliance, surveillance, data quality assessment, and fraud detection.

The FSB report states that “applications of AI and machine learning could result in new and unexpected forms of interconnectedness” and that “the lack of interpretability or ‘auditability’ of AI and machine learning methods has the potential to contribute to macro-level risk”. Worryingly they say that “many of the models that result from the use of AI or machine learning techniques are difficult or impossible to interpret” and that “many AI and machine learning developed models are being ‘trained’ in a period of low volatility”. As such “the models may not suggest optimal actions in a significant economic downturn or in a financial crisis, or the models may not suggest appropriate management of long-term risks” and “should there be widespread use of opaque models, it would likely result in unintended consequences”.

With increased use of machine learning and AI, we are seeing the potential rise of self-driving investment vehicles. Using self-driving cars as a metaphor, Artemis Capital highlights that “the fatal flaw is that your driving algorithm has never seen a mountain road” and that “as machines trade with against each other, self-reflexivity is amplified”. Others point out that machine learning in trading may involve machine learning algorithms learning the behaviour of other machine learning algorithms, in a regressive loop, all drawing on the same data and the same methodology. 13D Research opined that “when algorithms coexist in complex systems with subjectivity and unpredictability of human behaviour, unforeseen and destabilising downsides result”.

It is said that there is nothing magical about quant strategies. Quantitative investing is an approach for implementing investment strategies in an automated (or semi-automated) way. The key seems to be data, its quality and its uniqueness. A hypothesis is developed and tested and tested again against various themes to identify anomalies or inefficiencies. Jim Simons of Renaissance Technologies (called RenTec), one of the oldest and most successful quant funds, said that the “efficient market theory is correct in that there are no gross inefficiencies” but “we look at anomalies that may be small in size and brief in time. We make our forecast. Then, shortly thereafter, we re-evaluate the situation and revise our forecast and our portfolio. We do this all-day long. We’re always in and out and out and in. So we’re dependent on activity to make money“. Simons emphasised that RenTec “don’t start with models” but “we start with data” and “we don’t have any preconceived notions”. They “look for things that can be replicated thousands of times”.

The recently departed co-CEO Robert Mercer of RenTec [yes the Mercer who backs Breitbart which adds a scary political Big Brother surveillance angle to this story] has said “RenTec gets a trillion bytes of data a day, from newspapers, AP wire, all the trades, quotes, weather reports, energy reports, government reports, all with the goal of trying to figure out what’s going to be the price of something or other at every point in the future… The information we have today is a garbled version of what the price is going to be next week. People don’t really grasp how noisy the market is. It’s very hard to find information, but it is there, and in some cases it’s been there for a long long time. It’s very close to science’s needle in a haystack problem

Kumesh Aroomoogan of Accern recently said that “quant hedge funds are buying as much data as they can”. The so-called “alternative data” market was worth about $200 million in the US in 2017 and is expected to double in four years, according to research and consulting firm Tabb Group. The explosion of data that has and is becoming available in this technological revolution should keep the quants busy, for a while.

However, what’s scaring me is that these incredibly clever people will inevitably end up farming through the same data sets, coming to broadly similar conclusions, and the machines who have learned each other’s secrets will all start heading for the exits at the same time, in real time, in a mother of all quant flash crashes. That sounds too much like science fiction to ever happen though, right?