Tag Archives: InsurTech

More ILS illuminations

A continuation of the theme in this post.

The pictures and stories that have emerged from the impact of the tsunami from the Sulawesi earthquake in Indonesia are heart-breaking. With nearly 2,000 officially declared dead, it is estimated that another 5,000 are missing with hundreds of thousands more severely impacted. This event will be used as an vivid example of the impact of soil liquefaction whereby water pressure generated by the earthquake causes soil to behave like a liquid with massive destructive impacts. The effect on so many people of this natural disaster in this part of the world contrasts sharply with the impact on developed countries of natural disasters. It again highlights the wealth divide within our world and how technologies in the western world could benefit so many people around the world if only money and wealth were not such a determinant of who survives and who dies from nature’s wrath.

The death toll from Hurricane Florence on the US, in contrast, is around 40 people. The possibility of another US hurricane making landfall this week, currently called Tropical Storm Michael, is unfolding. The economic losses of Hurricane Florence are currently estimated between $25 billion and $30 billion, primarily from flood damage. Insured losses will be low in comparison, with some estimates around $3-5 billion (one estimate is as high as $10 billion). The insured losses are likely to be incurred by the National Flood Insurance Program (NFIP), private flood insurers (surplus line players including some Lloyds’ Syndicates), crop and auto insurers, with a modest level of losses ceded to the traditional reinsurance and insurance-linked securities (ILS) markets.

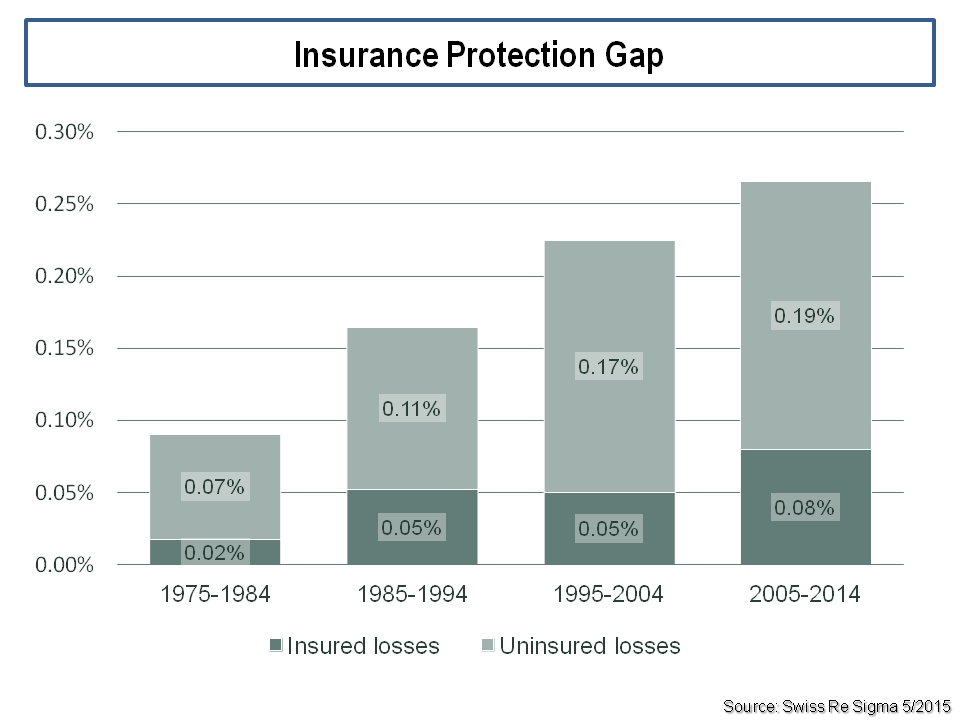
The reason for the low level of insured loss is the low take-up rate of flood policies (flood is excluded from standard homeowner policies), estimated around 15% of insurance policies in the impacted region, with a higher propensity on the commercial side. Florence again highlights the protection gap issue (i.e. percentage difference between insured and economic loss) whereby insurance is failing in its fundamental economic purpose of spreading the economic impact of unforeseen natural events. Indeed, the contrast with the Sulawesi earthquake shows insurance failings on a global inequality level. If insurance and the sector is not performing its economic purpose, then it simply is a rent taker and a drag on economic development.

After that last sentiment, it may therefore seem strange for me to spend the rest of this blog highlighting a potential underestimating of risk premia for improbable events when a string of events has been artfully dodged by the sector (hey, I am guilty of many inconsistencies)!

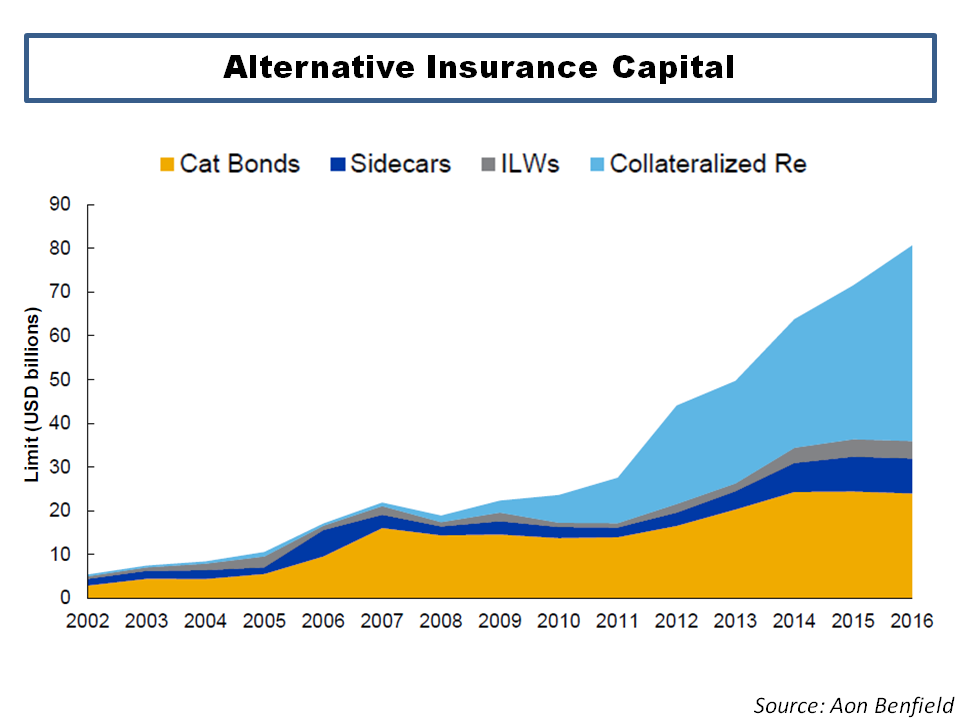
As outlined in this recent post, the insurance sector is grappling with the effect of new capital dampening pricing after the 2017 losses, directly flattening the insurance cycle. It can be argued that this new source of low-cost capital is having a positive impact on insurance availability and could be the answer to protection gap issues, such as those outlined above. And that may be true, although under-priced risk premia have a way of coming home to roost with serious longer-term effects.

The objective of most business models in the financial services sector is to maximise the risk adjusted returns from a selected portfolio, whether that be stocks or bonds for asset managers, credit risks for banks or insurance risks for insurers. Many of these firms have many thousands of potential risks to select from and so the skill or alpha that each claim derives from their ability to select risks and to build a robust portfolio. If for example, a manager wants to build a portfolio of 20 risks from a possible 100 risks, the combinations are 536 trillion (with 18 zeros as per the British definition)! And that doesn’t consider the sizing of each of the 20 positions in the portfolio. It’s no wonder that the financial sector is embracing artificial intelligence (AI) as a tool to assist firms in optimizing portfolios and potential risk weighted returns (here and here are interesting recent articles from the asset management and reinsurance sectors). I have little doubt that AI and machine learning will be a core technique in any portfolio optimisation process of the future.

I decided to look at the mechanics behind the ILS fund sector again (previous posts on the topic include this post and this old post). I constructed an “average” portfolio that broadly reflects current market conditions. It’s important to stress that there is a whole variety of portfolios that can be constructed from the relatively small number of available ILS assets out there. Some are pure natural catastrophe only, some are focused at the high excess level only, the vintage and risk profile of the assets of many will reflect the length of time they have been in business, many consist of an increasing number of private negotiated deals. As a result, the risk-return profiles of many ILS portfolios will dramatically differ from the “average”. This exercise is simply to highlight the impact of the change of several variables on an assumed, albeit imperfect, sample portfolio. The profile of my “average” sample portfolio is shown below, by exposure, expected loss and pricing.

click to enlarge

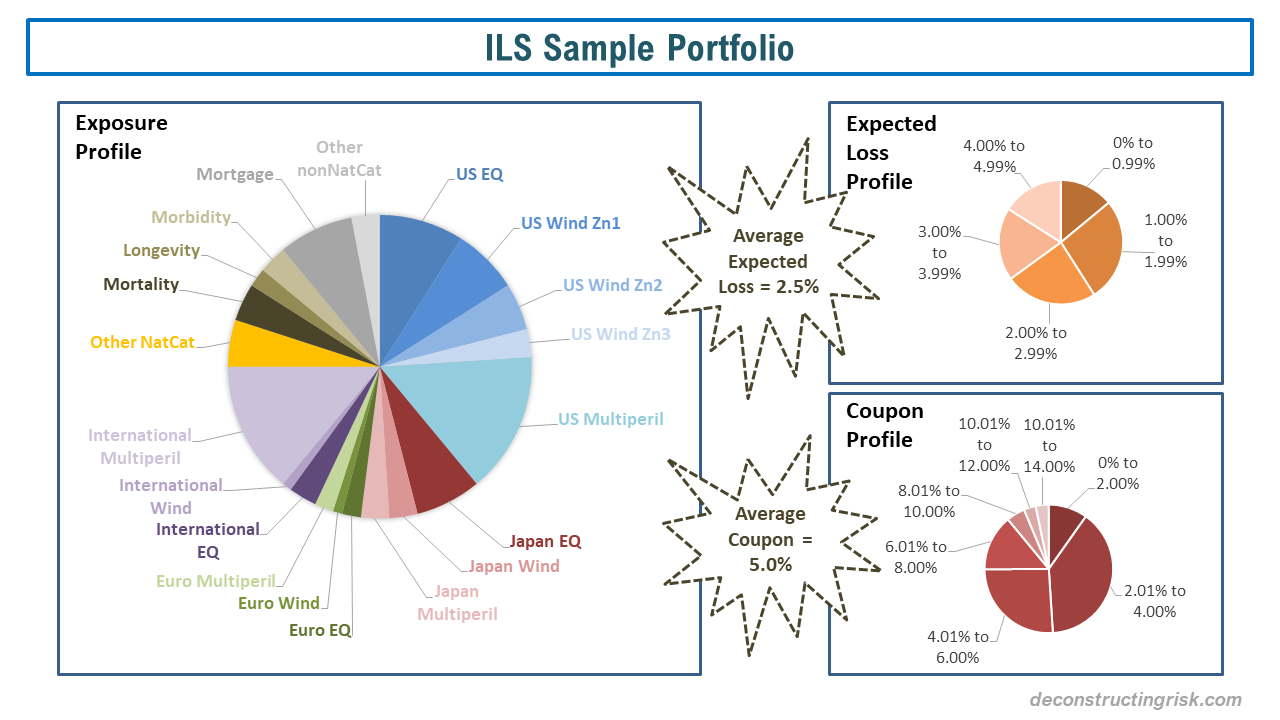
The weighted average expected loss of the portfolio is 2.5% versus the aggregate coupon of 5%. It’s important to highlight that the expected loss of a portfolio of low probability events can be misleading and is often misunderstood. Its not the loss expected but simply the average over all simulations. The likelihood of there being any losses is low, by definition, and in the clear majority of cases losses are small.

To illustrate the point, using my assumed loss exceedance curves for each exposure, with no correlation between the exposures except for the multi-peril coverage within each region, I looked at the distribution of losses over net premium, as below. Net premium is the aggregate coupon received less a management fee. The management fee is on assets under management and is assumed to be 1.5% for the sample portfolio, resulting in a net premium of 3.5% in the base scenario. I also looked at the impact of price increases and decreases averaging approximate +/-20% across the portfolio, resulting in net premium of 4.5% and 2.5% respectively. I guesstimate that the +20% scenario is roughly where an “average” ILS portfolio was 5 years ago.

click to enlarge

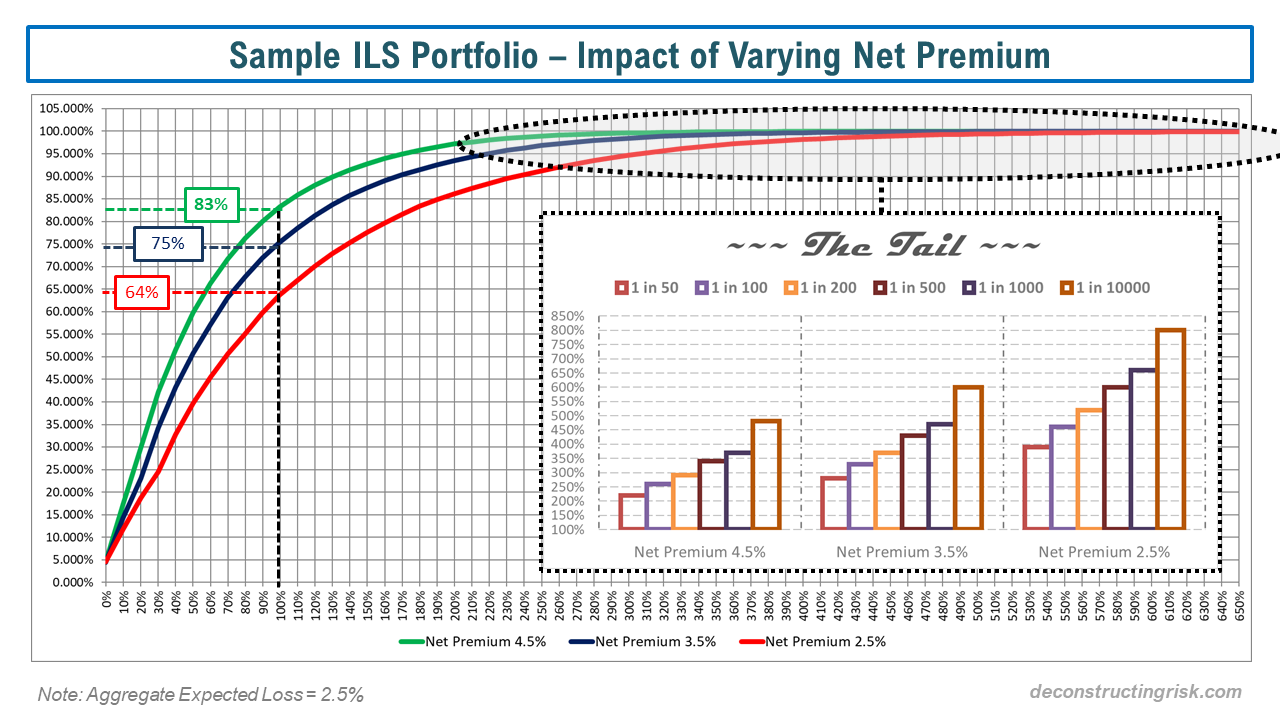
I have no doubt that the experts in the field would quibble with my model assumptions as they are crude. However, experience has thought me that over-modelling can lead to false sense of security and an over optimistic benefit for diversification (which is my concern about the ILS sector in general). My distributions are based upon 250,000 simulations. Others will point out that I haven’t considered the return on invested collateral assets. I would counter this with my belief that investors should only consider insurance risk premium when considering ILS investments as the return on collateral assets is a return they could make without taking any insurance risk.

My analysis shows that currently investors should only make a loss on this “average” portfolio once every 4 years (i.e. 25% of the time). Back 5 years ago, I estimate that probability at approximately 17% or roughly once every 6 years. If pricing deteriorates further, to the point where net premium is equal to the aggregate expected loss on the portfolio, that probability increases to 36% or roughly once every 3 years

The statistics on the tail show that in the base scenario of a net premium of 3.5% the 1 in 500-year aggregate loss on the portfolio is 430% of net premium compared to 340% for a net premium of 4.5% and 600% for a net premium of 2.5%. At an extreme level of a 1 in 10,000-year aggregate loss to the portfolio is 600% of net premium compared to 480% for a net premium of 4.5% and 800% for a net premium of 2.5%.

If I further assume a pure property catastrophe reinsurer (of which there are none left) had to hold capital sufficient to cover a 1 in 10,000-year loss to compete with a fully collaterised ILS player, then the 600% of net premium equates to collateral of 21%. Using reverse engineering, it could therefore be said that ILS capital providers must have diversification benefits (assuming they do collaterise at 100% rather than use leverage or hedge with other ILS providers or reinsurers) of approximately 80% on their capital to be able to compete with pure property catastrophe reinsurers. That is a significant level of diversification ILS capital providers are assuming for this “non-correlating asset class”. By the way, a more likely level of capital for a pure property catastrophe reinsurer would be 1 in 500 which means the ILS investor is likely assuming diversification benefits of more that 85%. Assuming a mega-catastrophic event or string of large events only requires marginal capital of 15% or less with other economic-driven assets may be seen to be optimistic in the future in my view (although I hope the scenario will never be illustrated in real life!).

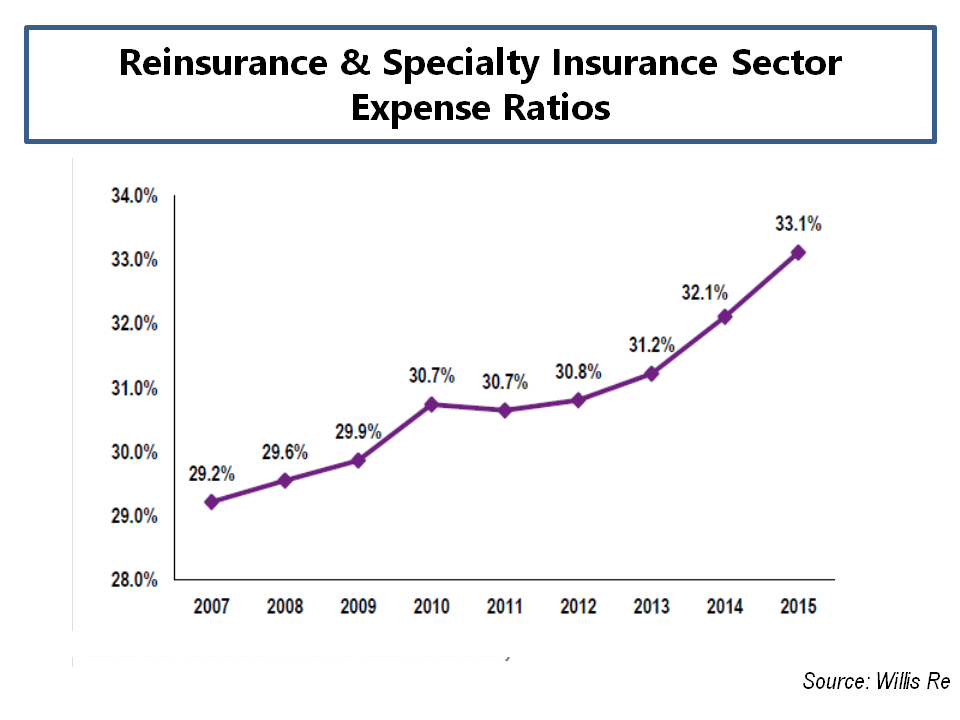
Finally, given the pressure management fees are under in the ILS sector (as per this post), I thought it would be interesting to look at the base scenario of an aggregate coupon of 5% with different management fee levels, as below. As you would expect, the portfolio risk profile improves as the level of management fees decrease.

click to enlarge

Given the ongoing pressure on insurance risk premia, it is likely that pressure on fees and other expenses will intensify and the use of machines and IA in portfolio construction will increase. The commodification of insurance risks looks set to expand and increase, all driven by an over-optimistic view of diversification within the insurance class and between other asset classes. But then again, that may just lead to the more wide-spread availability of insurance in catastrophe exposed regions. Maybe one day, even in places like Sulawesi.

Artificial Insurance

The digital transformation of existing business models is a theme of our age. Robotic process automation (RPA) is one of the many acronyms to have found its way into the terminology of businesses today. I highlighted the potential for telecoms to digitalise their business models in this post. Klaus Schwab of the World Economic Forum in his book “Fourth Industrial Revolution” refers to the current era as one whereby “new technologies that are fusing the physical, digital and biological worlds, impacting all disciplines, economies and industries, and even challenging ideas about what it means to be human”.

The financial services business is one that is regularly touted as been rife for transformation with fintech being the much-hyped buzz word. I last posted here and here on fintech and insurtech, the use of technology innovations designed to squeeze out savings and efficiency from existing insurance business models.

Artificial intelligence (AI) is used as an umbrella term for everything from process automation, to robotics and to machine learning. As referred to in this post on equity markets, the Financial Stability Board (FSB) released a report called “Artificial Intelligence and Machine Learning in Financial Services” in November 2017. In relation to insurance, the FSB report highlights that “some insurance companies are actively using machine learning to improve the pricing or marketing of insurance products by incorporating real-time, highly granular data, such as online shopping behaviour or telemetrics (sensors in connected devices, such as car odometers)”. Other areas highlighted include machine learning techniques in claims processing and the preventative benefits of remote sensors connected through the internet of things. Consultants are falling over themselves to get on the bandwagon as reports from the likes of Deloitte, EY, PwC, Capgemini, and Accenture illustrate.

One of the better recent reports on the topic is this one from the reinsurer SCOR. CEO Denis Kessler states that “information is becoming a commodity, and AI will enable us to process all of it” and that “AI and data will take us into a world of ex-ante predictability and ex-post monitoring, which will change the way risks are observed, carried, realized and settled”. Kessler believes that AI will impact the insurance sector in 3 ways:

  • Reducing information asymmetry and bringing comprehensive and dynamic observability in the insurance transaction,
  • Improving efficiencies and insurance product innovation, and
  • Creating new “intrinsic“ AI risks.

I found one article in the SCOR report by Nicolas Miailhe of the Future Society at the Harvard Kennedy School particularly interesting. Whilst talking about the overall AI market, Miailhe states that “the general consensus remains that the market is on the brink of a revolution, which will be characterized by an asymmetric global oligopoly” and the “market is qualified as oligopolistic because of the association between the scale effects and network effects which drive concentration”.  When referring to an oligopoly, Miailhe highlights two global blocks – GAFA (Google/Apple/Facebook/Amazon) and BATX (Baidu/Alibaba/Tencent/Xiaomi). In the insurance context, Miailhe states that “more often than not, this will mean that the insured must relinquish control, and at times, the ownership of data” and that “the delivery of these new services will intrude heavily on privacy”.

At a more mundane level, Miailhe highlights the difficulty for stakeholders such as auditors and regulators to understand the business models of the future which “delegate the risk-profiling process to computer systems that run software based on “black box” algorithms”. Miailhe also cautions that bias can infiltrate algorithms as “algorithms are written by people, and machine-learning algorithms adjust what they do according to people’s behaviour”.

In a statement that seems particularly relevant today in terms of the current issue around Facebook and data privacy, Miailhe warns that “the issues of auditability, certification and tension between transparency and competitive dynamics are becoming apparent and will play a key role in facilitating or hindering the dissemination of AI systems”.

Now, that’s not something you’ll hear from the usual cheer leaders.

ILS illuminations

Insurance linked securities (ILS) are now well established in the insurance industry. ILS as an asset class offer, according to its many fans, the benefits of diversification and low correlation to other asset classes whilst offering a stable and attractive risk/reward return. The impact of the new capital on the traditional market has been profound and wide ranging (and a much posted upon topic in this blog – here, here & here for example).

ILS fund managers maintained an “aggressive posture” on price at the recent April renewals according to Willis Re as ILS capacity continues to demonstrate its cost of capital advantage. ILS fund managers are also looking to diversify, moving beyond pure short tail risks and looking at new previously uninsured or underinsured exposures, as well as looking to move their capital along the value-chain by sourcing primary risk more directly and in bulk.

An industry stalwart, John Kavanagh of Willis Re, commented that “with results on many diversifying non-catastrophe classes now marginal, there is greater pressure on reinsurers to address the pricing in these classes” and that “many reinsurers remain prepared to let their top line revenue growth stall and are opting to return excess capital to their shareholders”. The softening reinsurance market cycle is now in its fifth year and S&P estimates that “even assuming continued favourable prior-year reserve releases and benign natural catastrophe losses, we anticipate that reinsurers will barely cover their cost of capital over the next two years”.

Rather than fight the new capital on price, some traditional (re)insurers are, according to Brandan Holmes of Moody’s, “deploying third-party capital in their own capital structures in an effort to lower their blended cost of capital” and are deriving, according to Aon Benfield, “significant benefits from their ability to leverage alternative capital”. One can only fight cheap capital for so long, at some stage you just arbitrage against it (sound familiar!).

A.M. Best recently stated that “more collateralised reinsurance programs covering nonpeak exposures are ceded to the capital markets”. The precipitous growth in the private transacted collateralised reinsurance subsector can be seen in the graph from Aon below.

click to enlarge

Nick Frankland of Guy Carpenter commented that “the capital landscape is ever-changing” and that “such capital diversity also elevates the position of the broker”. Some argue that the all-powerful role of the dominant brokers is exacerbating market softness. These brokers would counterargue that they are simply fulfilling their role in an efficient market, matching buyers and sellers. As Frankland puts it, brokers are “in the strongest position to provide access to all forms of capital and so secure the more beneficial rates and terms and conditions”. Dominic Christian of Aon Benfield commented last year that “to some extent alternative sources of capital are already, and have already uberized insurance and reinsurance, by bringing increased sources of supply”.

Perhaps alone amongst industry participants, Weston Hicks of Alleghany, has questioned the golden goose of cheap ILS capital stating that “some new business models that separate the underwriting decision from the capital provider/risk bearer are, in our view, problematic because of a misalignment of incentives”. Such concerns are batted aside as old fashioned in this new world of endless possibilities. Frighteningly, John Seo of ILS fund manager Fermat Capital, suggests that “for every dollar of money that you see in the market right now, I think there is roughly 10 dollars on the sidelines waiting to come in if the market hardens”.

As an indicator of current ILS pricing, the historical market spread over expected losses in the public CAT bond market can be seen in the exhibit below with data sourced from Lane Financial. It is interesting to note that the average expected loss is increasing indicating CAT bonds are moving down the risk towers towards more working layer coverages.

click to enlarge

In a previous post, I argued that returns from an ILS fund index, with the net returns judgementally adjusted to get to comparable figures gross of management fees, were diverging against those from a pure CAT bond index. I argued that this divergence may illustrate that the ILS funds with exposure to the private collateralised reinsurance sector may be taking on higher risk exposures to pump returns (or may be passing risks amongst themselves in an embryonic spiral) and that ILS investors should be careful they understand the detail behind the risk profiles of the ILS funds they invest in.

Well, the final 2016 figures, as per the graph below, show that the returns in my analysis have in fact converged rather than diverged. On the face of it, this rubbishes my argument and I have to take that criticism on. Stubbornly, I could counter-argue that the ILS data used in the comparison may not reflect the returns of ILS funds with large exposure to collateralised reinsurance deals. Absent actual catastrophic events testing the range of current fund models, better data sources are needed to argue the point further.

click to enlarge

In their annual review of 2016, Lane Financial have an interesting piece on reducing transparency across both the public and private ILS sector. They characterise the private collateralised reinsurance sector as akin to a dark pool compared to the public CAT bond market which they likened to a lit exchange. Decreased transparency across the ILS sector “should send up warning flags” for all market participants as it makes calculating Net Asset Valuations (NAV) with monthly or quarterly frequency more difficult. They argue that the increased use of a relatively smaller public CAT bond market for pricing points across the ILS sector, the less credible is the overall valuation. This is another way of expressing my concern that the collateralised reinsurance market could be destabilising as it is hidden (and unregulated).

In the past, as per this post, I have questioned how the fully funded ILS market can claim to have a lower cost of capital against rated reinsurers who only have to hold capital against a percentage of their exposed limit, akin to fractional banking (see this post for more on that topic). The response is always down to the uncorrelated nature of ILS to other asset classes and therefore its attraction to investors such as pension funds who can apply a low cost of capital to the investment due to its uncorrelated and diversifying portfolio benefits. Market sponsors of ILS often use graphs such as the one below from the latest Swiss Re report to extoll the benefits of the asset class.

click to enlarge

A similar exhibit, this time from a Lombard Odier brochure, from 2016 shows ILS in an even more favourable light!

click to enlarge

As anybody who has looked through any fund marketing metrics knows, performance comparisons with other investment strategies are fraught with bias and generally postdictive. The period over which the comparison is made and the exact indices chosen (look at the differing equity indices used in the comparisons above) can make material differences. Also, the size and liquidity of a market is important, a point which may negate any reliance on ILS returns prior to 2007 for example.

I thought an interesting exercise would be to compare actual historical ILS returns, as represented by the Swiss Re Global Cat Bond Total Return Index, against total returns (i.e. share price annual change plus dividends paid in year) from equity investment in reinsurers across different time periods. The most applicable business model for comparison would be pure property catastrophe reinsurers but unfortunately there are not many of them left.

I have chosen RenRe (RNR) and Validus (VR), from 2007, as representatives of the pure property cat business model, although both have diversified their portfolios away from pure short tail business in recent years. I also selected three of the biggest European reinsurers – Munch Re, Swiss Re and Hannover Re – all of which are large diverse composite reinsurers. Finally, I constructed a US$ portfolio using equal shares of each of the five firms mentioned above (RenRe represents 40% of the portfolio until 2007 when Validus went public) with the € and CHF shares converted at each year end into dollars.

The construction of any such portfolio is postdictive and likely suffers from multiple biases. Selecting successful firms like RenRe and Validus could validly be criticised under survival bias. To counter such criticism, I would point out that the inclusion of the European reinsurers is a considerable historic drag on returns given their diverse composite footprint (and associated correlation to the market) and the exclusion of any specialist CAT firm that has been bought out in recent years, generally at a good premium, also drags down returns.

The comparison over the past 15 years, see graph below, shows that Munich and Swiss struggle to get over their losses from 2002 and 2003 and during the financial crisis. Hannover is the clear winner amongst the Europeans. The strong performance of Hannover, RenRe and Validus mean that the US$ portfolio matches the CAT bond performance after the first 10 years, albeit on a more volatile basis, before moving ahead on a cumulative basis in the last 5 years. The 15-year cumulative return is 217% for the CAT bond index and 377% return for the US$ equity portfolio.

click to enlarge

The comparison over the past 10 years, see graph below, is intriguing. Except for Validus, the CAT bond index beats all other firms and the US$ portfolio for non-volatile returns hands down in the first 5 years. Hannover, Validus and the portfolio each make a strong comeback in the most recent 5 years. The 10-year cumulative return is 125% for the CAT bond index and 189% return for the US$ equity portfolio.

click to enlarge

The comparison over the past 5 years, see graph below, shows that all firms and the portfolio handily beats the CAT bond index. Due to an absence in large loss activity over the recent past and much more shareholder friendly actions by all reinsurers, the equity returns have been steady and non-volatile. The 5-year cumulative return is 46% for the CAT bond index and 122% return for the US$ equity portfolio.

click to enlarge

Overall then, ILS may offer less volatile and uncorrelated returns but I would personally prefer the, often lumpier, historical equity returns from a selected portfolio of top reinsurers in my pension pot (we all could have both in our pension funds!). Then again, the influx of new capital into ILS has put the future viability of the traditional reinsurance business models into question so future equity returns from the sector may not be too rosy.

At the end of the day, the bottom line is whether current market risk premia is adequate, irrespective of being supplied by ILS fund managers or traditional reinsurers. Based upon what I see, I have grave misgivings about current market pricing and therefore have no financial exposure, ILS or equity or otherwise, to the market at present.

Additional Comment, 29th April 2017: The ILS website Artemis.bm had an interesting piece on comments from Torsten Jeworrek of Munich Re during their March conference call. The applicable comment is as follows:

“And now I give you another example, which is not innovation per se or not digitalization, but you know that more and more alternative capital came into the insurance industry over the last years; hedge funds, pension refunds, participating particularly in the cat business and as a trend that not all of the limits they provide, cat limits are fully collateralized anymore. That means there are 10 scenarios; hurricane, earthquake, [indiscernible], and so on; which are put together, but not 10 times the limit is collateralized, let’s say only 4 times, 5 times.

That means these hedge funds and pension funds so to speak in the future if they don’t have to provide full 100% collateralized for all the limits they provide, they need a certain credit risk for the buyer. The more they entertain, the more there’s a likelihood that this reinsurance can also fail. The question is how far will that go and this kind of not fully collateralized reinsurance, will that be then accepted as a reinsurance by the regulator or will that be penalized at a certain time otherwise we don’t have level playing field anymore, which means the traditional reinsurer who was strongly monitored and regulated and also reported as really expensive and a burden for our industry and for us and on the other hand, you have very lean pension and hedge funds who even don’t have to provide the same amount of capital for the same risk.”

London Isn’t Calling

In a previous post, I reproduced an exhibit from a report from Aon Benfield on the potential areas of disruption to extract expenses across the value chain in the non-life insurance sector, specifically the US P&C sector. The exhibit is again reproduced below.

 click to enlargeexpenses-across-the-value-chain

The diminishing returns in the reinsurance and specialty insurance sector are well known due to too much capital chasing low risk premia. Another recent report from Aon Benfield shows the sector trend in net income ROE from their market representative portfolio of reinsurance and specialty insurers, as below.

click to enlargenet-income-roe

It’s odd then in this competitive environment that the expense ratios in the sector are actually increasing. Expense ratios (weighted average) from the Willis Re sector representative portfolio, as below and in this report, illustrate the point.

click to enlargewillis-re-expense-ratios

The 2016 edition of the every interesting S&P Reinsurance Highlights, as per this link, also shows a similar trend in expense ratios as well as showing the variance in ratios across different firms, as below.

click to enlargesp-expense-ratios

Care does need to be taken in comparing expense ratios as different expense items can be included in the ratios, some limit overhead expenses to underwriting whilst others include a variety of corporate expense items. One thing is clear however and that’s that firms based in the London market, particularly Lloyds’, are amongst the most top heavy in the industry. Albeit a limited sample, the graph below shows the extent of the difference of Lloyds’ and some of its peers in Bermuda and Europe.

click to enlargeselect-expense-ratios

Digging further into expense ratios leads naturally to acquisitions costs such as commission and brokerage. Acquisition costs vary across business lines and between reinsurance and insurance so business mix is important. The graph below on acquisition costs again shows Lloyds’ higher than some of its peers.

click to enlargeselect-acquisition-cost-ratios

Although Brexit may only result in the loss of fewer than 10% of London’s business, any loss of diversification in this competitive market can impact the relevance of London as an important marketplace. Taken together with the gratuitous expense of doing business in London, its relevance may come under real pressure in the years to come. London is, most definitely, not calling.

Pimping the Peers (Part 2)

In the last post on this topic, I highlighted how new technologies, broadly under the fintech tag, had the potential to disrupt the banking sector, primarily by means of automating processes rather than any major reinventing of business models (although I did end that post with a bit of a rant about innovation and human behaviour). Blockchain is the hot topic that seems to be cropping up everywhere (I’ll leave that for another time). This post is about insurance and new technology, or in the jargon, insurtech.

The traditional business model in the insurance industry is not reacting well to a world of low or negative interest rates. For the life insurance sector, the duration mismatch between their liabilities and their assets is having a perverse impact as interest rates have fallen. Savings returns for aging populations have been sacrificed in Central Bank’s attempt to stimulate economic growth.

In addition, the traditional distribution channel for selling life insurer’s products, and the old adage is that these products are sold rather than bought, has relied too heavily on aging tied agents whose focus is on the wealthy client that can generate more fees than the middle class. The industry is generally at a loss on how to sell products in a low interest world to the mass market and to the new tech savvy generation. As a result, the industry and others are throwing money at a rash of new start-ups in insurance, as the exhibit on some of the current hyped firms focusing on life insurance below illustrates.

click to enlargelife-insurance-big-data

As the exhibit illustrates, the focus of these new start-ups is weighted towards technologies around product development, distribution, and underwriting. Some will likely succeed in trying to differentiate further the existing clientele of life insurers (e.g. real time health data). Many will be gobbled up or disappear. Differing attitudes between those aged under 34 and the older generation towards online distribution channels can be clearly seen in the survey results in the exhibit below.

click to enlargeattitudes-to-life-insurance-distribution-channels

With longevity and low interest rates the dominant challenges for life insurers today, automation of processes will assist in cutting expenses in the provision of products (mainly to the existing customer base) but will not likely meaningfully address the twin elephants in the room.  Citigroup reckons that in 20 of the largest OECD countries the unfunded government liability for pensions is around $78 trillion which compares to approximately $50 trillion in GDP for all OECD countries in 2015. I look forward to conversing with a robo-advisor in the near future on what products it recommends for that problem!

Insurance itself is hundreds of years old and although the wonderfully namely bottomry (the earliest form of marine hull insurance) or ancient burial societies are early examples, non-life insurance really took off with mass markets after the great fire of London in 1666.

The most hyped example of insurtech in the non-life sector is the impact of technologies on the motor business like drive-less cars and car telematics. This paper from Swiss Re shows that the impact over the next 20 years of such advances on motor premia could be dramatic.

Much of the focus from insurtech innovation is on reducing expenses, an item that the industry is not light on. The graph below shows examples of the level of acquisition and overhead expenses in the non-life sector across different jurisdictions.

click to enlargenonlife-expense-ratios

A recent report from Aon Benfield went further and looked at expenses across the value chain in the US P&C insurance sector, as below. Aon Benfield estimated overall expenses make up approximately half of gross risk premium, much of which represents juicy disruption targets for new technology in the insurtech world.

click to enlargeexpenses-across-the-value-chain

Insurance itself is based upon the law of large numbers and serves a socially useful function in reducing economic volatility by transferring risks from businesses and consumers. In 1906, Alfred Manes defined insurance as “an economic institution resting on the principle of mutuality, established for the purpose of supplying a fund, the need for which arises from a chance occurrence whose probability can be estimated”.

One of the issues identified with the current non-life insurance sector is the so-called protection gap. This is in effect where insurers’ risk management practises have got incredibly adapt at identifying and excluding those risks most likely to result in a claim. Although good for profits, it does bring the social usefulness of the transference of only the pristine risks into question (for everybody else). The graph below from Swiss Re illustrates the point by showing economic and insured losses from natural catastrophe events as a % of GDP.

click to enlargeinsurance-protection-gap-uninsured-vrs-insured-losses

It’s in the context of low investment returns and competitive underwriting markets (in themselves being driven by low risk premia across asset classes) that a new technology driven approach to the mutual insurance model is being used to attack expense and protection gap issues.

Mutuals represent the original business model for many insurers (back to burial schemes and the great fire of 1666) and still represent approximately a third of the sector in the US and Europe today. Peer to peer insurers are what some are calling the new technology driven mutuals. In fact, most of the successful P2P models to date, firms like Guevara, Friendsurance, and Inspeer are really intermediaries who pool consumers together for group discounts or self-financing of high deductibles.

Lemonade, which launched in New York this week, is a peer to peer platform which issues its own insurance policies and seeks to address the protection gap issue by offering broader coverage. The firm has been heavily reinsured by some big names in insurance like Berkshire Hathaway and Lloyd’s. It offers a fee based model, whereby the policyholders pay claims through mutualisation (assumingly by pools determined by pre-defined criteria). Daniel Schreiber, CEO and co-founder of Lemonade says that the firm will be ”the only insurer that doesn’t make money by denying claims”. Dan Ariely, a big deal in the world of Behavioral Economics, has been named as Chief Behavioral Officer, presumably in an effort to assist in constructing pools of well behaved policyholders.

The graphic below tries to illustrate how the business model is evolving (or should that be repeating?). Technology offers policyholders the opportunity to join with others to pool risk, hitherto a process that was confined to associations amongst professional groups or groups bound by location. Whether technology offers the same opportunity to underwrite risks profitably (or at least not at a loss) but with a larger reach remains to be seen.

click to enlargeinsurance-business-models

It does occur to me that it may be successful in addressing areas of dislocation in the industry, such as shortfalls in coverage for flood insurance, where a common risk and mitigant can be identified and addressed in the terms of the respective pool taking the risks on.

For specialty re/insurers, we have already seen a bifurcation between the capital providers/risk takers and the risk portfolio managers in the ILS arena. Newer technology driven mutual based insurers also offer the industry a separation of the management of risk pools and the risk capital provided to underwrite them. I wish them well in their attempts at updating this most ancient of businesses and I repeat what I said in part 1 of this post – don’t let the sweet scent of shiny new technology distract you from the smell of the risk…..