Tag Archives: Swiss Re

The New Normal (Again)

I expect that next week’s reinsurance jamboree in Monte Carlo will be full of talk of innovative and technology streaming-lining business models (as per this post on AI and insurance). This recent article from the FT is just one example of claims that technology like blockchain can reduce costs by 30%. The article highlights questions about whether insurers are prepared to give up ownership of data, arguably their competitive advantage, if the technology is really to be scaled up in the sector.

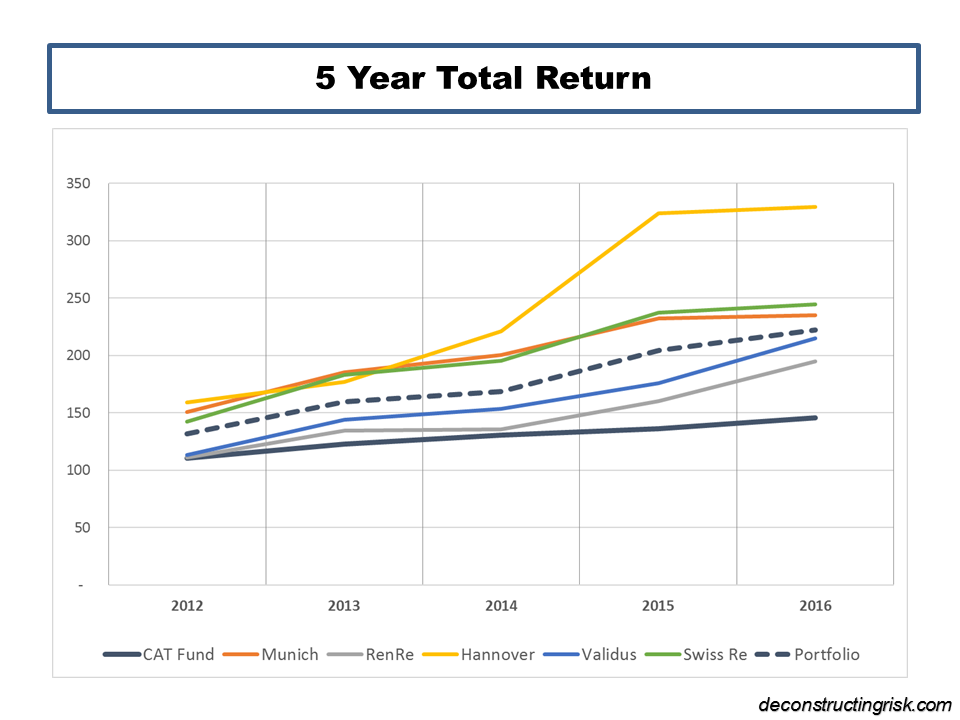
As a reminder of the reinsurance sector’s cost issues, as per this post on Lloyds’, the graph below illustrates the trend across Lloyds’, the Aon Benfield Aggregate portfolio, and Munich’s P&C reinsurance business.

click to enlarge

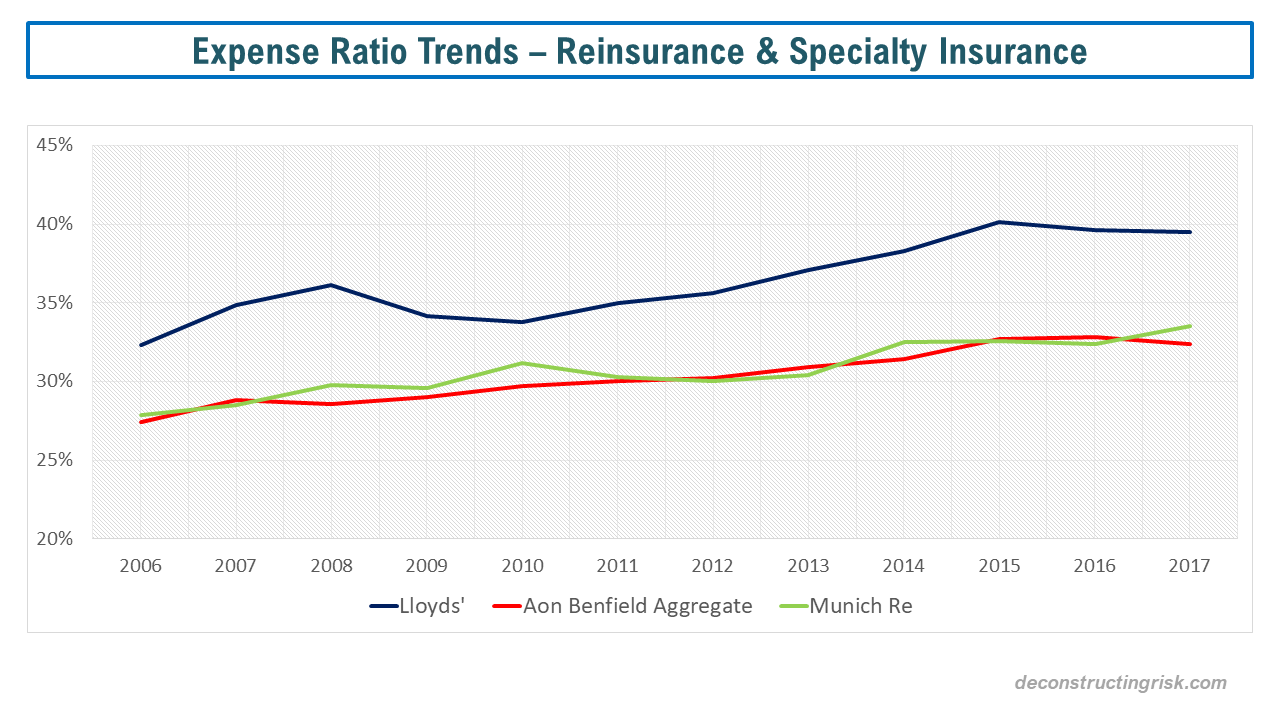
Until the sector gets serious about cutting costs, such as overpaid executives on luxury islands or expensive cities and antiquated business practises such as holding get togethers in places like Monte Carlo, I suspect expenses will remain an issue. In their July review, Willis stated that a “number of traditional carriers are well advanced in their plans to reduce their costs, including difficult decisions around headcount” and that “in addition to cost savings, the more proactively managed carriers are applying far greater rigor in examining the profitability of every line of business they are accepting”. Willis highlighted the potential difficulties for the vastly inefficient MGA business that many have been so actively pursuing. As an example of the type of guff executives will trot out next week, Swiss Re CEO, Christian Mumenthaler, said “we remain convinced that technology will fundamentally change the re/insurance value chain”, likely speaking from some flash office block in one of the most expensive cities in the world!

On market conditions, there was positive developments on reinsurance pricing at the January renewals after the 2017 losses with underlying insurance rates improving, as illustrated by the Marsh composite commercial rate index (example from US below).

click to enlarge

However, commentators have been getting ever more pessimistic as the year progresses, particularly after the mid-year renewals. Deutsche Bank recently called the reinsurance pricing outlook “very bleak”. A.M. Best stated that “the new normal for reinsurers appears to be one with returns that are less impressive and underwriting and fee income becoming a larger contributor to profits” and predicts, assuming a normal large loss level, an 8% ROE for 2018 for the sector. Willis, in their H1 report, puts the sectors ROE at 7.7% for H1 2018. S&P, in the latest report that is part of their Global Highlights series, also expects a ROE return for 2018 around 6% to 8% and estimates that “reinsurers are likely to barely cover their cost of capital in 2018 and 2019”.

S&P does question why “the market values the industry at a premium to book value today (on average at 1.24x at year-end 2017), and at near historical highs, given the challenges” and believes that potential capital returns, M&A and interest rate rises are all behind elevated valuations.  The recent Apollo PE deal for Aspen at 1.12 times book seems a large way off other recent multiples, as per this post, but Aspen has had performance issues. Still its interesting that no other insurer was tempted to have a go at Aspen with the obvious synergies that such a deal could have achieved. There is only a relatively small number of high quality players left for the M&A game and they will not be cheap!

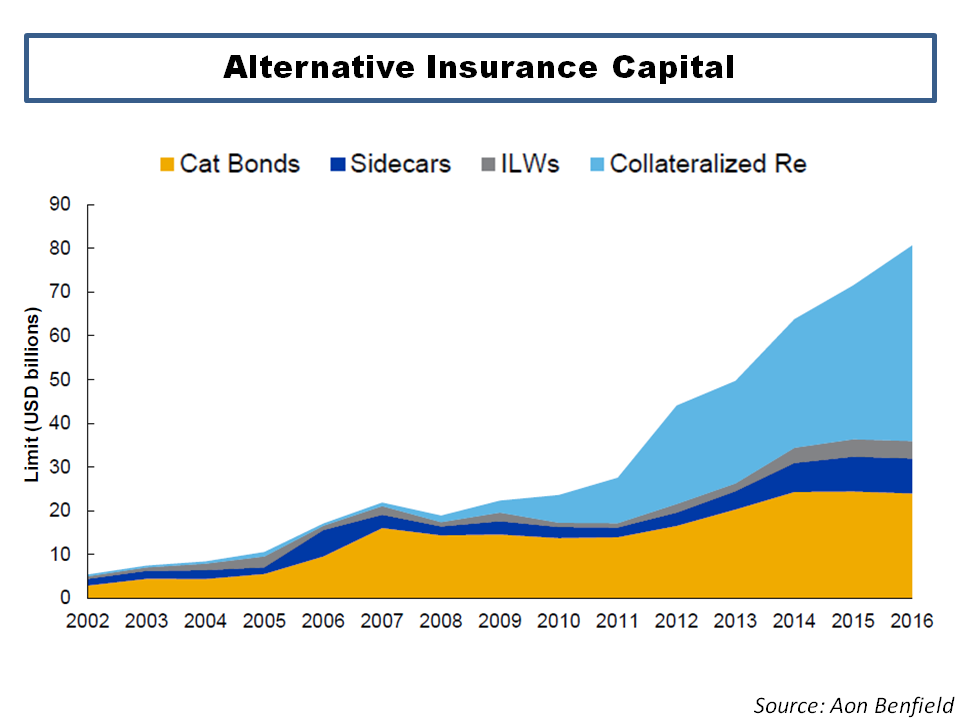
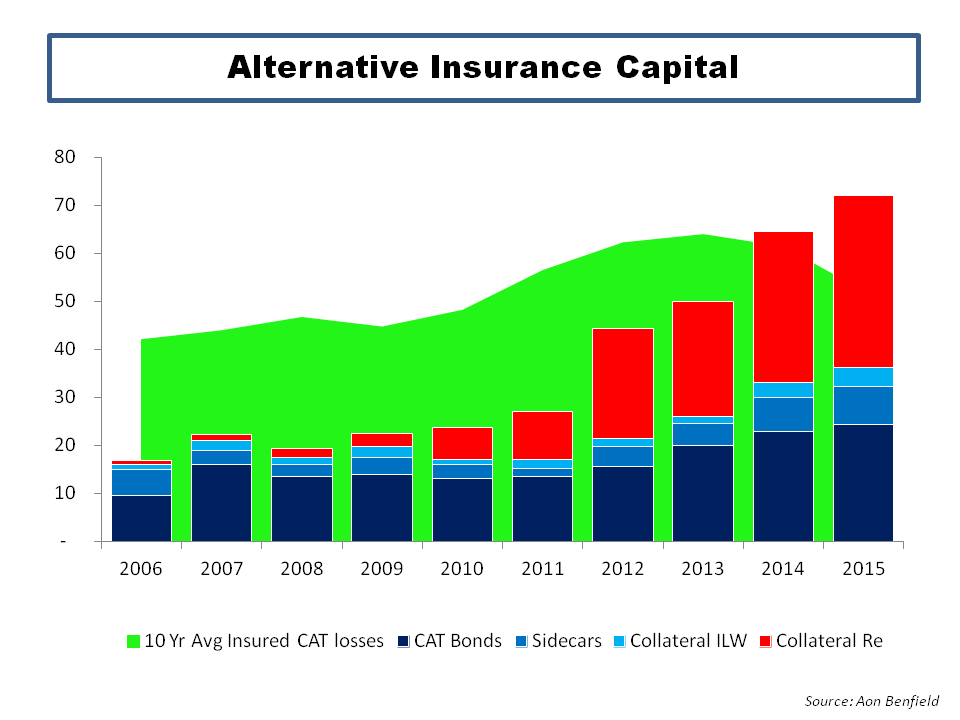
As you are likely aware, I have been vocal on the impact the ILS sector has had in recent years (most recently here and here). With so-called alternative capital (at what size does it stop being alternative!) now at the $95 billion-mark according to Aon, A.M. Best makes the obvious point that “any hope for near-term improvement in the market is directly correlated to the current level of excess capacity in the overall market today, which is being compounded by the continued inflow of alternative capacity”. Insurers and reinsurers are not only increasing their usage of ILS in portfolio optimisation but are also heavily participating in the sector. The recent purchase by Markel of the industry leading and oldest ILS fund Nephila is an interesting development as Markel already had an ILS platform and is generally not prone to overpaying.

I did find this comment from Bob Swarup of Camdor in a recent Clear Path report on ILS particularly telling – “As an asset class matures it inevitably creates its own cycle and beta. At this point you expect fees to decline both as a function of the benefits of scale but also as it becomes more understood, less of it becomes alpha and more of it becomes beta” and “I do feel that the fees are most definitely too high right now and to a large extent this is because people are trying to treat this as an alternative asset class whereas it is large enough now to be part of the general mix”. Given the still relatively small size of the ILS sector, it’s difficult for ILS managers to demonstrate true alpha at scale (unless they are taking crazy leveraged bets!) and therefore pressure on current fees will become a feature.

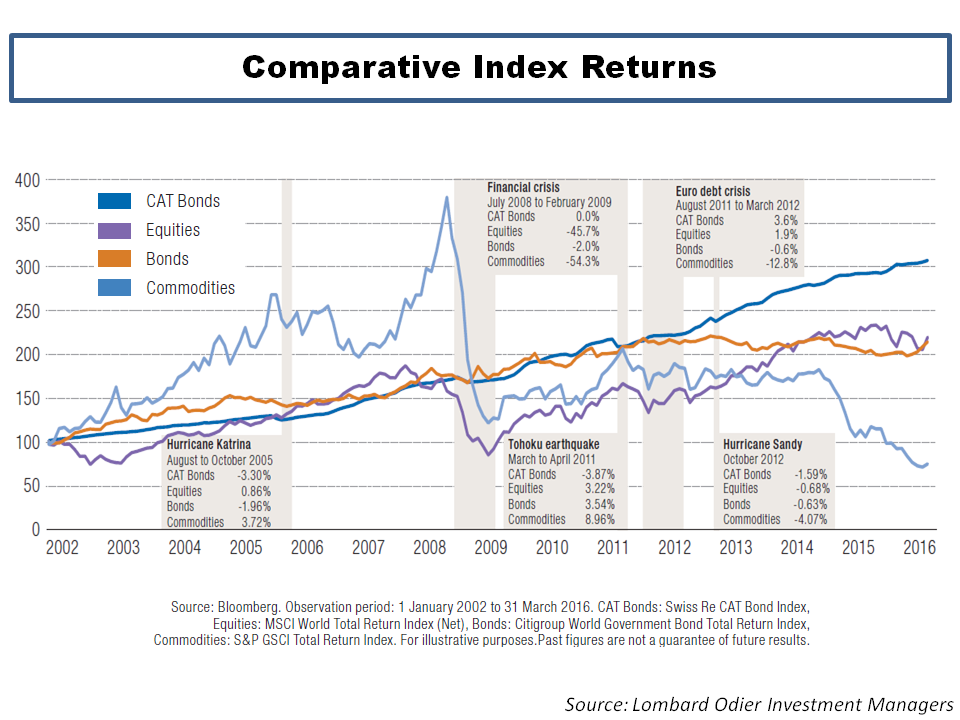
A.M. Best articulated my views on ILS succinctly as follows: “The uncorrelated nature of the industry to traditional investments does appear to have value—so long as the overall risk-adjusted return remains appropriate”. The graph below from artemis.bm shows the latest differential between returns and expected cost across the portfolio they monitor.

click to enlarge

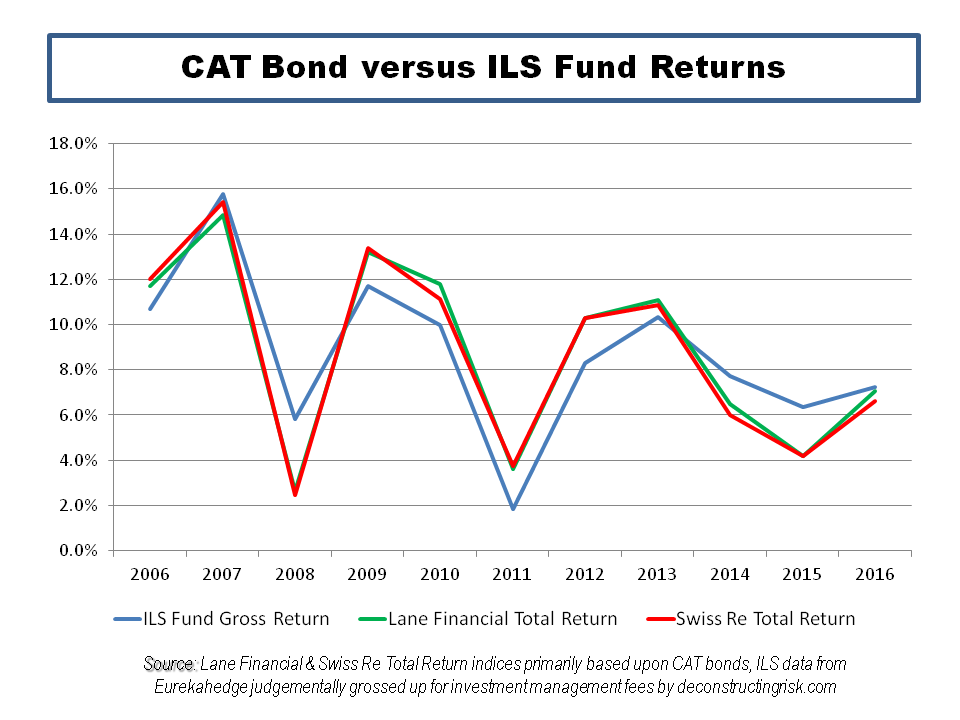
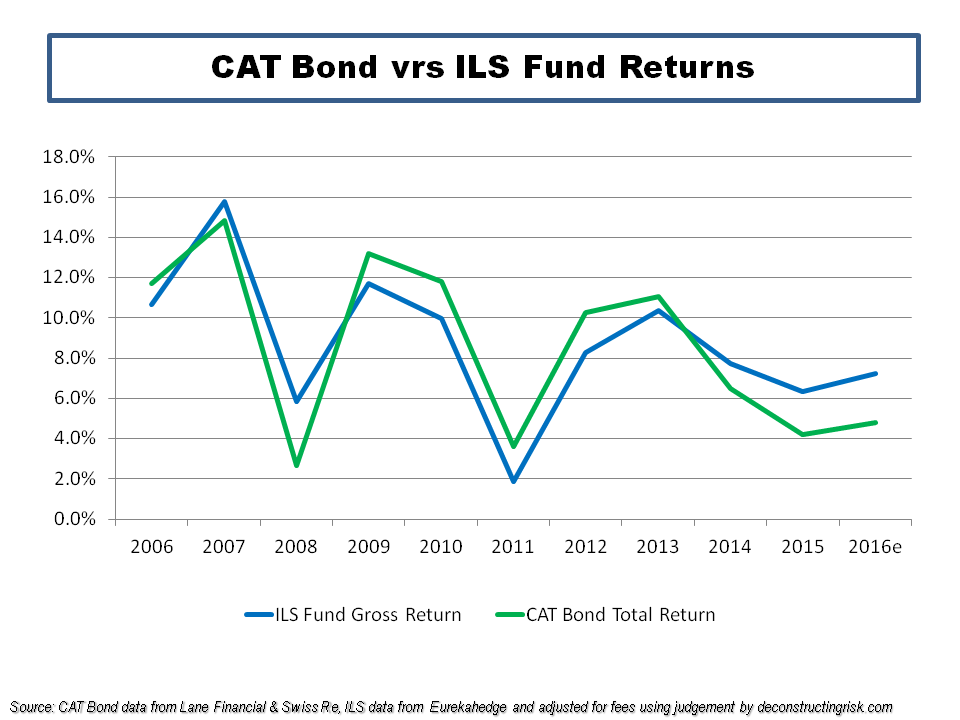
In terms of the returns from ILS funds, the graph below shows the underlying trend (with 2018 results assuming no abnormal catastrophic activity) of insurance only returns from indices calculated by Lane Financial (here) and Eurekahedge (here). Are recent 5 year average returns of between 500 and 250 basis points excess risk free enough to compensation for the risk of a relatively concentrated portfolio? Some think so. I don’t.

click to enlarge

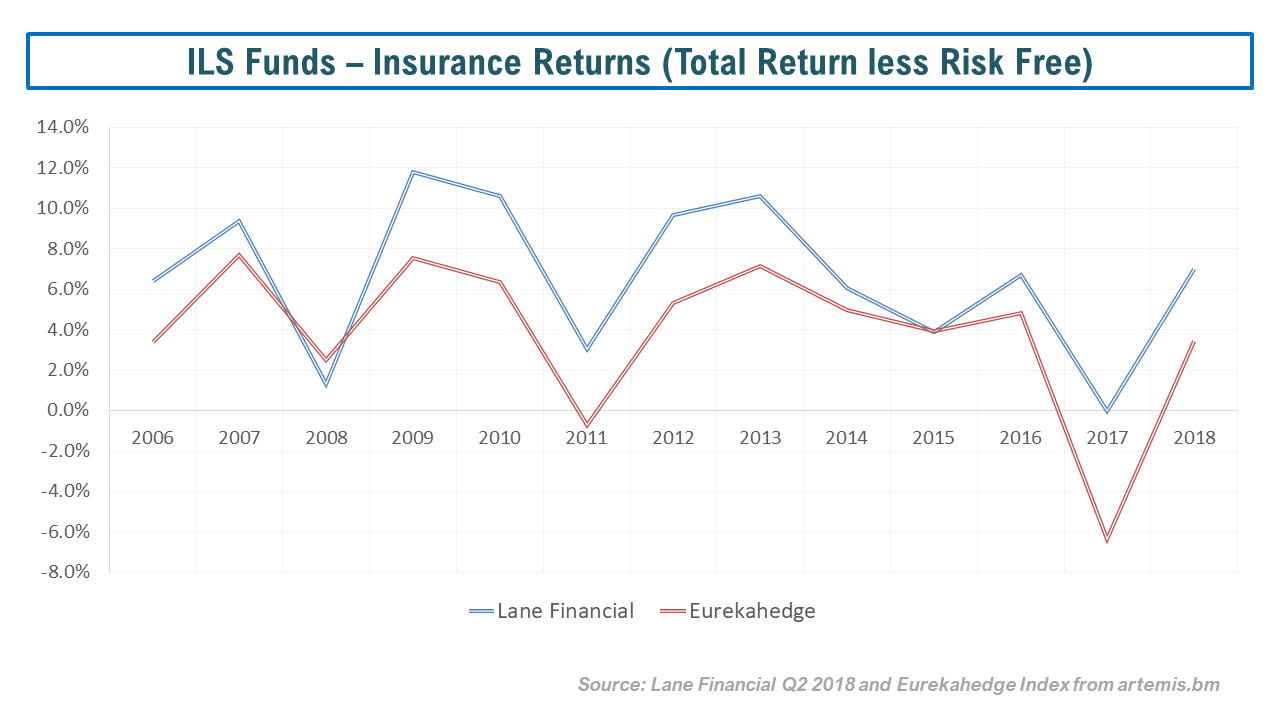
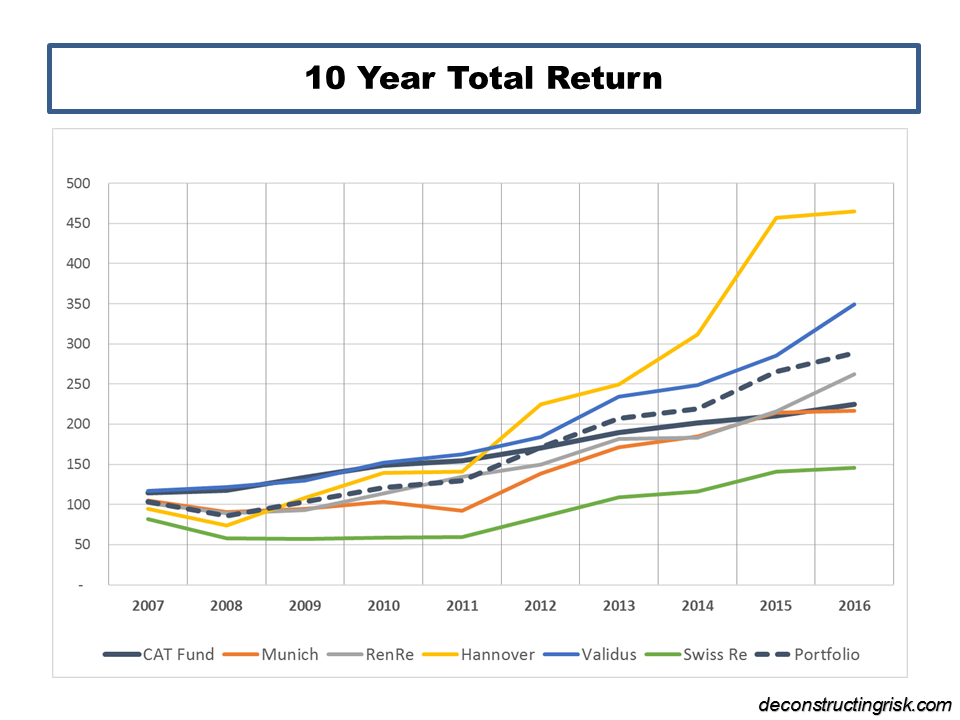
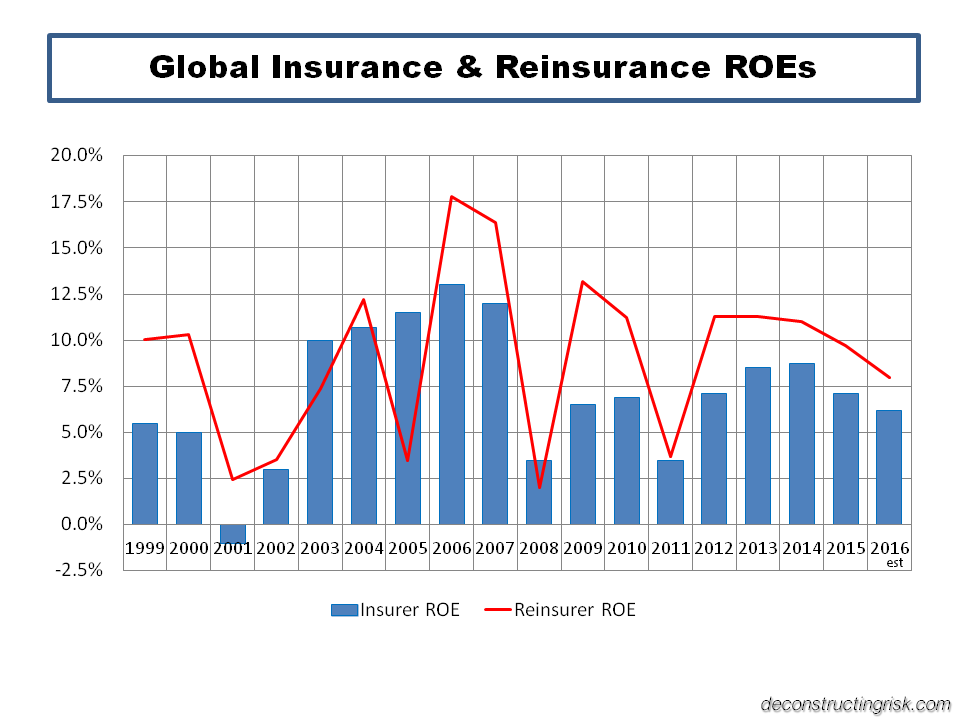
Whether reinsurers and specialty insurers will be able to maintain superior (albeit just above CoC) recent returns over ILS, as illustrated in this post, through arbitrating lower return ILS capital or whether their bloated costs structures will catch them out will be a fascinating game to watch over the coming years. I found a section of a recent S&P report, part of their Global Highlights series, on cat exposures in the sector, amusing. It stated that in 2017 “the reinsurance industry recorded an aggregate loss that was assessed as likely to be incurred less than once in 20 years” whilst “this was the third time this had happened in less than 20 years“.

So, all in all, the story is depressingly familiar for the sector. The new normal, as so many commentators have recently called it, amounts to overcapacity, weak pricing power, bloated cost structures, and optimistic valuations. Let’s see if anybody has anything new or interesting to say in Monte Carlo next week.

As always, let’s hope there is minimal human damage from any hurricanes such as the developing Hurricane Florence or other catastrophic events in 2018.

ILS illuminations

Insurance linked securities (ILS) are now well established in the insurance industry. ILS as an asset class offer, according to its many fans, the benefits of diversification and low correlation to other asset classes whilst offering a stable and attractive risk/reward return. The impact of the new capital on the traditional market has been profound and wide ranging (and a much posted upon topic in this blog – here, here & here for example).

ILS fund managers maintained an “aggressive posture” on price at the recent April renewals according to Willis Re as ILS capacity continues to demonstrate its cost of capital advantage. ILS fund managers are also looking to diversify, moving beyond pure short tail risks and looking at new previously uninsured or underinsured exposures, as well as looking to move their capital along the value-chain by sourcing primary risk more directly and in bulk.

An industry stalwart, John Kavanagh of Willis Re, commented that “with results on many diversifying non-catastrophe classes now marginal, there is greater pressure on reinsurers to address the pricing in these classes” and that “many reinsurers remain prepared to let their top line revenue growth stall and are opting to return excess capital to their shareholders”. The softening reinsurance market cycle is now in its fifth year and S&P estimates that “even assuming continued favourable prior-year reserve releases and benign natural catastrophe losses, we anticipate that reinsurers will barely cover their cost of capital over the next two years”.

Rather than fight the new capital on price, some traditional (re)insurers are, according to Brandan Holmes of Moody’s, “deploying third-party capital in their own capital structures in an effort to lower their blended cost of capital” and are deriving, according to Aon Benfield, “significant benefits from their ability to leverage alternative capital”. One can only fight cheap capital for so long, at some stage you just arbitrage against it (sound familiar!).

A.M. Best recently stated that “more collateralised reinsurance programs covering nonpeak exposures are ceded to the capital markets”. The precipitous growth in the private transacted collateralised reinsurance subsector can be seen in the graph from Aon below.

click to enlarge

Nick Frankland of Guy Carpenter commented that “the capital landscape is ever-changing” and that “such capital diversity also elevates the position of the broker”. Some argue that the all-powerful role of the dominant brokers is exacerbating market softness. These brokers would counterargue that they are simply fulfilling their role in an efficient market, matching buyers and sellers. As Frankland puts it, brokers are “in the strongest position to provide access to all forms of capital and so secure the more beneficial rates and terms and conditions”. Dominic Christian of Aon Benfield commented last year that “to some extent alternative sources of capital are already, and have already uberized insurance and reinsurance, by bringing increased sources of supply”.

Perhaps alone amongst industry participants, Weston Hicks of Alleghany, has questioned the golden goose of cheap ILS capital stating that “some new business models that separate the underwriting decision from the capital provider/risk bearer are, in our view, problematic because of a misalignment of incentives”. Such concerns are batted aside as old fashioned in this new world of endless possibilities. Frighteningly, John Seo of ILS fund manager Fermat Capital, suggests that “for every dollar of money that you see in the market right now, I think there is roughly 10 dollars on the sidelines waiting to come in if the market hardens”.

As an indicator of current ILS pricing, the historical market spread over expected losses in the public CAT bond market can be seen in the exhibit below with data sourced from Lane Financial. It is interesting to note that the average expected loss is increasing indicating CAT bonds are moving down the risk towers towards more working layer coverages.

click to enlarge

In a previous post, I argued that returns from an ILS fund index, with the net returns judgementally adjusted to get to comparable figures gross of management fees, were diverging against those from a pure CAT bond index. I argued that this divergence may illustrate that the ILS funds with exposure to the private collateralised reinsurance sector may be taking on higher risk exposures to pump returns (or may be passing risks amongst themselves in an embryonic spiral) and that ILS investors should be careful they understand the detail behind the risk profiles of the ILS funds they invest in.

Well, the final 2016 figures, as per the graph below, show that the returns in my analysis have in fact converged rather than diverged. On the face of it, this rubbishes my argument and I have to take that criticism on. Stubbornly, I could counter-argue that the ILS data used in the comparison may not reflect the returns of ILS funds with large exposure to collateralised reinsurance deals. Absent actual catastrophic events testing the range of current fund models, better data sources are needed to argue the point further.

click to enlarge

In their annual review of 2016, Lane Financial have an interesting piece on reducing transparency across both the public and private ILS sector. They characterise the private collateralised reinsurance sector as akin to a dark pool compared to the public CAT bond market which they likened to a lit exchange. Decreased transparency across the ILS sector “should send up warning flags” for all market participants as it makes calculating Net Asset Valuations (NAV) with monthly or quarterly frequency more difficult. They argue that the increased use of a relatively smaller public CAT bond market for pricing points across the ILS sector, the less credible is the overall valuation. This is another way of expressing my concern that the collateralised reinsurance market could be destabilising as it is hidden (and unregulated).

In the past, as per this post, I have questioned how the fully funded ILS market can claim to have a lower cost of capital against rated reinsurers who only have to hold capital against a percentage of their exposed limit, akin to fractional banking (see this post for more on that topic). The response is always down to the uncorrelated nature of ILS to other asset classes and therefore its attraction to investors such as pension funds who can apply a low cost of capital to the investment due to its uncorrelated and diversifying portfolio benefits. Market sponsors of ILS often use graphs such as the one below from the latest Swiss Re report to extoll the benefits of the asset class.

click to enlarge

A similar exhibit, this time from a Lombard Odier brochure, from 2016 shows ILS in an even more favourable light!

click to enlarge

As anybody who has looked through any fund marketing metrics knows, performance comparisons with other investment strategies are fraught with bias and generally postdictive. The period over which the comparison is made and the exact indices chosen (look at the differing equity indices used in the comparisons above) can make material differences. Also, the size and liquidity of a market is important, a point which may negate any reliance on ILS returns prior to 2007 for example.

I thought an interesting exercise would be to compare actual historical ILS returns, as represented by the Swiss Re Global Cat Bond Total Return Index, against total returns (i.e. share price annual change plus dividends paid in year) from equity investment in reinsurers across different time periods. The most applicable business model for comparison would be pure property catastrophe reinsurers but unfortunately there are not many of them left.

I have chosen RenRe (RNR) and Validus (VR), from 2007, as representatives of the pure property cat business model, although both have diversified their portfolios away from pure short tail business in recent years. I also selected three of the biggest European reinsurers – Munch Re, Swiss Re and Hannover Re – all of which are large diverse composite reinsurers. Finally, I constructed a US$ portfolio using equal shares of each of the five firms mentioned above (RenRe represents 40% of the portfolio until 2007 when Validus went public) with the € and CHF shares converted at each year end into dollars.

The construction of any such portfolio is postdictive and likely suffers from multiple biases. Selecting successful firms like RenRe and Validus could validly be criticised under survival bias. To counter such criticism, I would point out that the inclusion of the European reinsurers is a considerable historic drag on returns given their diverse composite footprint (and associated correlation to the market) and the exclusion of any specialist CAT firm that has been bought out in recent years, generally at a good premium, also drags down returns.

The comparison over the past 15 years, see graph below, shows that Munich and Swiss struggle to get over their losses from 2002 and 2003 and during the financial crisis. Hannover is the clear winner amongst the Europeans. The strong performance of Hannover, RenRe and Validus mean that the US$ portfolio matches the CAT bond performance after the first 10 years, albeit on a more volatile basis, before moving ahead on a cumulative basis in the last 5 years. The 15-year cumulative return is 217% for the CAT bond index and 377% return for the US$ equity portfolio.

click to enlarge

The comparison over the past 10 years, see graph below, is intriguing. Except for Validus, the CAT bond index beats all other firms and the US$ portfolio for non-volatile returns hands down in the first 5 years. Hannover, Validus and the portfolio each make a strong comeback in the most recent 5 years. The 10-year cumulative return is 125% for the CAT bond index and 189% return for the US$ equity portfolio.

click to enlarge

The comparison over the past 5 years, see graph below, shows that all firms and the portfolio handily beats the CAT bond index. Due to an absence in large loss activity over the recent past and much more shareholder friendly actions by all reinsurers, the equity returns have been steady and non-volatile. The 5-year cumulative return is 46% for the CAT bond index and 122% return for the US$ equity portfolio.

click to enlarge

Overall then, ILS may offer less volatile and uncorrelated returns but I would personally prefer the, often lumpier, historical equity returns from a selected portfolio of top reinsurers in my pension pot (we all could have both in our pension funds!). Then again, the influx of new capital into ILS has put the future viability of the traditional reinsurance business models into question so future equity returns from the sector may not be too rosy.

At the end of the day, the bottom line is whether current market risk premia is adequate, irrespective of being supplied by ILS fund managers or traditional reinsurers. Based upon what I see, I have grave misgivings about current market pricing and therefore have no financial exposure, ILS or equity or otherwise, to the market at present.

Additional Comment, 29th April 2017: The ILS website Artemis.bm had an interesting piece on comments from Torsten Jeworrek of Munich Re during their March conference call. The applicable comment is as follows:

“And now I give you another example, which is not innovation per se or not digitalization, but you know that more and more alternative capital came into the insurance industry over the last years; hedge funds, pension refunds, participating particularly in the cat business and as a trend that not all of the limits they provide, cat limits are fully collateralized anymore. That means there are 10 scenarios; hurricane, earthquake, [indiscernible], and so on; which are put together, but not 10 times the limit is collateralized, let’s say only 4 times, 5 times.

That means these hedge funds and pension funds so to speak in the future if they don’t have to provide full 100% collateralized for all the limits they provide, they need a certain credit risk for the buyer. The more they entertain, the more there’s a likelihood that this reinsurance can also fail. The question is how far will that go and this kind of not fully collateralized reinsurance, will that be then accepted as a reinsurance by the regulator or will that be penalized at a certain time otherwise we don’t have level playing field anymore, which means the traditional reinsurer who was strongly monitored and regulated and also reported as really expensive and a burden for our industry and for us and on the other hand, you have very lean pension and hedge funds who even don’t have to provide the same amount of capital for the same risk.”

Pimping the Peers (Part 2)

In the last post on this topic, I highlighted how new technologies, broadly under the fintech tag, had the potential to disrupt the banking sector, primarily by means of automating processes rather than any major reinventing of business models (although I did end that post with a bit of a rant about innovation and human behaviour). Blockchain is the hot topic that seems to be cropping up everywhere (I’ll leave that for another time). This post is about insurance and new technology, or in the jargon, insurtech.

The traditional business model in the insurance industry is not reacting well to a world of low or negative interest rates. For the life insurance sector, the duration mismatch between their liabilities and their assets is having a perverse impact as interest rates have fallen. Savings returns for aging populations have been sacrificed in Central Bank’s attempt to stimulate economic growth.

In addition, the traditional distribution channel for selling life insurer’s products, and the old adage is that these products are sold rather than bought, has relied too heavily on aging tied agents whose focus is on the wealthy client that can generate more fees than the middle class. The industry is generally at a loss on how to sell products in a low interest world to the mass market and to the new tech savvy generation. As a result, the industry and others are throwing money at a rash of new start-ups in insurance, as the exhibit on some of the current hyped firms focusing on life insurance below illustrates.

click to enlargelife-insurance-big-data

As the exhibit illustrates, the focus of these new start-ups is weighted towards technologies around product development, distribution, and underwriting. Some will likely succeed in trying to differentiate further the existing clientele of life insurers (e.g. real time health data). Many will be gobbled up or disappear. Differing attitudes between those aged under 34 and the older generation towards online distribution channels can be clearly seen in the survey results in the exhibit below.

click to enlargeattitudes-to-life-insurance-distribution-channels

With longevity and low interest rates the dominant challenges for life insurers today, automation of processes will assist in cutting expenses in the provision of products (mainly to the existing customer base) but will not likely meaningfully address the twin elephants in the room.  Citigroup reckons that in 20 of the largest OECD countries the unfunded government liability for pensions is around $78 trillion which compares to approximately $50 trillion in GDP for all OECD countries in 2015. I look forward to conversing with a robo-advisor in the near future on what products it recommends for that problem!

Insurance itself is hundreds of years old and although the wonderfully namely bottomry (the earliest form of marine hull insurance) or ancient burial societies are early examples, non-life insurance really took off with mass markets after the great fire of London in 1666.

The most hyped example of insurtech in the non-life sector is the impact of technologies on the motor business like drive-less cars and car telematics. This paper from Swiss Re shows that the impact over the next 20 years of such advances on motor premia could be dramatic.

Much of the focus from insurtech innovation is on reducing expenses, an item that the industry is not light on. The graph below shows examples of the level of acquisition and overhead expenses in the non-life sector across different jurisdictions.

click to enlargenonlife-expense-ratios

A recent report from Aon Benfield went further and looked at expenses across the value chain in the US P&C insurance sector, as below. Aon Benfield estimated overall expenses make up approximately half of gross risk premium, much of which represents juicy disruption targets for new technology in the insurtech world.

click to enlargeexpenses-across-the-value-chain

Insurance itself is based upon the law of large numbers and serves a socially useful function in reducing economic volatility by transferring risks from businesses and consumers. In 1906, Alfred Manes defined insurance as “an economic institution resting on the principle of mutuality, established for the purpose of supplying a fund, the need for which arises from a chance occurrence whose probability can be estimated”.

One of the issues identified with the current non-life insurance sector is the so-called protection gap. This is in effect where insurers’ risk management practises have got incredibly adapt at identifying and excluding those risks most likely to result in a claim. Although good for profits, it does bring the social usefulness of the transference of only the pristine risks into question (for everybody else). The graph below from Swiss Re illustrates the point by showing economic and insured losses from natural catastrophe events as a % of GDP.

click to enlargeinsurance-protection-gap-uninsured-vrs-insured-losses

It’s in the context of low investment returns and competitive underwriting markets (in themselves being driven by low risk premia across asset classes) that a new technology driven approach to the mutual insurance model is being used to attack expense and protection gap issues.

Mutuals represent the original business model for many insurers (back to burial schemes and the great fire of 1666) and still represent approximately a third of the sector in the US and Europe today. Peer to peer insurers are what some are calling the new technology driven mutuals. In fact, most of the successful P2P models to date, firms like Guevara, Friendsurance, and Inspeer are really intermediaries who pool consumers together for group discounts or self-financing of high deductibles.

Lemonade, which launched in New York this week, is a peer to peer platform which issues its own insurance policies and seeks to address the protection gap issue by offering broader coverage. The firm has been heavily reinsured by some big names in insurance like Berkshire Hathaway and Lloyd’s. It offers a fee based model, whereby the policyholders pay claims through mutualisation (assumingly by pools determined by pre-defined criteria). Daniel Schreiber, CEO and co-founder of Lemonade says that the firm will be ”the only insurer that doesn’t make money by denying claims”. Dan Ariely, a big deal in the world of Behavioral Economics, has been named as Chief Behavioral Officer, presumably in an effort to assist in constructing pools of well behaved policyholders.

The graphic below tries to illustrate how the business model is evolving (or should that be repeating?). Technology offers policyholders the opportunity to join with others to pool risk, hitherto a process that was confined to associations amongst professional groups or groups bound by location. Whether technology offers the same opportunity to underwrite risks profitably (or at least not at a loss) but with a larger reach remains to be seen.

click to enlargeinsurance-business-models

It does occur to me that it may be successful in addressing areas of dislocation in the industry, such as shortfalls in coverage for flood insurance, where a common risk and mitigant can be identified and addressed in the terms of the respective pool taking the risks on.

For specialty re/insurers, we have already seen a bifurcation between the capital providers/risk takers and the risk portfolio managers in the ILS arena. Newer technology driven mutual based insurers also offer the industry a separation of the management of risk pools and the risk capital provided to underwrite them. I wish them well in their attempts at updating this most ancient of businesses and I repeat what I said in part 1 of this post – don’t let the sweet scent of shiny new technology distract you from the smell of the risk…..

Naive Newcomers

The insurance sector has been hit by the Brexit fallout on worries about macro-economic impacts; albeit not to the same extend as the banks. Swiss Re has their latest Sigma world insurance report out. The impact of investment returns on the life insurance sector is obvious but it is interesting to see the contribution from investment income on the profitability of the aggregate of the eight largest markets in the non-life insurance sector, as per the graph from the report below.

click to enlargeNonLife Insurance Sector Profit Breakdown

The insurance sector faces a number of challenges as a recent FT article pointed out. The reinsurance sector also faces challenges, not least of which is a competitive pricing environment and the destabilising influx of new yield seeking capital through new innovations in the insurance linked securities (ILS) market. I have posted my views on the ILS sector many times (more recently here) and in this post I offer more similar thoughts. It is interesting to compare the ROEs in the Sigma report from the non-life insurance sector against those from the reinsurance sector (with the ROEs since 2005 coming from the Guy Carpenter composite index), as per the graph below.

click to enlargeGlobal Insurance & Reinsurance ROEs 1999 to 2016e

The graph is not exactly comparing like with like (e.g. non-life insurance versus composite reinsurance) but it gives the general idea of higher but more volatile ROEs in the reinsurance side compared to more stable but lower ROEs on the direct insurance side. The average since 1999 for insurance is 7% and 9% for reinsurance, with standard deviations of 3.6% and 4.6% respectively. It also confirms that ROEs are under pressure for both sectors and as capital markets continue to siphon off volatile excess catastrophe exposed business, the ROEs of the more proportional traditional reinsurance sector are converging on those of their direct brethren, although a differential will always exist given the differing business models.

It is important to note that these ROEs are returns on equity held by traditional insurers and reinsurers, the majority of which are highly rated by external agencies, who hold a small fraction of their total exposure (if measured as the sum of the policy limits issued) as capital. For example, the new European solvency framework, Solvency II, requires capital at a 1 in 200 level and it is generally assumed to be akin to a financial strength rating of BB or BBB, depending upon a firm’s risk profile.

As I argued previously (more recently in this post), these (re)insurers are akin to fractional reserve banks and I still struggle to understand how ILS structures, which are 100% collaterised, can offer their investors such an attractive return given their fully funded “capital” level in the ROE calculation. The industry argument is that investors have a lower cost of capital due to the uncorrelated nature of the pure insurance risk present in ILS.

My suspicion is that the lower cost of capital assigned by investors is reflective of a lack of understanding of the uncertainties surrounding the risks they are taking on and an over-reliance on modelling which does not fully consider the uncertainties. My fear is that capital is been leveraged or risks are been arbitraged through over-generous retrocession deals passing on under-priced risk to naive capital newcomers.

The accelerating growth in the so-called alternative capital in insurance is shown in the graph below from Aon Benfield, with growth in the private collaterised reinsurance being particularly strong in the last four years (now overshadowing the public CAT bond market). ILS funds, managed by professional asset manager specialists, are largely behind the growth in private collaterised deals with assets under management growing from $20 billion in 2012 to over $50 billion today. Private collaterised deals are usually lower down the reinsurance tower (e.g. attach at lower loss levels) and as such offer higher premiums (as a percentage of limits, aka rate on line or ROL) for the increased exposure to loss. On a risk adjusted basis, these don’t necessarily offer higher ROEs than higher attaching/lower risk CAT bonds.

click to enlargeAlternative Insurance ILS Capital Growth

Property catastrophe pricing has been under particular pressure in the past few years due to the lack of significant insured catastrophe losses. In a previous post, I crudely estimate CAT pricing to be 25% below its technical rate. Willis Re is the first of the brokers to have its mid-year renewal report out. In it, Willis said that ILS funds “were more aggressive on pricing during the second quarter as spreads declined for liquid reinsurance investments”. I also find it interesting that the collaterised ILW volumes have ticked up recently. Pricing and lax terms and conditions in the retrocession sector are historically a sign that discipline is breaking down. Asset managers in the ILS space must be under pressure in maintaining their high fees in a reduced CAT risk premia environment and this pressure is likely to be contributing to the potential for market indiscipline.

I therefore find the graph below very telling. I used the figures from Lane Financial (see here) for the annual total return figures from CAT bonds, which closely match those of the Swiss Re Total Return Index. For the ILS fund returns I used the figures from the Eurekahedge ILS Advisors Index which I adjusted to take out the not unconsiderable typical ILS fund management fees. The 2016 figures are annualized based upon published year to date figures (and obviously assume no major losses).

click to enlargeCAT Bond vrs ILS Fund Returns

The graph shows that ILS fund returns have broken with historical patterns and diverged away from those of CAT bonds as the prevalence in private collaterised deals has grown in recent years. In other words, ILS funds have moved to higher rate on line business, which is by definition higher risk, as they push to service the larger level of assets under management. The question is therefore do the investors really understand the significance of this change? Have they adjusted their cost of capital to reflect the increased risk? Or are some ILS funds representing the higher returns as their ability to get higher returns at the same risk level (against the trend of everybody else in the industry in a softening market)?

Innovation is to be encouraged and a necessary part of progress. Innovation dependent on the naivety of new investors however does not end well.

I can’t but help think of Michael Wade’s comment in 2009 about the commonality between the financial crisis and problems at Lloyds of London (see this post on lessons from Lloyds) when he said that “the consequence with the excess capital was that underlying risks could be underpriced as they were being passed on”. My advice to ILS investors is the next time they are getting a sales pitch with promises of returns that sound too good, look around the room, and ask yourself who is the greater fool here….

A Tale of Two Insurers

My negativity on the operating prospects for the reinsurance and specialty insurance sector has been articulated many times previously in this blog. Many of the same factors are impacting the broader commercial insurance market. Pricing conditions in the US and globally can be seen in the graph below.

click to enlargeUS and Global Commercial Insurance Pricing

Two insurers, at different ends of the size scale, which I have previously posted on, are AIG (more recently here and here) and Lancashire (more recently here and here). Given that a lot has happened to each since I last posted on them, I thought a quick update on both would give an interesting insight into the current market.

First up is AIG who have been under a lot of pressure from shareholders to unlock value, including a break-up plan for the insurance giant from the opportunistic rascal Carl Icahn. The graph below shows a breakdown of recent operating results (as ever with AIG longer term comparisons are hampered by their ever changing reporting segments). The improvement in the UGC mortgage insurance business has been dwarfed by the poor non-life results which were impacted by a significant reserve strengthening charge.

click to enlargeAIG PreTax Operating Income 2012 to 2015

In January, Peter Hancock (the 5th CEO since Hank Greenberg left in 2005) announced a new strategic plan to the end of 2017, the main points of which are

  • Return at least $25 billion of capital to shareholders through dividends and share buy-backs from operating profits, divestitures and other actions such as monetizing future life profits by $4-5 billion through reinsurance purchases.
  • Enhance transparency by separating into an operating portfolio with a goal of over 10% return on equity and a legacy portfolio that will focus on return of capital. Reorganize into at least nine modular, more self-contained business units to enhance accountability, transparency, and strategic flexibility.
  • Reduce general operating expenses by $1.6 billion, 14 percent of the 2015 expenses.
  • Improve the commercial P&C accident year loss ratio by six points.
  • Pursue an active divestiture program, including initially the 20% IPO of UGC.

The non-life reserve charge in 2015 amounted to $3.6 billion. 60% of the charge came from the (mainly US) casualty business, 16% from financial lines (again mainly in the US) and 15% from the run-off business. After the last material reserve strengthening in 2010, the worrying aspect of the 2015 charge is that approximately two thirds comes from accident years not yet 10 years old (which is relatively immature for long tail casualty business particularly when 42% of the charge is on excess casualty business). The impact of the reserve hikes on the commercial P&C segment can be clearly seen in the graph below.

click to enlargeAIG Commercial P&C Combined Ratio Breakdown 2008 to 2015

Perhaps the most aggressive target, given current market conditions, in the strategic plan is the 6% improvement in the commercial P&C accident year loss ratio by the end of 2017. The plan includes exiting approximately $1 billion of US casualty business, including poorly performing excess casualty business, primary and excess auto liability, health-care and financial lines business. Growth of $0.5 billion is been targeted in multi-national, financial lines, property upper middle market and major accounts which involve specialist engineering capabilities, international casualty and emerging risks such as cyber and M&A insurance. AIG also recently announced a two year reinsurance deal with Swiss Re on their US casualty book (it looks like a 25% quota share). The scale of the task for AIG in meeting this target can be seen in the exhibit below which takes a number of slides from the strategy presentation.

click to enlargeAIG Commercial P&C Metrics

I was struck by a quote from the firm on their turnaround plan – “We will use the data and analytical tools we have invested in to significantly differentiate and determine where we should focus our resources.” I suspect that every significant insurer would claim to have, or at least aspire to have, similar analytical capabilities. Big data and analytical driven underwriting is undoubtedly the future for large insurers with access to large amounts of quality data. Fortune had an interesting recent article on the analytical firm Palantir who are working with some insurers on sharpening their underwriting criteria for the social media age. An analyst in Citi even suggested that Goggle should look at buying AIG as a fintech play. The entry of the big internet firms into the insurance sector seems inevitable in some form or other, although I doubt AIG will be part of any such strategy.

As to the benefits of staying a large composite insurer, AIG cited an analysis commissioned by consultants Oliver Wyman supporting the benefits of diversification between the life and non-life business of AIG. Using the S&P consolidated model as a proxy, Oliver Wyman estimate a $7.5 billion capital benefit to AIG compared to separate life and non-life businesses, as envisaged in Icahn’s plan.

So, can AIG achieve the aggressive operational targets they have set themselves for the P&C business? Current market conditions present a considerable challenge. Combined with their recent results, an end of 2017 target for a 6% improvement is extremely aggressive. Too aggressive for my liking. However, the P&C results should improve somewhat over the short term (particularly if there is no more big reserve charges) and actions such as expense reductions, monetizing future life profits and divestitures will give AIG the fire power to hand out sweeties to shareholders. For those willing to take the punt, the return of a chunk of the $25 billion target in dividends and share buy-backs over the next 2 years for a firm with a current market value of $61 billion, trading at a 0.72 multiple to book value (trading around 0.92 of book less AOCI and DTA), may be too tempting to resist. It does have a certain allure…..

Lancashire, a London market specialty insurer and reinsurer with a mantra of disciplined underwriting, is at the opposite end of the scale spectrum with a niche focus. Long cherished by investors for its shareholder friendly dividend policies, Lancashire has been under pressure of late due to the heavy competition in its niche markets. The energy insurance sector, for example, has been described by the broker Willis as dismal with capacity chasing a smaller premium pool due to the turmoil in the oil market. A number of recent articles (such as here and here) highlight the dangers. Alex Maloney, the firm’s CEO, described the current market as “one of the most difficult trading environments during the last twenty years”. In addition, Lancashire lost its founder, Richard Brindle, in 2014 plus the CEO, the CFO and some senior underwriters of its Lloyds’ Cathedral unit in 2015.

The graph below shows the breakdown of reported historical calendar year combined ratios plus the latest accident year net loss ratio and paid ratio.

click to enlargeLancashire Ratio Breakdown 2008 to 2015

The underwriting discipline that Lancashire professes can be seen in the recent accident year loss ratios and in the 30% drop in gross written premiums (GWP), as per the graph below. The drop is more marked in net written premiums at 35% due to the increase in reinsurance spend to 25% of GWP (from approx 10% in its early years).

click to enlargeLancashire GWP Breakdown 2008 to 2015

The timely and astute increase in reinsurance protection spend can be seen in the decrease in their peak US aggregate exposures. The latest probable maximum loss (PML) estimates for their US peak exposures are approximately $200 million compared to historical levels of $300-350 million. Given the lower net premium base, the PML figures in loss ratio terms have only dropped to 40% from 50-60% historically. Lancashire summed up their reinsurance purchasing strategy as follows:

“Our outwards reinsurance programme provides a breadth and depth of cover which has helped us to strengthen our position and manage volatility. This helps us to continue to underwrite our core portfolio through the challenges posed by the cycle.”

As with AIG, the temptation for shareholders is that Lancashire will continue with their generous dividends, as the exhibit below from their Q4 2015 presentation shows.

click to enlargeLancashire Dividend History 2015

The other attraction of Lancashire is that it may become a take-over target. It currently trades at 1.4 times tangible book level which is rich compared to its US and Bermudian competitors but low compared to its peers in Lloyds’ which trade between 1.58 and 2.0 times tangible book. Lancashire itself included the exhibit below on tangible book values in its Q4 2015 presentation.

click to enlargeInsurance Tangible Book Value Multiple 2012 to 2015

It is noteworthy that there has been little activity on the insurance M&A front since the eye boggling multiples achieved by Amlin and HCC from their diversification hungry Japanese purchasers. Many in the market thought the valuations signaled the top of the M&A frenzy.

Relatively, AIG looks more attractive than Lancashire in terms of the potential for shareholder returns. However, fundamentally I cannot get away from current market conditions. Risk premia is just too low in this sector and no amount of tempting upside through dividends, buy-backs or M&A multiples can get me comfortable with the downside potential that comes with this market. As per the sentiment expressed in previous posts, I am happy with zero investment exposure to the insurance sector right now. I will watch this one play out from the sidelines.