Tag Archives: Deutsche Bank

The New Normal (Again)

I expect that next week’s reinsurance jamboree in Monte Carlo will be full of talk of innovative and technology streaming-lining business models (as per this post on AI and insurance). This recent article from the FT is just one example of claims that technology like blockchain can reduce costs by 30%. The article highlights questions about whether insurers are prepared to give up ownership of data, arguably their competitive advantage, if the technology is really to be scaled up in the sector.

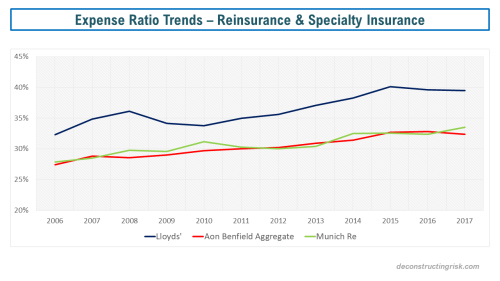
As a reminder of the reinsurance sector’s cost issues, as per this post on Lloyds’, the graph below illustrates the trend across Lloyds’, the Aon Benfield Aggregate portfolio, and Munich’s P&C reinsurance business.

click to enlarge

Until the sector gets serious about cutting costs, such as overpaid executives on luxury islands or expensive cities and antiquated business practises such as holding get togethers in places like Monte Carlo, I suspect expenses will remain an issue. In their July review, Willis stated that a “number of traditional carriers are well advanced in their plans to reduce their costs, including difficult decisions around headcount” and that “in addition to cost savings, the more proactively managed carriers are applying far greater rigor in examining the profitability of every line of business they are accepting”. Willis highlighted the potential difficulties for the vastly inefficient MGA business that many have been so actively pursuing. As an example of the type of guff executives will trot out next week, Swiss Re CEO, Christian Mumenthaler, said “we remain convinced that technology will fundamentally change the re/insurance value chain”, likely speaking from some flash office block in one of the most expensive cities in the world!

On market conditions, there was positive developments on reinsurance pricing at the January renewals after the 2017 losses with underlying insurance rates improving, as illustrated by the Marsh composite commercial rate index (example from US below).

click to enlarge

However, commentators have been getting ever more pessimistic as the year progresses, particularly after the mid-year renewals. Deutsche Bank recently called the reinsurance pricing outlook “very bleak”. A.M. Best stated that “the new normal for reinsurers appears to be one with returns that are less impressive and underwriting and fee income becoming a larger contributor to profits” and predicts, assuming a normal large loss level, an 8% ROE for 2018 for the sector. Willis, in their H1 report, puts the sectors ROE at 7.7% for H1 2018. S&P, in the latest report that is part of their Global Highlights series, also expects a ROE return for 2018 around 6% to 8% and estimates that “reinsurers are likely to barely cover their cost of capital in 2018 and 2019”.

S&P does question why “the market values the industry at a premium to book value today (on average at 1.24x at year-end 2017), and at near historical highs, given the challenges” and believes that potential capital returns, M&A and interest rate rises are all behind elevated valuations.  The recent Apollo PE deal for Aspen at 1.12 times book seems a large way off other recent multiples, as per this post, but Aspen has had performance issues. Still its interesting that no other insurer was tempted to have a go at Aspen with the obvious synergies that such a deal could have achieved. There is only a relatively small number of high quality players left for the M&A game and they will not be cheap!

As you are likely aware, I have been vocal on the impact the ILS sector has had in recent years (most recently here and here). With so-called alternative capital (at what size does it stop being alternative!) now at the $95 billion-mark according to Aon, A.M. Best makes the obvious point that “any hope for near-term improvement in the market is directly correlated to the current level of excess capacity in the overall market today, which is being compounded by the continued inflow of alternative capacity”. Insurers and reinsurers are not only increasing their usage of ILS in portfolio optimisation but are also heavily participating in the sector. The recent purchase by Markel of the industry leading and oldest ILS fund Nephila is an interesting development as Markel already had an ILS platform and is generally not prone to overpaying.

I did find this comment from Bob Swarup of Camdor in a recent Clear Path report on ILS particularly telling – “As an asset class matures it inevitably creates its own cycle and beta. At this point you expect fees to decline both as a function of the benefits of scale but also as it becomes more understood, less of it becomes alpha and more of it becomes beta” and “I do feel that the fees are most definitely too high right now and to a large extent this is because people are trying to treat this as an alternative asset class whereas it is large enough now to be part of the general mix”. Given the still relatively small size of the ILS sector, it’s difficult for ILS managers to demonstrate true alpha at scale (unless they are taking crazy leveraged bets!) and therefore pressure on current fees will become a feature.

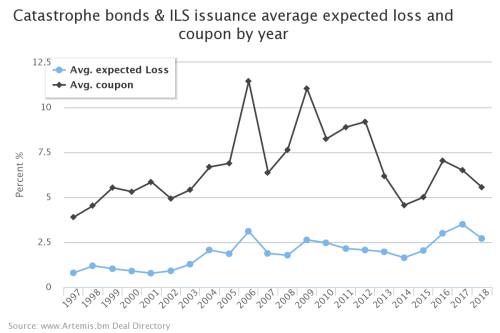
A.M. Best articulated my views on ILS succinctly as follows: “The uncorrelated nature of the industry to traditional investments does appear to have value—so long as the overall risk-adjusted return remains appropriate”. The graph below from artemis.bm shows the latest differential between returns and expected cost across the portfolio they monitor.

click to enlarge

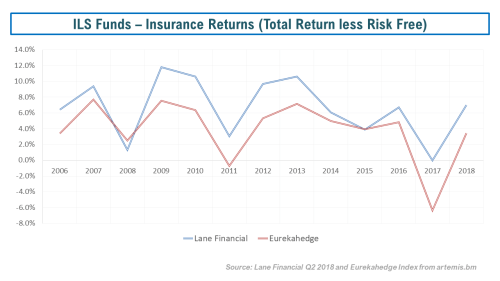
In terms of the returns from ILS funds, the graph below shows the underlying trend (with 2018 results assuming no abnormal catastrophic activity) of insurance only returns from indices calculated by Lane Financial (here) and Eurekahedge (here). Are recent 5 year average returns of between 500 and 250 basis points excess risk free enough to compensation for the risk of a relatively concentrated portfolio? Some think so. I don’t.

click to enlarge

Whether reinsurers and specialty insurers will be able to maintain superior (albeit just above CoC) recent returns over ILS, as illustrated in this post, through arbitrating lower return ILS capital or whether their bloated costs structures will catch them out will be a fascinating game to watch over the coming years. I found a section of a recent S&P report, part of their Global Highlights series, on cat exposures in the sector, amusing. It stated that in 2017 “the reinsurance industry recorded an aggregate loss that was assessed as likely to be incurred less than once in 20 years” whilst “this was the third time this had happened in less than 20 years“.

So, all in all, the story is depressingly familiar for the sector. The new normal, as so many commentators have recently called it, amounts to overcapacity, weak pricing power, bloated cost structures, and optimistic valuations. Let’s see if anybody has anything new or interesting to say in Monte Carlo next week.

As always, let’s hope there is minimal human damage from any hurricanes such as the developing Hurricane Florence or other catastrophic events in 2018.

A frazzled Goldilocks?

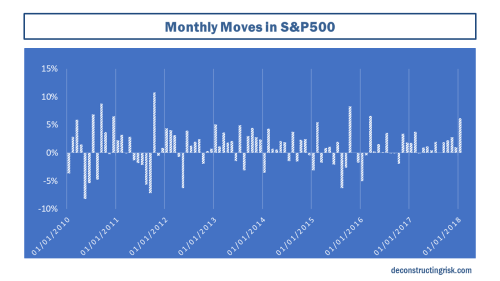
Whatever measure you look at, equities in the US are overvalued, arguably in bubble territory. Investors poured record amounts into equity funds in recent weeks as the market melt-up takes hold. One of the intriguing features of the bull market over the past 18 months has been the extraordinary low volatility. Hamish Preston of S&P Dow Jones Indices estimated that the average observed 1-month volatility in the S&P 500 in 2017 is “lower than in any other year since 1970”. To illustrate the point, the graph below shows the monthly change in the S&P500 over recent years.

click to enlarge

The lack of any action below 0% since November 2016 and any pullback greater than 2% since January 2016 is striking. “Don’t confuse lack of volatility with stability, ever” is a quote from Nassim Nicolas Taleb that’s seems particularly apt today.

Andrew Lapthorne of SocGen highlighted that low risk markets tend to have a big knock on effect with a “positive feedback mechanism embedded in many risk models”. In other words, the less risk is observed in the market and used as the basis for model inputs, the more risk the quant models allow investors to take! [The impact of quant models and shadow risks from passive investing and machine learning are areas I hope to explore further in a future post.]

One risk that has the potential to spoil the party in 2018 is the planned phased normalisation of monetary policy around the world after the great experimentations of recent years. The market is currently assuming that Central Banks will guarantee that Goldilocks will remain unfrazzled as they deftly steer the ship back to normality. A global “Goldilocks put” if I could plagiarize “the Greenspan put”! Or a steady move away from the existing policy that no greater an economic brain than Donald Trump summarized as being: “they’re keeping the rates down so that everything else doesn’t go down”.

The problem for Central Banks is that if inflation stays muted in the short-term and monetary policy remains loose than the asset bubbles will reach unsustainable levels and require pricking. Or alternatively, any attempt at monetary policy normalization may dramatically show how Central Banks have become the primary providers of liquidity in capital markets and that even modest tightening could result in dangerously imbalances within the now structurally dependent system.

Many analysts (and the number is surprising large) have been warning for some time about the impact of QE flows tightening in 2018. These warnings have been totally ignored by the market, as the lack of volatility illustrates. For example, in June 2017, Citi’s Matt King projected future Central Bank liquidity flows and warned that a “significant unbalancing is coming“. In November 2017, Deutsche Bank’s Alan Ruskin commented that “2018 will see the world’s most important Central Bank balance sheets shift from a 12 month expansion of more than $2 trillion, to a broadly flat position by the end of 2018, assuming the Fed and ECB act according to expectations”. The projections Deutsche Bank produced are below.

click to enlarge

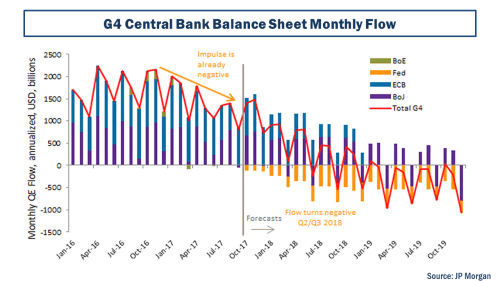
Andrew Norelli of JP Morgan Asset Management in a piece called “Stock, Flow or Impulse?” stated that “It’s still central bank balance sheets, and specifically the flow of global quantitative easing (QE) that is maintaining the buoyancy in financial asset prices”. JP Morgan’s projections of the top 4 developed countries are below.

click to enlarge

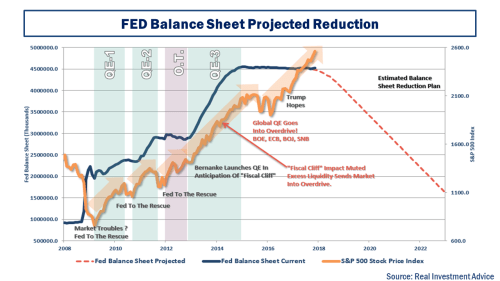
Lance Roberts of RealInvestmentAdvice.com produced an interesting graph specifically relating to the Fed’s balance sheet, as below. Caution should be taken with any upward trending metric when compared to the S&P500 in recent years!

click to enlarge

Of course, we have been at pre-taper junctions many times before and every previous jitter has been met with soothing words from Central Banks and more liquidity creation. This time though it feels different. It has to be different. Or Central Bankers risk been viewed as emperors without cloths.

The views of commentators differ widely on this topic. Most of the business media talking heads are wildly positive (as they always are) on the Goldilocks status quo. John Mauldin of MauldinEconomics.com believes the number one risk factor in the US is Fed overreach and too much tightening. Bank of America Merrill Lynch chief investment strategist Michael Hartnett, fears a 1987/1994/1998-style flash crash within the next three months caused by a withdrawal of central bank support as interest rates rise.

Christopher Cole of Artemis Capital Management, in a wonderful report called “Volatility and the Alchemy of Risk”, pulls no punches about the impact of global central banks having pumped $15 trillion in cheap money stimulus into capital markets since 2009. Cole comments that “amid this mania for investment, the stock market has begun self-cannibalizing” and draws upon the image of the ouroboros, an ancient Greek symbol of a snake eating its own tail. Cole estimates that 40% of EPS growth and 30% of US equity gains since 2009 have been as a direct result of the financial engineering use of stock buy backs. Higher interest rates, according to Cole, will be needed to combat the higher inflation that will result from this liquidity bonanza and will cut off the supply for the annual $800 billion of share buybacks. Cole also points to the impact on the high yield corporate debt market and the overall impact on corporate defaults.

Another interesting report, from a specific investment strategy perspective, is Fasanara Capital’s Francesco Filia and the cheerfully entitled “Fragile Markets On The Edge of Chaos”. As economies transition from peak QE to quantitative tightening, Filia “expect markets to face their first real crash test in 10 years” and that “only then will we know what is real and what is not in today’s markets, only then will we be able to assess how sustainable is the global synchronized GDP growth spurred by global synchronized monetary printing”. I like the graphic below from the report.

click to enlarge

I found the reaction to the Trump’s administration misstep on dollar strength interesting this week. Aditya Bhave and Ethan Harris, economists at Bank of America, said of the episode that “the Fed will see the weak dollar as a sign of easy financial conditions and a green light to keep tightening monetary policy”. ECB President Mario Draghi was not happy about the weak dollar statement as that would complicate Europe’s quantitative tightening plans. It was also interesting to hear Benoit Coeure, a hawkish member ECB executive board, saying this week that “it’s happening at different paces across the region, but we are moving to the point where we see wages going up”.

I think many of the Central Banks in developed countries are running out of wriggle room and the markets have yet to fully digest that reality. I fear that Goldilocks is about to get frazzled.

An Apple Appetite

Recently I have been trying to dig deeper into Apple (AAPL) to get a handle on what the near term may mean for this amazing company and thereby get an insight into APPL’s valuation. I have struggled with AAPL’s valuation in previous posts (here and here) but after each of my musings the share price continued on its upward trajectory.

Irrespective of whether iPhone 8 and iPhone X unit sales disappoint (due to unit shortages or otherwise) over the coming months, it seems highly probable to me that Apple will be successful in segmenting their iPhone market further over the medium term and break through the $1000 per iPhone spend in a significant way. Their R&D spend of over $10 billion (including nearly $2 billion of share options) goes a long way to ensuring customers will pay for their innovations.

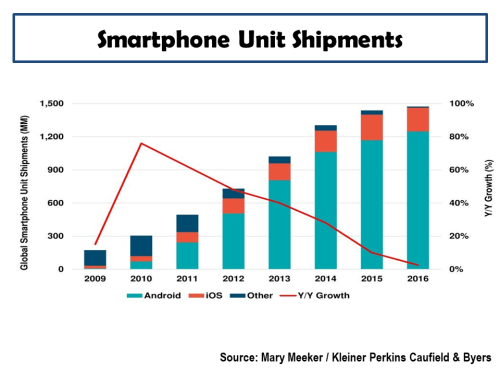
The reason why AAPL are following the current strategy is a hot topic of debate with analysts. Some see the new iPhone models feed into a super-cycle of updates and continued installed base growth, pointing to the approximate 40% of the current iPhone installed base older than 2 years. Other analysts believe that the smartphone market has plateaued (see graph from Mary Meeker below) and Apple is embarking upon a segmentation strategy to harvest their loyal customer base.

click to enlarge

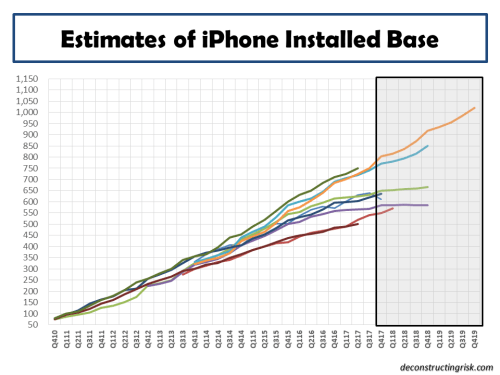
The estimates for the iPhone installed base vary significantly across analysts from 550 to 750 million units and some, such as Deutsche Bank and BoA ML further, break the base down to core and secondary non-core users. Although most of the estimates are likely out of date as they were published prior to the iPhone 8 and iPhone X announcements, the graphic below illustrates the differing views.

click to enlarge

It is likely no surprise that I am in the plateau camp on future growth of the installed base. I have assumed an installed base of 640 million as at end September 2017 and 40% or approximately 250 million of these are potential iPhones upgraders with phones older than 2 years. I have further assumed that a proportion of the installed base, I selected 10%, are secondary non-core users with a very low propensity to upgrade. That leaves an approximate 190 million potential upgrades for the FY2018. Despite the lack of growth of the market, I assumed another 10 million sales from new purchasers giving a target iPhone unit sales of 200 million for FY2018. 200 million of annual unit iPhone sales is well below most analyst estimates which average around 240 -260 million for FY2018.

Of the 200 million iPhone unit sales for FY2018, I have further assumed 45 million are iPhone X and just over half are iPhone 8, with the remainder being iPhone 7 and older models. For Q42017, I am assuming only 9 million iPhone 8 sales with 35 million of iPhone 7 and older models (influenced by the amount of inventory clearance sales I have seen in retail stores). The graph below shows my installed base assumptions, with my estimates for sales of the iPhone 8, iPhone X and it successor models over FY 2018 and FY2019 (I am assuming 200 million units is the new normal for annual iPhone sales through to FY2020).

click to enlarge

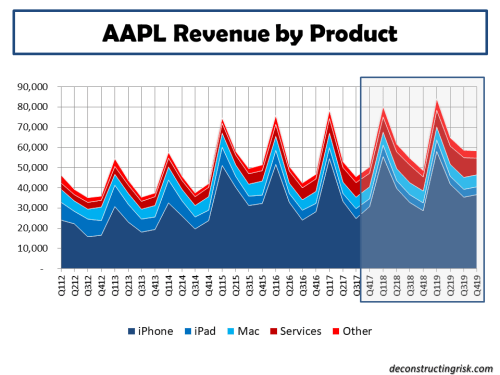
The resulting average selling price (ASP) for FY2018 is $785 with annual FY2018 revenues from iPhone of $157 billion. For FY2019, I have assumed a ASP of $860 with annual FY2019 iPhone revenues of $172 billion. The graph below shows my revenue assumptions over FY 2018 and FY2019 across all products.

click to enlarge

The EPS estimates coming out of my model, using the assumptions above (amongst others), for FY2018, FY2019 and FY2020 are $10.17, $11.45 and $11.81 respectively (I agree with the estimates of $9.00 for FY2017). That represents 13% EPS growth for 2018 and 2019, slowing to 3% in 2020. At the current share price of $160, the forward PE (excluding cash) would look as per the graph below.

click to enlarge

My analysis suggests that AAPL either deserves a higher multiple than the recent past to justify its current value or it will have to convince enough new iPhone users to buy its new products to take market share from its competitors and sell more than 200 million iPhone annually for the foreseeable future.

Given the potential headwinds for iPhone 8 and iPhone X over the short term, the current price may be difficult to defend near term as the market gets used to lower iPhone sales at higher prices (and hopefully margins too). Then again, going negative on AAPL hasn’t proven fruitful in the past and the analysts are currently hyping up AAPL’s prospects with price targets heading solidly towards $200.

Given my previous history of questioning AAPL’s valuation, maybe indecision is the best answer for the time being……

Crimping CDS

The post-crisis CDS market has undergone significant regulatory change including a substantial regulatory overhaul due to the Volcker Rule, requirements from reporting to central clearing under the Dodd–Frank Act and the European Markets Infrastructure Regulation (EMIR), and Basel III capital and liquidity regulations. Measuring the size of the market consistently is notorious difficult given different accounting treatments, netting protocols, collateral requirements, and legal enforceability standards. Many organisations have been publishing data on the market (my source is the BIS for this post) but consistency has been an issue. Although a deeply flawed metric (due to some of the reasons just highlighted and then some), the graph below on the nominal size of the CDS market (which updates this post) illustrates the point on recent trends.

click to enlarge

The gross market value (defined by BIS as the sum of the absolute values of all open contracts with either positive or negative replacement values) and the net market value (which includes counterparty netting) are better metrics and indicate the real CDS exposure is a small fraction of the nominal market size, as per the graph below.

click to enlarge

Critics of the regulatory impact on the liquidity of the CDS market argue that these instruments are a vital tool in the credit markets for hedging positions, allowing investors to efficiently express investment positions and facilitating price discovery. A major issue for liquidity in the market is the capital constraints imposed by regulators which impedes the ability of financial institutions to engage in market-making. The withdrawal of Deutsche Bank from the CDS market was seen as a major blow despite some asset managers and hedge funds stepping up to the mark.

The impact of rising interest rates in the coming years on the credit markets will likely have some interesting, and potentially unforeseen, consequences. With a plethora of Goldman Sachs alumni currently working on Trump’s “very major hair cut on Dodd-Frank”, amongst other regulations, it will be interesting to see if any amendments lead to a shot in the arm for the CDS market. Jamie Dimon, in his most recent shareholder letter, calls for an approach by Trumps’ lieutenants “to open up the rulebook in the light of day and rework the rules and regulations that don’t work well or are unnecessary”.


June 2020 Update – Below is the CD graph updated to the end of 2019. For Ingrid.

One Direction

Goldman Sachs says “we have more potential for shocks right now”. Deutsche Bank and Bank of America Merrill Lynch predict a pick-up in volatility to hit equities. The ever positive Albert Edwards of Socgen points to a recent IMF report on debt and trashes the Fed with the quip “these dudes will never identify an asset bubble at least before the event!

In the IMF report referenced above, and other reports published by the IMF this month, there is some interesting analysis and a sample of the accompanying graphs are reproduced below.

All of these graphs show trends going inexorably in one direction. Add in dollops of (not unrelated) political risk particularly in the UK and across Europe, and that direction looks like trouble ahead.

click to enlargeimf-gross-global-debt-as-of-gdp

click to enlargeimf-private-debt-during-deleveraging-periods

click to enlargeimf-decomposition-of-equity-valuations-october-2016

click to enlargeimf-global-real-rates

click to enlargeimf-report-sovereign-bond-yields-and-term-premiums

click to enlargeimf-report-banking-sector

click to enlargeimf-report-pension-deficits