Tag Archives: AAPL revenue projections

An Apple Appetite

Recently I have been trying to dig deeper into Apple (AAPL) to get a handle on what the near term may mean for this amazing company and thereby get an insight into APPL’s valuation. I have struggled with AAPL’s valuation in previous posts (here and here) but after each of my musings the share price continued on its upward trajectory.

Irrespective of whether iPhone 8 and iPhone X unit sales disappoint (due to unit shortages or otherwise) over the coming months, it seems highly probable to me that Apple will be successful in segmenting their iPhone market further over the medium term and break through the $1000 per iPhone spend in a significant way. Their R&D spend of over $10 billion (including nearly $2 billion of share options) goes a long way to ensuring customers will pay for their innovations.

The reason why AAPL are following the current strategy is a hot topic of debate with analysts. Some see the new iPhone models feed into a super-cycle of updates and continued installed base growth, pointing to the approximate 40% of the current iPhone installed base older than 2 years. Other analysts believe that the smartphone market has plateaued (see graph from Mary Meeker below) and Apple is embarking upon a segmentation strategy to harvest their loyal customer base.

click to enlarge

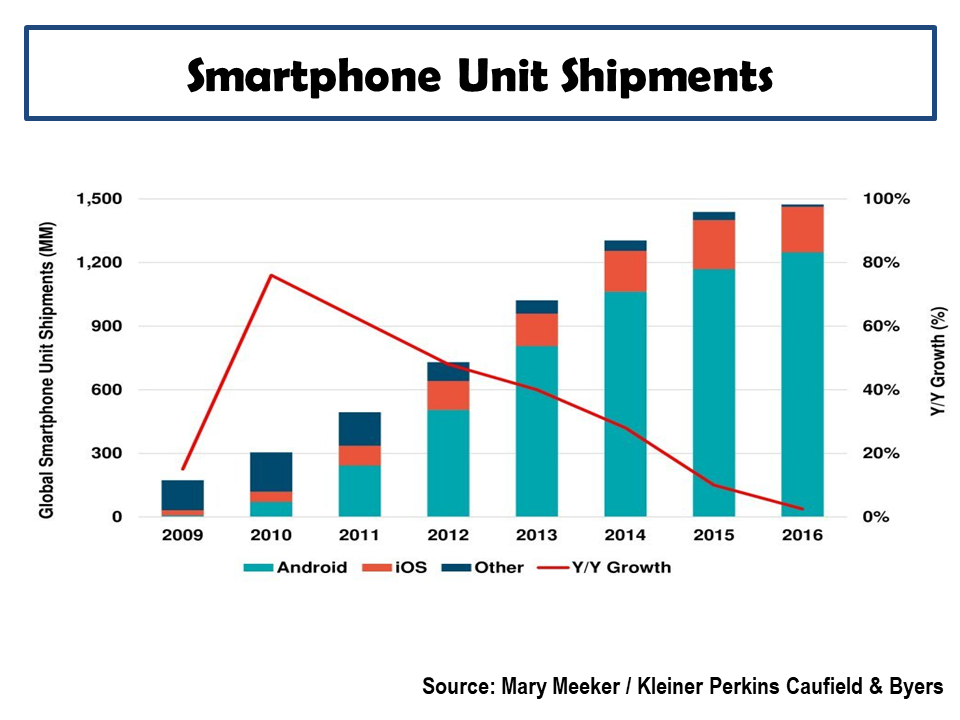
The estimates for the iPhone installed base vary significantly across analysts from 550 to 750 million units and some, such as Deutsche Bank and BoA ML further, break the base down to core and secondary non-core users. Although most of the estimates are likely out of date as they were published prior to the iPhone 8 and iPhone X announcements, the graphic below illustrates the differing views.

click to enlarge

It is likely no surprise that I am in the plateau camp on future growth of the installed base. I have assumed an installed base of 640 million as at end September 2017 and 40% or approximately 250 million of these are potential iPhones upgraders with phones older than 2 years. I have further assumed that a proportion of the installed base, I selected 10%, are secondary non-core users with a very low propensity to upgrade. That leaves an approximate 190 million potential upgrades for the FY2018. Despite the lack of growth of the market, I assumed another 10 million sales from new purchasers giving a target iPhone unit sales of 200 million for FY2018. 200 million of annual unit iPhone sales is well below most analyst estimates which average around 240 -260 million for FY2018.

Of the 200 million iPhone unit sales for FY2018, I have further assumed 45 million are iPhone X and just over half are iPhone 8, with the remainder being iPhone 7 and older models. For Q42017, I am assuming only 9 million iPhone 8 sales with 35 million of iPhone 7 and older models (influenced by the amount of inventory clearance sales I have seen in retail stores). The graph below shows my installed base assumptions, with my estimates for sales of the iPhone 8, iPhone X and it successor models over FY 2018 and FY2019 (I am assuming 200 million units is the new normal for annual iPhone sales through to FY2020).

click to enlarge

The resulting average selling price (ASP) for FY2018 is $785 with annual FY2018 revenues from iPhone of $157 billion. For FY2019, I have assumed a ASP of $860 with annual FY2019 iPhone revenues of $172 billion. The graph below shows my revenue assumptions over FY 2018 and FY2019 across all products.

click to enlarge

The EPS estimates coming out of my model, using the assumptions above (amongst others), for FY2018, FY2019 and FY2020 are $10.17, $11.45 and $11.81 respectively (I agree with the estimates of $9.00 for FY2017). That represents 13% EPS growth for 2018 and 2019, slowing to 3% in 2020. At the current share price of $160, the forward PE (excluding cash) would look as per the graph below.

click to enlarge

My analysis suggests that AAPL either deserves a higher multiple than the recent past to justify its current value or it will have to convince enough new iPhone users to buy its new products to take market share from its competitors and sell more than 200 million iPhone annually for the foreseeable future.

Given the potential headwinds for iPhone 8 and iPhone X over the short term, the current price may be difficult to defend near term as the market gets used to lower iPhone sales at higher prices (and hopefully margins too). Then again, going negative on AAPL hasn’t proven fruitful in the past and the analysts are currently hyping up AAPL’s prospects with price targets heading solidly towards $200.

Given my previous history of questioning AAPL’s valuation, maybe indecision is the best answer for the time being……

Apple Average

It’s always strange when you have a relief rally in a stock (in after hours at least) because the actual results are not as bad as expected. So it seems to be with AAPL’s Q3 results. iPhone sales were not as bad as expected (albeit the lowest unit iPhone sales in 7 quarters at just above 40 million units) and the current quarter revenue guidance was above expectations. The average revenue per phone was below $600 for the first time in 2 years due to the the latest models with promises of improvements from management in future quarters. When the dust settles on the Q3 results though it could be time to finally reassess AAPL’s future trajectory.

The graph below shows the latest results by product which illustrate just how poor a quarter this was relative to historical trends, with services being the sole bright spot.

click to enlarge

AAPL Revenue by product Q32016

The split by revenue by region again illustrates the challenges AAPL is having in China. It also shows the lackluster response to Apple’s current products in the US.

click to enlargeAAPL Revenue by region Q32016

On valuation, AAPL still looks reasonable on a forward PE excluding cash basis (using analysts estimates for the next 4 quarters), as per the graph below.

click to enlarge

AAPL Forward 12 Month PE Ratio Q32016

The bulls are hyping up the iPhone 7 cycle as a source of future growth which is now the tired but only realistic growth thesis for AAPL. In the medium term however AAPL looks range bound around $100.

Apples’ options

Nothing that has occurred concerning Apple (AAPL) since my previous post in April has radically changed my view. The shareholder friendly proposals announced at the last quarterly call and the updates announced  at the recent conference don’t alter the fundamentals. Reduced margins and revenue growth from the flagship iPhone product lines may be partially offset by iPad growth and service revenues (from the likes of iRadio) but Apple’s trajectory is now looking like it’s status as a growth stock is in the past. In short, I think AAPL will trade within a range around +/-20% of its current level until its medium term future is more certain. I don’t see much of a compelling investment case in the short term as I do not think that the market has yet fully grasped the new reality for Apple (e.g. analyst targets still look too rosy to me). I think Apple’s future lies in reinforcing its ecosystem through upgrades, new services and incremental changes to product offerings. New product offerings may restore Apple’s growth status but nothing currently being speculated on seems to be a game changer to me.

I did have a quick look at Apples’ options for opportunities. I used data from Yahoo last weekend at $430 AAPL (I would caution against using data from sources like Yahoo for detailed analysis but they are generally okay for a rough initial feel), as per the graph below (click to enlarge).

Apples optionsGiven the recent volatility in the stock and the current uncertainty, it was no surprise to find that Apple’s options are expensive with significant time decay premia. The option curves are skewed on the upside which reflects current market expectations and doesn’t offer any normal distribution mispricing opportunities.  My analysis show that Apple’s balance sheet limits the downside potential beyond a 30% drop. I was thinking of a possible strategy along the lines of buying the stock and using the dividend to put downside protection but the curve shows that would provide for only a 6 month put at a strike around $360 – not a strategy that is compelling given my views and lack of conviction on the stock.

I do use options occasionally, primarily for two reasons – for risk management purposes (mainly insurance on downsides) or as an investment on a stock by way of an out of the money option that I think will breakout of a historically range (generally on upside but equally valid for downside punt also).  For the latter purpose, the difficulty is finding a liquid out of the money option market over 12 months on such breakout opportunities. Many people follow strategies such as selling puts or calls to supplement returns, such as the one in this article on Apple. I really don’t get these strategies (negative gamma in trader speak). Why take such downside (albeit tail) risk for such little upside? Seems like the ultimate pennies in front of a steamroller play to me. Add in the negative liquidity impacts of the strategy in a stress scenario (just when liquidity becomes so valuable) highlights further the dangers. In the words of the prop trader interviewed in “Inside the House of Money”, Steven Drobny’s excellent book, “you should never be short gamma“.