
It’s always strange when you have a relief rally in a stock (in after hours at least) because the actual results are not as bad as expected. So it seems to be with AAPL’s Q3 results. iPhone sales were not as bad as expected (albeit the lowest unit iPhone sales in 7 quarters at just above 40 million units) and the current quarter revenue guidance was above expectations. The average revenue per phone was below $600 for the first time in 2 years due to the the latest models with promises of improvements from management in future quarters. When the dust settles on the Q3 results though it could be time to finally reassess AAPL’s future trajectory.
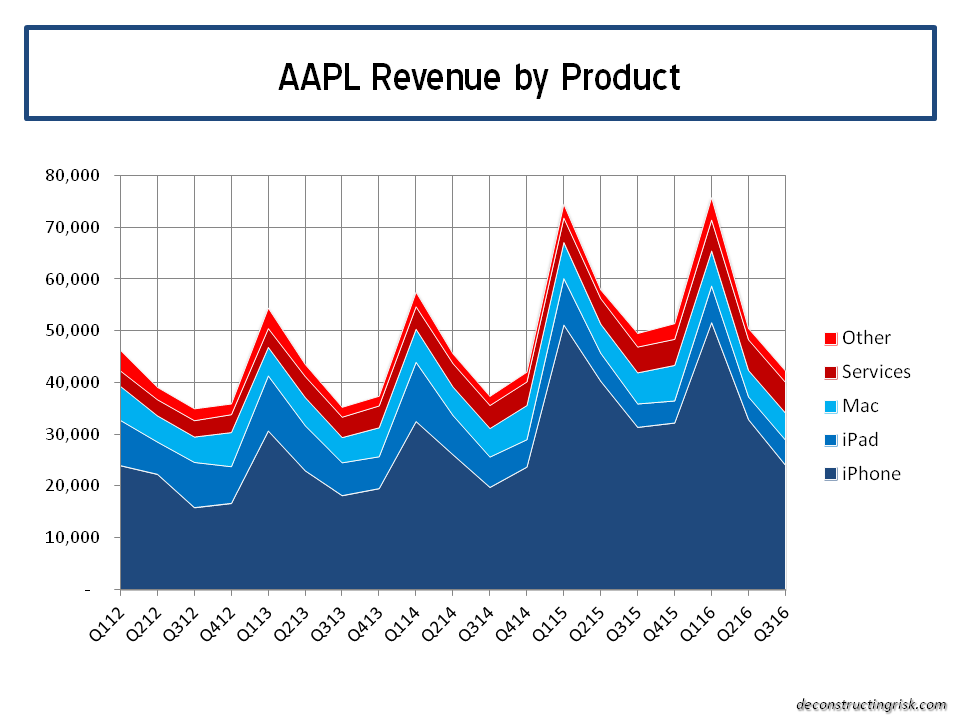
The graph below shows the latest results by product which illustrate just how poor a quarter this was relative to historical trends, with services being the sole bright spot.
click to enlarge
The split by revenue by region again illustrates the challenges AAPL is having in China. It also shows the lackluster response to Apple’s current products in the US.
click to enlarge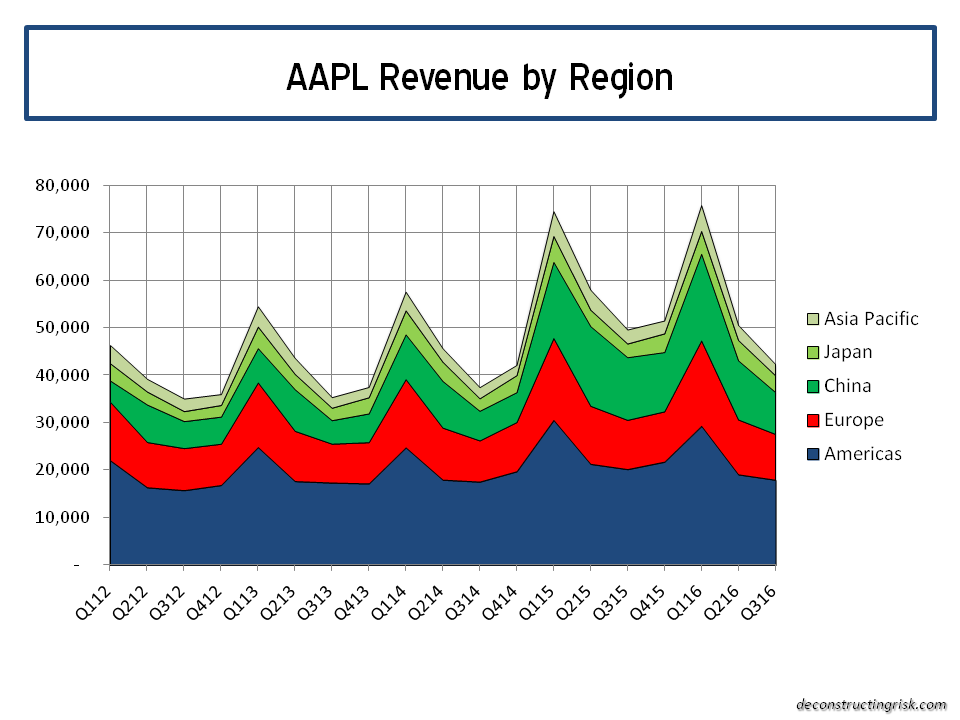
On valuation, AAPL still looks reasonable on a forward PE excluding cash basis (using analysts estimates for the next 4 quarters), as per the graph below.
click to enlarge

The bulls are hyping up the iPhone 7 cycle as a source of future growth which is now the tired but only realistic growth thesis for AAPL. In the medium term however AAPL looks range bound around $100.
