Tag Archives: Lancashire

Multiple Temptation

I thought it was time for a quick catch up on all things reinsurance and specialty insurance since my last post a year ago. At that time, it looked like the underlying rating environment was gaining momentum and a hoped-for return to underwriting profitability looked on the cards. Of course, since then, the big game changer has been COVID-19.

A quick catch-up on the 2019 results, as below, from the Aon Reinsurance Aggregate (ARA) results of selected firms illustrates the position as we entered this year. It is interesting to note that reserve releases have virtually dried up and the 2019 accident year excluding cats is around 96%.

The Willis Re subset of aggregate results is broadly similar to the ARA (although it contains a few more of the lesser players and some life reinsurers and excludes firms like Beazley and Hiscox) and it shows that on an underling basis (i.e. accident year with normalised cat load), the trend is still upwards and more rate improvement is needed to improve attritional loss ratios.

The breakdown of the pre-tax results of the ARA portfolio, as below, shows that investment returns and gains saved the day in 2019.

The ROE’s of the Willis portfolio when these gains were stripped out illustrates again how underwriting performance needs to improve.

Of course, COVID-19 has impacted the sector both in terms of actual realised losses (e.g. event cancellations) and with the cloud of uncertainty over reserves for multiple exposures yet to be fully realised. There remains much uncertainty in the sector about the exact size of the potential losses with industry estimates ranging widely. Swiss Re recently put the figure at between $50-80 billion. To date, firms have established reserves of just over $20 billion. One of the key uncertainties is the potential outcome of litigation around business interruption cover. The case brought in the UK by the FCA on behalf of policyholders hopes to expedite lengthy legal cases over the main policy wordings with an outcome expected in mid-September. Lloyds industry insurance loss estimate is within the Swiss Re range and their latest June estimate is shown below against other historical events.

I think Alex Maloney of Lancashire summarised the situation well when he said that “COVID-19 is an ongoing event and a loss which will take years to mature”, adding that for “the wider industry the first-party claims picture will not be clear until 2021”. Evan Greenberg of Chubb described the pandemic as a slow rolling global catastrophe impacting virtually all countries, unlike other natural catastrophes it has no geographic or time limits and the event continues as we speak” and predicted that “together the health and consequent economic crisis will likely produce the largest loss in insurance history, particularly considering its worldwide scope and how both sides of the balance sheet are ultimately impacted”.

The immediate impact of COVID-19 has been on rates with a significant acceleration of rate hardening across most lines of business, with some specialty lines such as certain D&O covers have seen massive increases of 50%+. Many firms are reporting H1 aggregate rate increases of between 10% to 15% across their diversified portfolios. Insurance rate increases over the coming months and reinsurance rates at the January renewals, assuming no material natural cats in H2 2020, will be the key test as to whether a true hard market has arrived. Some insurers are already talking about increasing their risk retentions and their PMLs for next year in response to reinsurance rate hardening.

Valuations in the sector have taken a hit as the graph below from Aon on stock performance shows.

Leaving the uncertainty around COVID-19 to one side, tangible book multiples amongst several of my favourite firms since this March 2018 post, most of whom have recently raised additional capital in anticipation of a broad hard market in specialty insurance and reinsurance market, look tempting, as below.

The question is, can you leave aside the impact of COVID-19? That question is worthy of some further research, particularly on the day that Hiscox increased their COVID-19 reserves from $150 million to $230 million and indicated a range of a £10 million to £250 million hit if the UK business interruption case went against them (the top of the range estimate would reduce NTAs by 9%).

Food for thought.

Creepy Things

It has been a while since I looked at the state of the reinsurance and specialty insurance markets. Recent market commentary and insurers’ narratives at recent results have suggested market rates are finally firming up, amidst talk of reserve releases drying up and loss creep on recent events.

Just yesterday, Bronek Masojada the CEO of Hiscox commented that “the market is in a better position than it has been for some time”. The Lancashire CEO Alex Maloney said he was “encouraged by the emerging evidence that the (re)insurance market is now experiencing the long-anticipated improvements in discipline and pricing”. The Chubb CEO Evan Greenberg said that “pricing continued to tighten in the quarter while spreading to more classes and segments of business, particularly in the U.S. and London wholesale market”.

A look at the historical breakdown of combined ratios in the Aon Benfield Aggregate portfolio from April (here) and Lloyds results below illustrate the downward trend in reserve releases in the market to the end of 2018. The exhibits also indicate the expense disadvantage that Lloyds continues to operate under (and the reason behind the recently announced modernisation drive).

click to enlarge

click to enlarge

In the Willis Re mid-year report called “A Discerning Market” their CEO James Kent said “there are signs that the longstanding concern over the level of reserve redundancy in past year reserves is coming to fruition” and that in “some classes, there is a clear trend of worsening loss ratios in recent underwriting years due to a prolonged soft market and an increase in loss severity.

 In their H1 presentation, Hiscox had an exhibit that quantified some of the loss creep from recent losses, as below.

click to enlarge

The US Florida hurricane losses have been impacted by factors such as assignment of benefits (AOB) in litigated water claims and subsequently inflating repair costs. Typhoon Jebi losses have been impacted by overlapping losses and demand surge from Typhoon Trami, the Osaka earthquake and demand from Olympics construction. Arch CEO Marc Grandisson believes that the market missed the business interruption and contingent BI exposures in Jebi estimates.

The fact that catastrophic losses are unpredictable, even after the event, is no surprise to students of insurance history (this post on the history of Lloyds is a testament to unpredictability). Technology and advances in modelling techniques have unquestionably improved risk management in insurance in recent years. Notwithstanding these advances, uncertainty and the unknown should always be considered when model outputs such as probability of loss and expected loss are taken as a given in determining risk premium.

To get more insight into reserve trends, it’s worth taking a closer look at two firms that have historically shown healthy reserve releases – Partner Re and Beazley. From 2011 to 2016, Partner Re’s non-life business had an average reserve release of $675 million per year which fell to $450 million in 2017, and to $250 million in 2018. For H1 2019, that figure was $15 million of reserve strengthening. The exhibit below shows the trend with 2019 results estimated based upon being able to achieve reserve releases of $100 million for the year and assuming no major catastrophic claims in 2019. Despite the reduction in reserve releases, the firm has grown its non-life business by double digits in H1 2019 and claims it is “well-positioned to benefit from this improved margin environment”.

click to enlarge

Beazley is one of the best insurers operating from London with a long history of mixing innovation with a balanced portfolio. It has doubled its net tangible assets (NTA) per share over the past 10 years and trades today at a 2.7 multiple to NTA. Beazley is also predicting double digit growth due to an improving rating environment whilst predicting “the scale of the losses that we, in common with the broader market, have incurred over the past two years means that below average reserve releases will continue this year”.

click to enlarge

And that’s the rub. Although reserves are dwindling, rate improvements should help specialty (re)insurers to rebuild reserves and improve profitability back above its cost of capital, assuming normal catastrophe loss levels. However, market valuations, as reflected by the Aon Benfield price to book exhibit below, look like they have all that baked in already.

click to enlarge

And that’s a creepy thing.

A Tale of Two Insurers

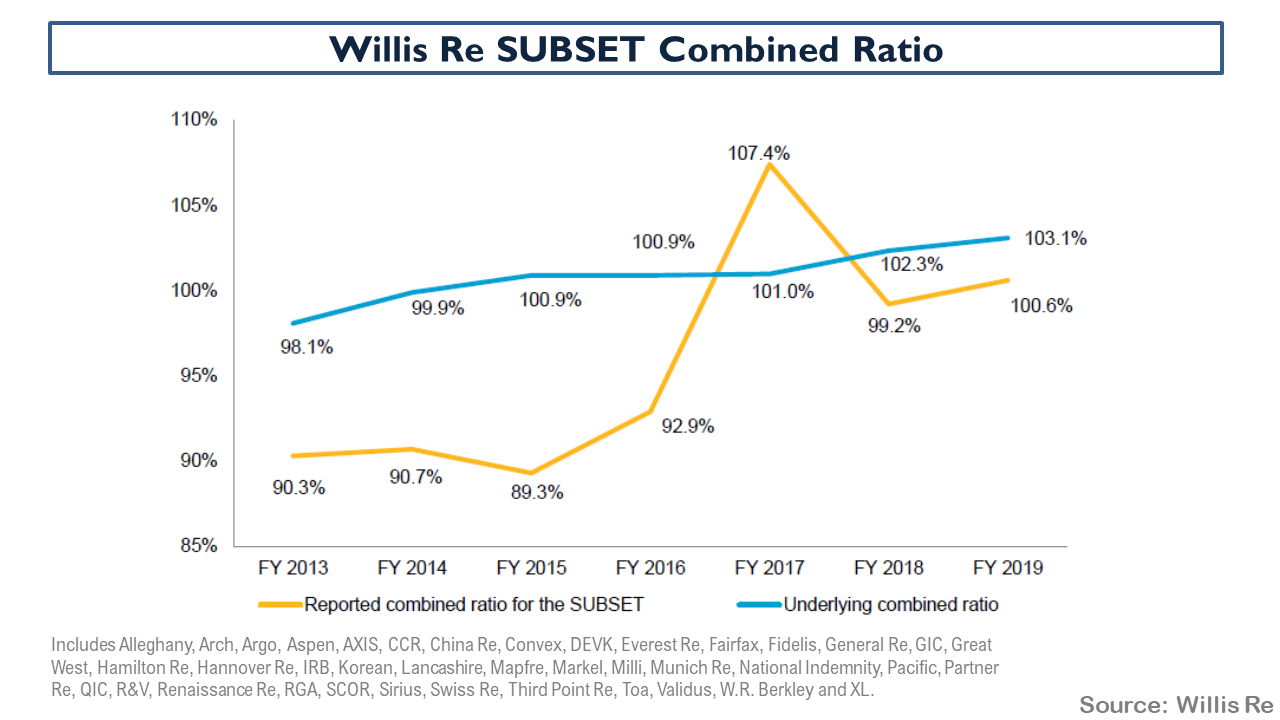
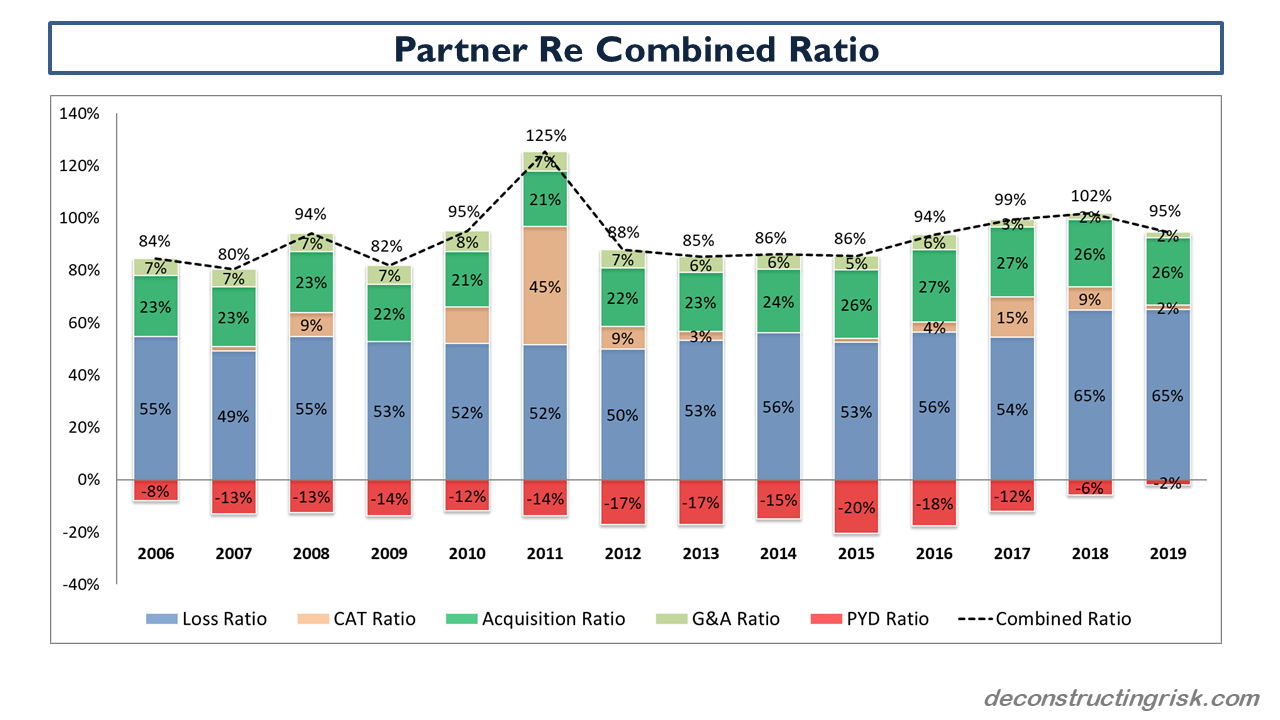
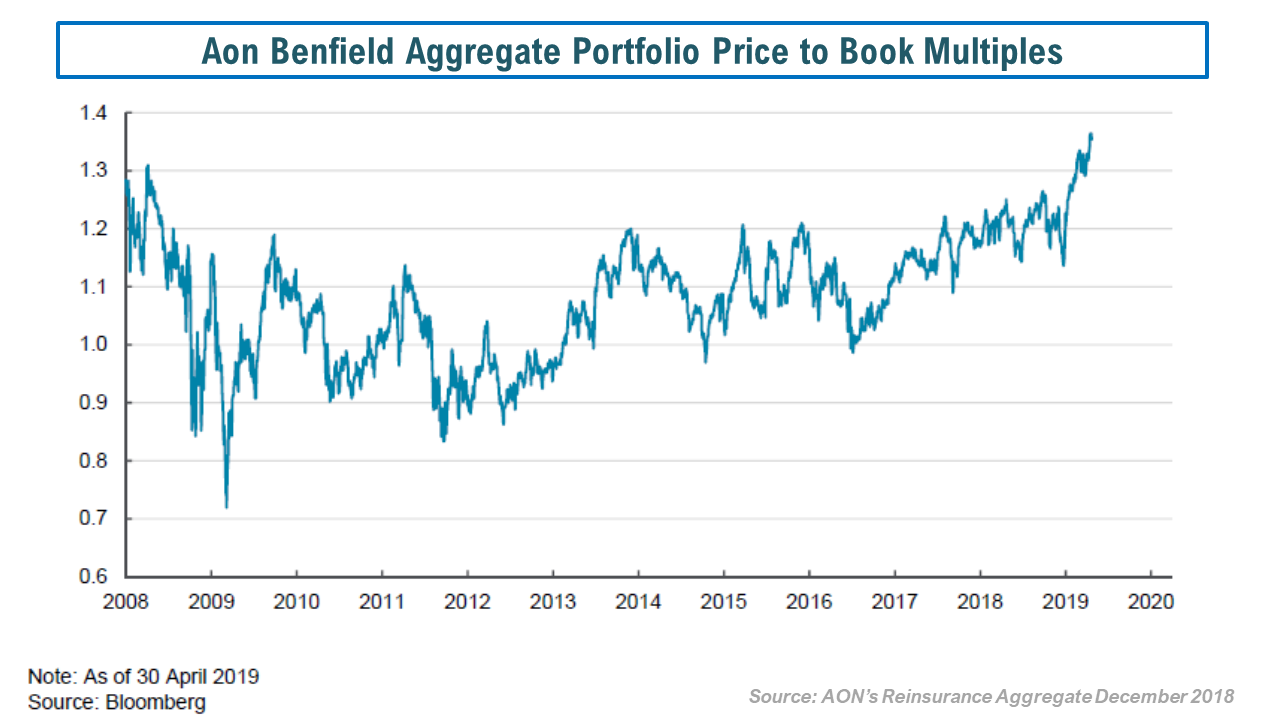
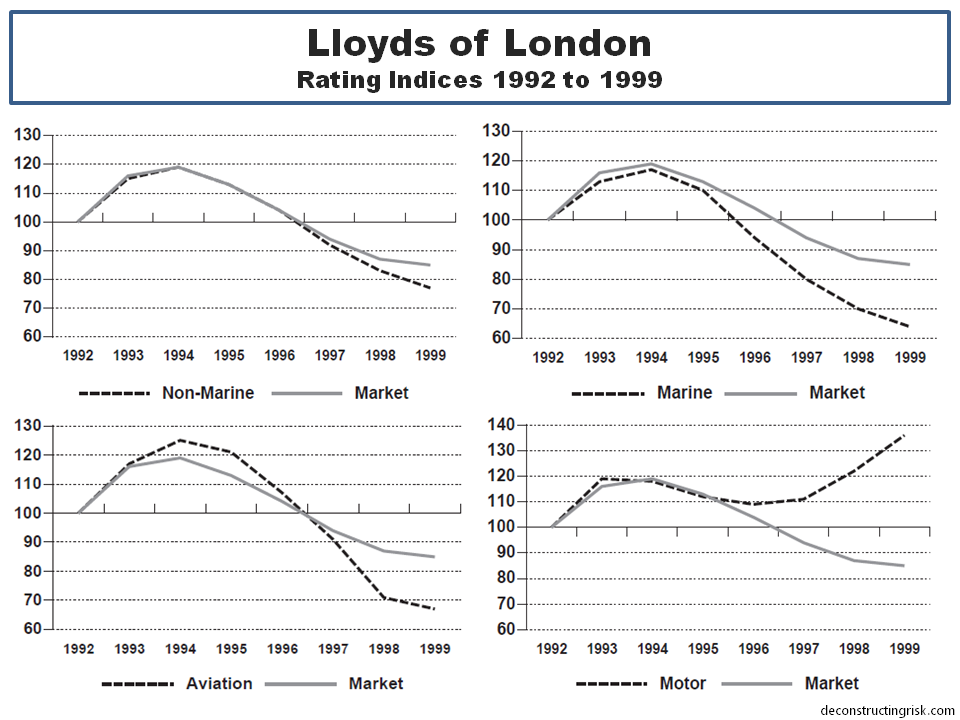
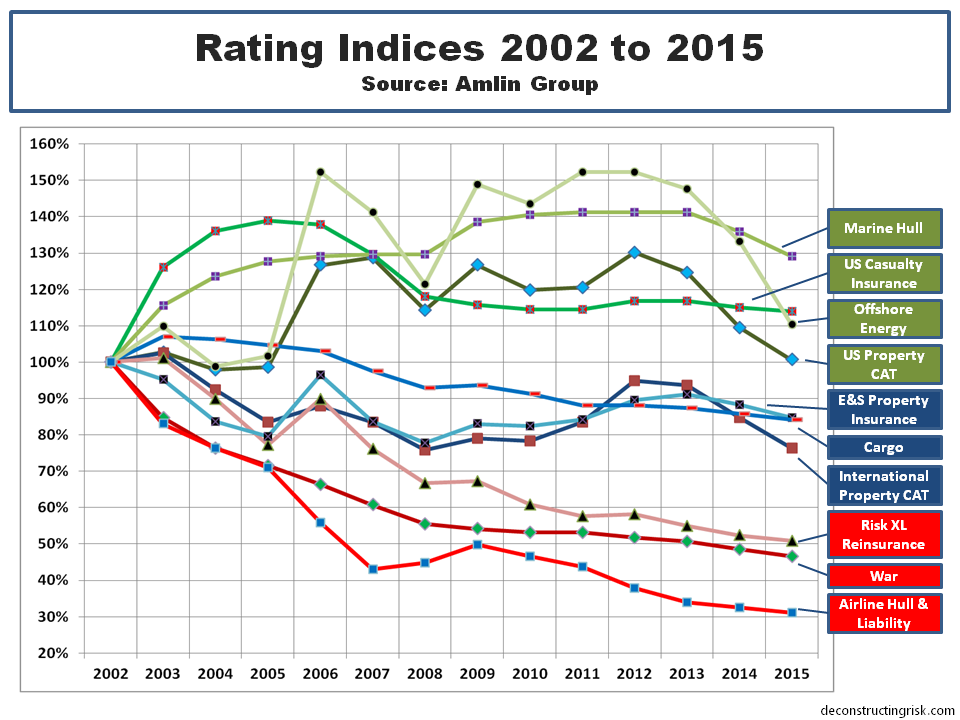
My negativity on the operating prospects for the reinsurance and specialty insurance sector has been articulated many times previously in this blog. Many of the same factors are impacting the broader commercial insurance market. Pricing conditions in the US and globally can be seen in the graph below.

click to enlargeUS and Global Commercial Insurance Pricing

Two insurers, at different ends of the size scale, which I have previously posted on, are AIG (more recently here and here) and Lancashire (more recently here and here). Given that a lot has happened to each since I last posted on them, I thought a quick update on both would give an interesting insight into the current market.

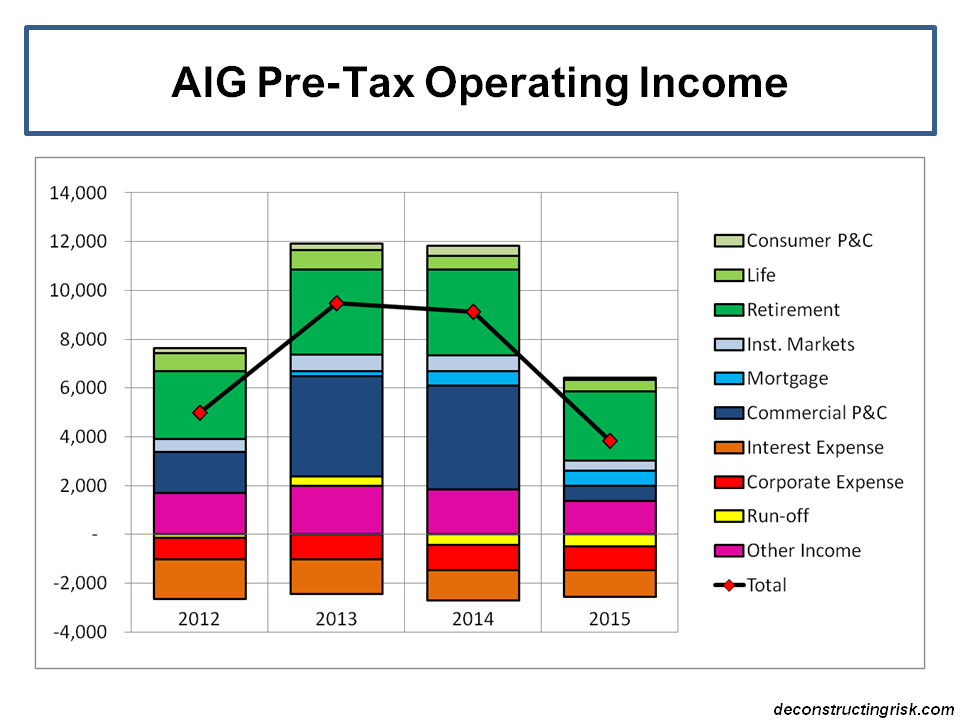
First up is AIG who have been under a lot of pressure from shareholders to unlock value, including a break-up plan for the insurance giant from the opportunistic rascal Carl Icahn. The graph below shows a breakdown of recent operating results (as ever with AIG longer term comparisons are hampered by their ever changing reporting segments). The improvement in the UGC mortgage insurance business has been dwarfed by the poor non-life results which were impacted by a significant reserve strengthening charge.

click to enlargeAIG PreTax Operating Income 2012 to 2015

In January, Peter Hancock (the 5th CEO since Hank Greenberg left in 2005) announced a new strategic plan to the end of 2017, the main points of which are

  • Return at least $25 billion of capital to shareholders through dividends and share buy-backs from operating profits, divestitures and other actions such as monetizing future life profits by $4-5 billion through reinsurance purchases.
  • Enhance transparency by separating into an operating portfolio with a goal of over 10% return on equity and a legacy portfolio that will focus on return of capital. Reorganize into at least nine modular, more self-contained business units to enhance accountability, transparency, and strategic flexibility.
  • Reduce general operating expenses by $1.6 billion, 14 percent of the 2015 expenses.
  • Improve the commercial P&C accident year loss ratio by six points.
  • Pursue an active divestiture program, including initially the 20% IPO of UGC.

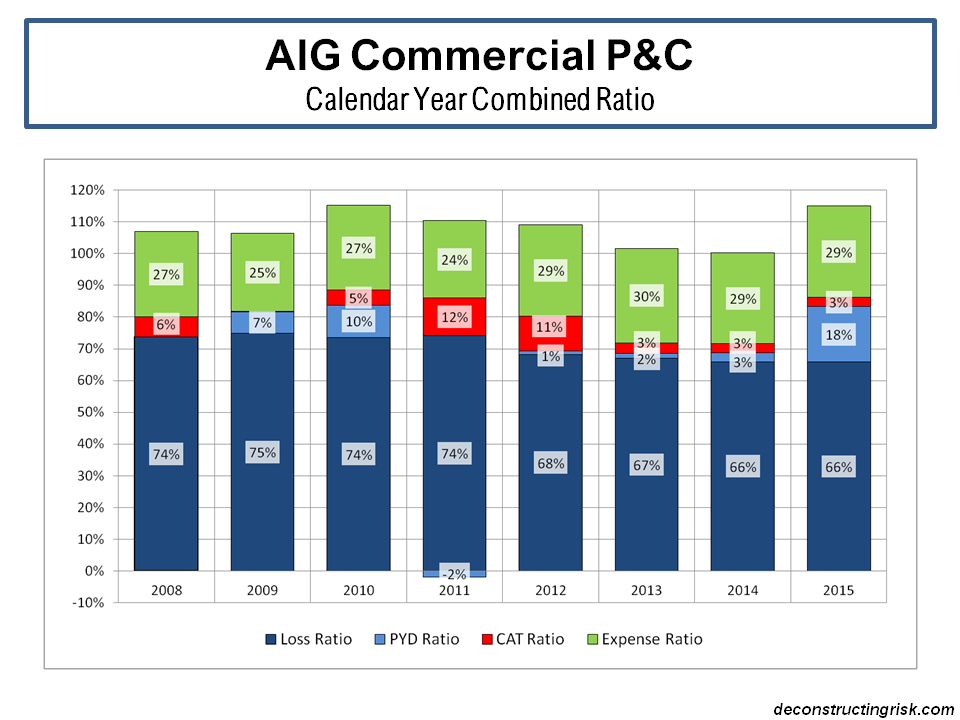
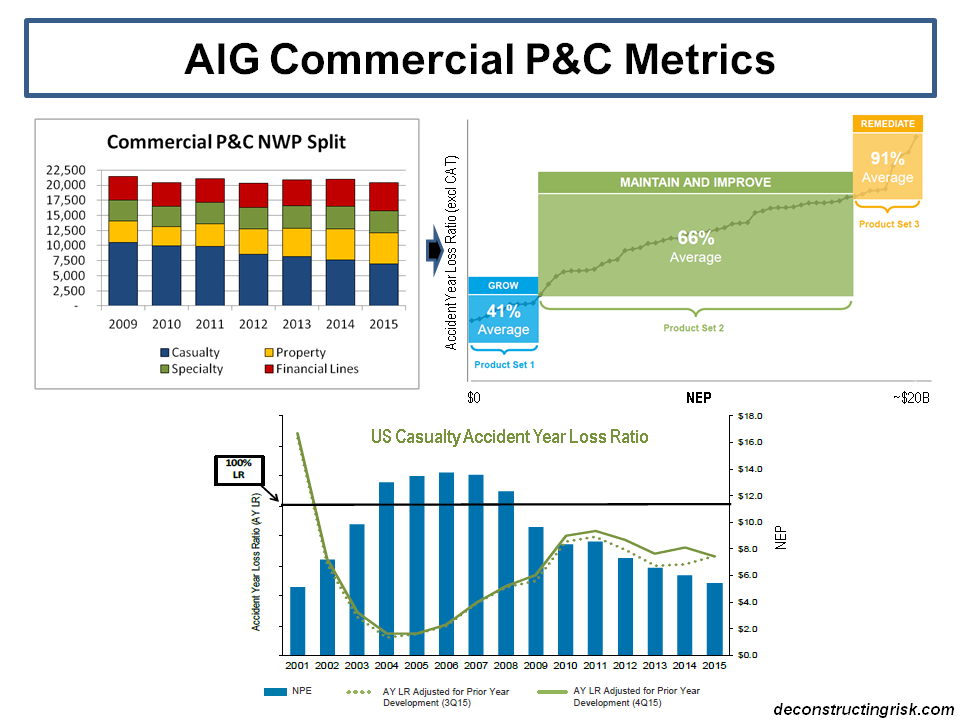
The non-life reserve charge in 2015 amounted to $3.6 billion. 60% of the charge came from the (mainly US) casualty business, 16% from financial lines (again mainly in the US) and 15% from the run-off business. After the last material reserve strengthening in 2010, the worrying aspect of the 2015 charge is that approximately two thirds comes from accident years not yet 10 years old (which is relatively immature for long tail casualty business particularly when 42% of the charge is on excess casualty business). The impact of the reserve hikes on the commercial P&C segment can be clearly seen in the graph below.

click to enlargeAIG Commercial P&C Combined Ratio Breakdown 2008 to 2015

Perhaps the most aggressive target, given current market conditions, in the strategic plan is the 6% improvement in the commercial P&C accident year loss ratio by the end of 2017. The plan includes exiting approximately $1 billion of US casualty business, including poorly performing excess casualty business, primary and excess auto liability, health-care and financial lines business. Growth of $0.5 billion is been targeted in multi-national, financial lines, property upper middle market and major accounts which involve specialist engineering capabilities, international casualty and emerging risks such as cyber and M&A insurance. AIG also recently announced a two year reinsurance deal with Swiss Re on their US casualty book (it looks like a 25% quota share). The scale of the task for AIG in meeting this target can be seen in the exhibit below which takes a number of slides from the strategy presentation.

click to enlargeAIG Commercial P&C Metrics

I was struck by a quote from the firm on their turnaround plan – “We will use the data and analytical tools we have invested in to significantly differentiate and determine where we should focus our resources.” I suspect that every significant insurer would claim to have, or at least aspire to have, similar analytical capabilities. Big data and analytical driven underwriting is undoubtedly the future for large insurers with access to large amounts of quality data. Fortune had an interesting recent article on the analytical firm Palantir who are working with some insurers on sharpening their underwriting criteria for the social media age. An analyst in Citi even suggested that Goggle should look at buying AIG as a fintech play. The entry of the big internet firms into the insurance sector seems inevitable in some form or other, although I doubt AIG will be part of any such strategy.

As to the benefits of staying a large composite insurer, AIG cited an analysis commissioned by consultants Oliver Wyman supporting the benefits of diversification between the life and non-life business of AIG. Using the S&P consolidated model as a proxy, Oliver Wyman estimate a $7.5 billion capital benefit to AIG compared to separate life and non-life businesses, as envisaged in Icahn’s plan.

So, can AIG achieve the aggressive operational targets they have set themselves for the P&C business? Current market conditions present a considerable challenge. Combined with their recent results, an end of 2017 target for a 6% improvement is extremely aggressive. Too aggressive for my liking. However, the P&C results should improve somewhat over the short term (particularly if there is no more big reserve charges) and actions such as expense reductions, monetizing future life profits and divestitures will give AIG the fire power to hand out sweeties to shareholders. For those willing to take the punt, the return of a chunk of the $25 billion target in dividends and share buy-backs over the next 2 years for a firm with a current market value of $61 billion, trading at a 0.72 multiple to book value (trading around 0.92 of book less AOCI and DTA), may be too tempting to resist. It does have a certain allure…..

Lancashire, a London market specialty insurer and reinsurer with a mantra of disciplined underwriting, is at the opposite end of the scale spectrum with a niche focus. Long cherished by investors for its shareholder friendly dividend policies, Lancashire has been under pressure of late due to the heavy competition in its niche markets. The energy insurance sector, for example, has been described by the broker Willis as dismal with capacity chasing a smaller premium pool due to the turmoil in the oil market. A number of recent articles (such as here and here) highlight the dangers. Alex Maloney, the firm’s CEO, described the current market as “one of the most difficult trading environments during the last twenty years”. In addition, Lancashire lost its founder, Richard Brindle, in 2014 plus the CEO, the CFO and some senior underwriters of its Lloyds’ Cathedral unit in 2015.

The graph below shows the breakdown of reported historical calendar year combined ratios plus the latest accident year net loss ratio and paid ratio.

click to enlargeLancashire Ratio Breakdown 2008 to 2015

The underwriting discipline that Lancashire professes can be seen in the recent accident year loss ratios and in the 30% drop in gross written premiums (GWP), as per the graph below. The drop is more marked in net written premiums at 35% due to the increase in reinsurance spend to 25% of GWP (from approx 10% in its early years).

click to enlargeLancashire GWP Breakdown 2008 to 2015

The timely and astute increase in reinsurance protection spend can be seen in the decrease in their peak US aggregate exposures. The latest probable maximum loss (PML) estimates for their US peak exposures are approximately $200 million compared to historical levels of $300-350 million. Given the lower net premium base, the PML figures in loss ratio terms have only dropped to 40% from 50-60% historically. Lancashire summed up their reinsurance purchasing strategy as follows:

“Our outwards reinsurance programme provides a breadth and depth of cover which has helped us to strengthen our position and manage volatility. This helps us to continue to underwrite our core portfolio through the challenges posed by the cycle.”

As with AIG, the temptation for shareholders is that Lancashire will continue with their generous dividends, as the exhibit below from their Q4 2015 presentation shows.

click to enlargeLancashire Dividend History 2015

The other attraction of Lancashire is that it may become a take-over target. It currently trades at 1.4 times tangible book level which is rich compared to its US and Bermudian competitors but low compared to its peers in Lloyds’ which trade between 1.58 and 2.0 times tangible book. Lancashire itself included the exhibit below on tangible book values in its Q4 2015 presentation.

click to enlargeInsurance Tangible Book Value Multiple 2012 to 2015

It is noteworthy that there has been little activity on the insurance M&A front since the eye boggling multiples achieved by Amlin and HCC from their diversification hungry Japanese purchasers. Many in the market thought the valuations signaled the top of the M&A frenzy.

Relatively, AIG looks more attractive than Lancashire in terms of the potential for shareholder returns. However, fundamentally I cannot get away from current market conditions. Risk premia is just too low in this sector and no amount of tempting upside through dividends, buy-backs or M&A multiples can get me comfortable with the downside potential that comes with this market. As per the sentiment expressed in previous posts, I am happy with zero investment exposure to the insurance sector right now. I will watch this one play out from the sidelines.

Lessons from Lloyds

There is little doubt that the financial services industry is currently facing many challenges and undergoing a generational change. The US economist Thomas Philippon opined that the finance industry over-expansion in the US means that it’s share of GDP is about 2 percentage points higher than it needs to be although he has also estimated that the unit cost of intermediation hasn’t changed significantly in recent years, despite advances in technology and the regulatory assaults upon the industry following the financial crisis.

The insurance sector has its own share of issues. Ongoing low interest rates and inflation, broader low risk premia across the capital markets, rapid technology changes such as big data and the onset of real time underwriting are just the obvious items. The Economist had an article in March that highlighted the prospective impact of data monitoring and technology on the underwriting of motor and health risks. This is another interesting post on a number of the new peer to peer business models such as Friendsurance, Bought by Many, and Guevara who are trying to disrupt the insurance sector. There can be little doubt that the insurance industry, just like other financial sectors, will be impacted by such secular trends.

However, this post is primarily focused on the short to medium term outlook for the specialty insurance and reinsurance sector. I have been asked a few of times by readers to outline what I think the next few years may look like for this sector. My views of the current market were nicely articulated by Alex Maloney, the Group CEO of Lancashire, who commented in their recent quarterly results statement as follows:

“The year to date has seen a flurry of activity on the M&A front within the industry, much of this, in my view, is driven by the need to rationalise and refocus oversized and over stretched businesses. We also continue to see a bout of initiatives and innovations in the market, the sustainability and longer term viability of which are questionable. These are symptoms of where we are in the cycle. We have seen these types of trends before and in all likelihood, will see them again.”

Lloyds of London has had a colourful past and many of its historical issues are specific to it and reflective of its own eccentric ways. However, as a proxy for the global specialty sector, particularly over the past 20 years, it provides some interesting context on the trends we find ourselves in today. Using data from Lloyds with some added flavour from my experiences, the graphic below shows the dramatic history of the market since 1950.

click to enlargeLloyds Historical Results 1950 to 2015

The impact of Hurricane Betsy in 1965 upon Lloyds illustrated a number of the fault-lines in the structure of Lloyds with the subsequent Cromer report warning on the future danger of unequal treatment between insiders (aka working Names) and “dumb” capital providers (aka all other Names). The rapid influx of such ill informed capital in the late 1970s and the 1980s laid the seeds of the market’s near destruction largely due to the tsunami of US liability claims resulting from asbestos and pollution exposures in the 1980s. These losses were exacerbated by the way Lloyds closed underwriting years to future capital providers through vastly underpriced reinsurance to close transactions and the practice of the incestuous placement of excess of loss retrocession for catastrophe losses within the market, otherwise known as the London Market Excess of Loss (LMX) spiral. There is a clever article by Joy Schwartzman from 2008 on the similarity between the LMX spiral and the financial risk transformational illusions that featured heavily in the financial crisis. Indeed, the losses from the sloppy “occurrence” liability insurance policy wordings and the tragedy of unheeded asbestos risks continued to escalate well into the 1990s, as the exhibit below from a 2013 Towers Watson update illustrates.

click to enlargeTowers Watson Asbestos Claims US P&C Insurers

What happened in Lloyds after the market settlement with Names and the creation of the “bad bank” Equitas for the 1992 and prior losses is where the lessons of Lloyds are most applicable to the market today. The graphic below shows the geographical and business split of Lloyds over the past 20 years, showing that although the underlying risk and geographical mix has changed it remains a diversified global business.

click to enlargeLloyds of London Historical Geographical & Sector Split

Released from the burden of the past after the creation of Equitas, the market quickly went on what can only be described as an orgy of indiscipline. The pricing competition was brutal in the last half of the 1990s with terms and conditions dramatically widened. Rating indices published by the market, as below, at the time show the extent of the rate decreases although the now abandoned underwriting indices published at the same time spectacularly failed to show the impact of the loosening of T&Cs.

click to enlargeLloyds of London Rating Indices 1992 to 1999

As Lloyds moved from their historical three year accounting basis in the 2000s it’s difficult to compare historical ratios from the 1990s. Notwithstanding this, I did made an attempt to reconcile combined ratios from the 1990s in the exhibit below which clearly illustrates the impact market conditions had on underwriting results.

click to enlargeLloyds of London historical combined ratio breakdown

The Franchise Board established in 2003, under the leadership of the forthright and highly effective Rolf Tolle, was created to enforce market discipline in Lloyds after the disastrous 1990s. The combined ratios from recent years illustrate the impact it has had on results although the hard market after 9/11 provided much of the impetus. The real test of the Franchise Board will be outcome of the current soft market. The rating indices published by Amlin, as below, show where rates are currently compared to the rates in 2002 (which were pushed up to a level following 2001 to recover most of the 1990s fall-off). Rating indices published by Lancashire also confirm rate decreases of 20%+ since 2012 in lines like US property catastrophe, energy and aviation.

click to enlargeLloyds of London Rating Indices 2002 to 2015

The macro-economic environment and benign claims inflation over the past several years has clearly helped loss ratios. A breakdown of the recent reserve releases, as below, show that reinsurance and property remain important sources of releases (the reinsurance releases are also heavily dependent on property lines).

click to enlargeLloyds of London Reserve Release Breakdown 2004 to 2014

Better discipline and risk management have clearly played their part in the 10 year average ROE of 15% (covering 2005 to 2014 with the 2005 and 2011 catastrophe years included). The increasing overhead expenses are an issue for Lloyds, recently causing Ed Noonan of Validus to comment:

“We think that Lloyd’s remains an outstanding market for specialty business and their thrust towards international diversification is spot on from a strategic perspective. However, the costs associated with Lloyd’s and the excessive regulation in the UK are becoming significant issues, as is the amount of management and Board time spent on compliance well beyond what’s necessary to ensure a solvent and properly functioning market. Ultimately, this smothering regulatory blanket will drive business out of Lloyd’s and further the trend of placement in local markets.”

So what does all of this tell us about the next few years? Pricing and relaxed terms and conditions will inevitably have an impact, reserve releases will dry up particularly from reinsurance and property, investment returns may improve and claim inflation may increase but neither materially so, firms will focus on expense reduction whilst dealing with more intrusive regulation, and the recent run of low catastrophic losses will not last. ROEs of low double digits or high single digits does not, in my view, compensate for these risks. Longer term the market faces structural changes, in the interim it faces a struggle to deliver a sensible risk adjusted return.

Thoughts on ILS Pricing

Valuations in the specialty insurance and reinsurance sector have been given a bump up with all of the M&A activity and the on-going speculation about who will be next. The Artemis website reported this week that Deutsche Bank believe the market is not differentiating enough between firms and that even with a lower cost of capital some are over-valued, particularly when lower market prices and the relaxation in terms and conditions are taken into account. Although subject to hyperbole, industry veteran John Charman now running Endurance, stated in a recent interview that market conditions in reinsurance are the most “brutal” he has seen in his 44 year career.

One interesting development is the re-emergence of Richard Brindle with a new hybrid hedge fund type $2 billion firm, as per this Bloomberg article. Given the money Brindle made out of Lancashire, I am surprised that he is coming back with a business plan that looks more like a jump onto the convergence hedge fund reinsurer band wagon than anything more substantive given current market conditions. Maybe he has nothing to lose and is bored! It will be interesting to see how that one develops.

There have been noises coming out of the market that insurance linked securities (ILS) pricing has reached a floor. Given that the Florida wind exposure is ground zero for the ILS market, I had a look through some of the deals on the Artemis website, to see what pricing was like. The graph below does only have a small number of data points covering different deal structures so any conclusions have to be tempered. Nonetheless, it does suggest that rate reductions are at least slowing in 2015.

click to enlargeFlorida ILS Pricing

Any review of ILS pricing, particularly for US wind perils, should be seen in the context of a run of low storm recent activity in the US for category 3 or above. In their Q3-2014 call, Renaissance Re commented (as Eddie pointed out in the comments to this post) that the probability of a category 3 or above not making landfall in the past 9 years is statistically at a level below 1%. The graph below shows some wind and earthquake pricing by vintage (the quake deals tend to be the lower priced ones).

click to enlargeWind & Quake ILS Pricing by year

This graph does suggest that a floor has been reached but doesn’t exactly inspire any massive confidence that pricing in recent deals is any more adequate than that achieved in 2014.

From looking through the statistics on the Artemis website, I thought that a comparison to corporate bond spreads would be interesting. In general (and again generalities temper the validity of conclusions), ILS public catastrophe bonds are rated around BB so I compared the historical spreads of BB corporate against the average ILS spreads, as per the graph below.

click to enlargeILS Spreads vrs BB Corporate Spread

The graph shows that the spreads are moving in the same direction in the current environment. Of course, it’s important to remember that the price of risk is cheap across many asset classes as a direct result of the current monetary policy across the developed world of stimulating economic activity through encouraging risk taking.

Comparing spreads in themselves has its limitation as the underlying exposure in the deals is also changing. Artemis uses a metric for ILS that divides the spread by the expected loss, referred to herein as the ILS multiple. The expected loss in ILS deals is based upon the catastrophe modeller’s catalogue of hurricane and earthquake events which are closely aligned to the historical data of known events. To get a similar statistic to the ILS multiple for corporate bonds, I divided the BB spreads by the 20 year average of historical default rates from 1995 to 2014 for BB corporate risks. The historical multiples are in the graph below.

click to enlargeILS vrs BB Corporate Multiples

Accepting that any conclusions from the graph above needs to consider the assumptions made and their limitations, the trends in multiples suggests that investors risk appetite in the ILS space is now more aggressive than that in the corporate bond space. Now that’s a frightening thought.

Cheap risk premia never ends well and no fancy new hybrid business model can get around that reality.

Follow-up: Lane Financial LLC has a sector report out with some interesting statistics. One comment that catch my eye is that they estimate a well spread portfolio by a property catastrophic reinsurer who holds capital at a 1-in-100 and a 1-in-250 level would only achieve a ROE of 8% and 6.8% respectively at todays ILS prices compared to a ROE of 18% and 13.3% in 2012. They question “the sustainability of the independent catastrophe reinsurer” in this pricing environment and offer it as an explanation “why we have begun to see mergers and acquisitions, not between two pure catastrophe reinsurers but with cat writers partnering with multi-lines writers“.