Tag Archives: reserve releases

Multiple Temptation

I thought it was time for a quick catch up on all things reinsurance and specialty insurance since my last post a year ago. At that time, it looked like the underlying rating environment was gaining momentum and a hoped-for return to underwriting profitability looked on the cards. Of course, since then, the big game changer has been COVID-19.

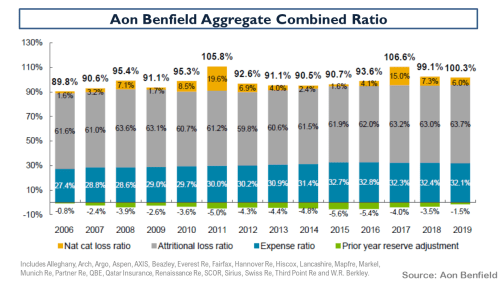
A quick catch-up on the 2019 results, as below, from the Aon Reinsurance Aggregate (ARA) results of selected firms illustrates the position as we entered this year. It is interesting to note that reserve releases have virtually dried up and the 2019 accident year excluding cats is around 96%.

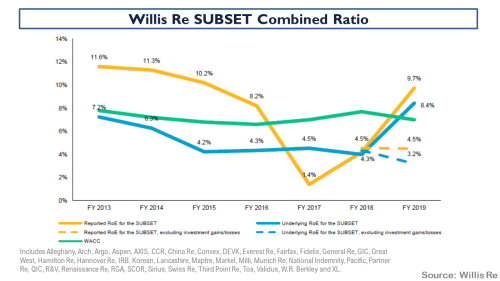
The Willis Re subset of aggregate results is broadly similar to the ARA (although it contains a few more of the lesser players and some life reinsurers and excludes firms like Beazley and Hiscox) and it shows that on an underling basis (i.e. accident year with normalised cat load), the trend is still upwards and more rate improvement is needed to improve attritional loss ratios.

The breakdown of the pre-tax results of the ARA portfolio, as below, shows that investment returns and gains saved the day in 2019.

The ROE’s of the Willis portfolio when these gains were stripped out illustrates again how underwriting performance needs to improve.

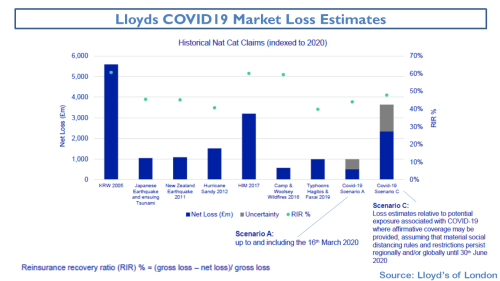
Of course, COVID-19 has impacted the sector both in terms of actual realised losses (e.g. event cancellations) and with the cloud of uncertainty over reserves for multiple exposures yet to be fully realised. There remains much uncertainty in the sector about the exact size of the potential losses with industry estimates ranging widely. Swiss Re recently put the figure at between $50-80 billion. To date, firms have established reserves of just over $20 billion. One of the key uncertainties is the potential outcome of litigation around business interruption cover. The case brought in the UK by the FCA on behalf of policyholders hopes to expedite lengthy legal cases over the main policy wordings with an outcome expected in mid-September. Lloyds industry insurance loss estimate is within the Swiss Re range and their latest June estimate is shown below against other historical events.

I think Alex Maloney of Lancashire summarised the situation well when he said that “COVID-19 is an ongoing event and a loss which will take years to mature”, adding that for “the wider industry the first-party claims picture will not be clear until 2021”. Evan Greenberg of Chubb described the pandemic as a slow rolling global catastrophe impacting virtually all countries, unlike other natural catastrophes it has no geographic or time limits and the event continues as we speak” and predicted that “together the health and consequent economic crisis will likely produce the largest loss in insurance history, particularly considering its worldwide scope and how both sides of the balance sheet are ultimately impacted”.

The immediate impact of COVID-19 has been on rates with a significant acceleration of rate hardening across most lines of business, with some specialty lines such as certain D&O covers have seen massive increases of 50%+. Many firms are reporting H1 aggregate rate increases of between 10% to 15% across their diversified portfolios. Insurance rate increases over the coming months and reinsurance rates at the January renewals, assuming no material natural cats in H2 2020, will be the key test as to whether a true hard market has arrived. Some insurers are already talking about increasing their risk retentions and their PMLs for next year in response to reinsurance rate hardening.

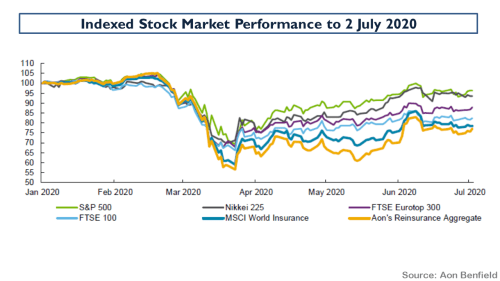
Valuations in the sector have taken a hit as the graph below from Aon on stock performance shows.

Leaving the uncertainty around COVID-19 to one side, tangible book multiples amongst several of my favourite firms since this March 2018 post, most of whom have recently raised additional capital in anticipation of a broad hard market in specialty insurance and reinsurance market, look tempting, as below.

The question is, can you leave aside the impact of COVID-19? That question is worthy of some further research, particularly on the day that Hiscox increased their COVID-19 reserves from $150 million to $230 million and indicated a range of a £10 million to £250 million hit if the UK business interruption case went against them (the top of the range estimate would reduce NTAs by 9%).

Food for thought.

Creepy Things

It has been a while since I looked at the state of the reinsurance and specialty insurance markets. Recent market commentary and insurers’ narratives at recent results have suggested market rates are finally firming up, amidst talk of reserve releases drying up and loss creep on recent events.

Just yesterday, Bronek Masojada the CEO of Hiscox commented that “the market is in a better position than it has been for some time”. The Lancashire CEO Alex Maloney said he was “encouraged by the emerging evidence that the (re)insurance market is now experiencing the long-anticipated improvements in discipline and pricing”. The Chubb CEO Evan Greenberg said that “pricing continued to tighten in the quarter while spreading to more classes and segments of business, particularly in the U.S. and London wholesale market”.

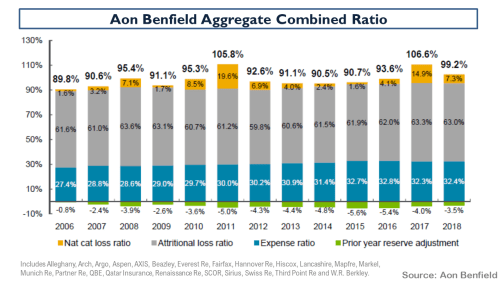
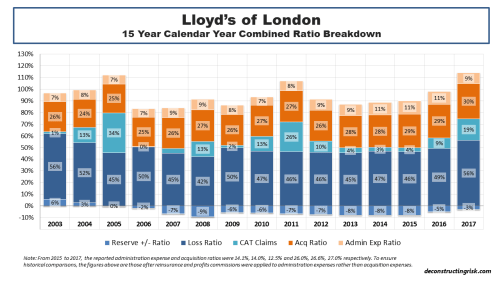
A look at the historical breakdown of combined ratios in the Aon Benfield Aggregate portfolio from April (here) and Lloyds results below illustrate the downward trend in reserve releases in the market to the end of 2018. The exhibits also indicate the expense disadvantage that Lloyds continues to operate under (and the reason behind the recently announced modernisation drive).

click to enlarge

click to enlarge

In the Willis Re mid-year report called “A Discerning Market” their CEO James Kent said “there are signs that the longstanding concern over the level of reserve redundancy in past year reserves is coming to fruition” and that in “some classes, there is a clear trend of worsening loss ratios in recent underwriting years due to a prolonged soft market and an increase in loss severity.

 In their H1 presentation, Hiscox had an exhibit that quantified some of the loss creep from recent losses, as below.

click to enlarge

The US Florida hurricane losses have been impacted by factors such as assignment of benefits (AOB) in litigated water claims and subsequently inflating repair costs. Typhoon Jebi losses have been impacted by overlapping losses and demand surge from Typhoon Trami, the Osaka earthquake and demand from Olympics construction. Arch CEO Marc Grandisson believes that the market missed the business interruption and contingent BI exposures in Jebi estimates.

The fact that catastrophic losses are unpredictable, even after the event, is no surprise to students of insurance history (this post on the history of Lloyds is a testament to unpredictability). Technology and advances in modelling techniques have unquestionably improved risk management in insurance in recent years. Notwithstanding these advances, uncertainty and the unknown should always be considered when model outputs such as probability of loss and expected loss are taken as a given in determining risk premium.

To get more insight into reserve trends, it’s worth taking a closer look at two firms that have historically shown healthy reserve releases – Partner Re and Beazley. From 2011 to 2016, Partner Re’s non-life business had an average reserve release of $675 million per year which fell to $450 million in 2017, and to $250 million in 2018. For H1 2019, that figure was $15 million of reserve strengthening. The exhibit below shows the trend with 2019 results estimated based upon being able to achieve reserve releases of $100 million for the year and assuming no major catastrophic claims in 2019. Despite the reduction in reserve releases, the firm has grown its non-life business by double digits in H1 2019 and claims it is “well-positioned to benefit from this improved margin environment”.

click to enlarge

Beazley is one of the best insurers operating from London with a long history of mixing innovation with a balanced portfolio. It has doubled its net tangible assets (NTA) per share over the past 10 years and trades today at a 2.7 multiple to NTA. Beazley is also predicting double digit growth due to an improving rating environment whilst predicting “the scale of the losses that we, in common with the broader market, have incurred over the past two years means that below average reserve releases will continue this year”.

click to enlarge

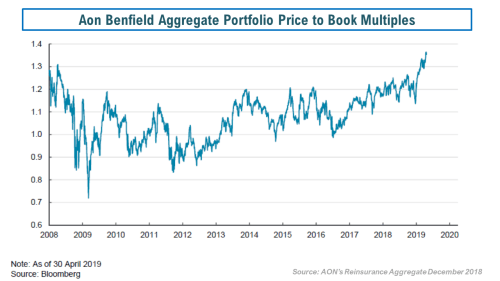
And that’s the rub. Although reserves are dwindling, rate improvements should help specialty (re)insurers to rebuild reserves and improve profitability back above its cost of capital, assuming normal catastrophe loss levels. However, market valuations, as reflected by the Aon Benfield price to book exhibit below, look like they have all that baked in already.

click to enlarge

And that’s a creepy thing.

Befuddled Lloyd’s

Lloyd’s of London always provides a fascinating insight into the London insurance market and beyond into the global specialty insurance market, as this previous post shows. It’s Chairman, Bruce Carnegie-Brown, commented in their 2017 annual report that he expects “2018 to be another challenging year for Lloyd’s and the Corporation continues to refine its strategy to address evolving market conditions”. Given the bulking up of many of its competitors through M&A, Willis recently called it a reinvigoration of the “big balance sheet” reinsurance model, Lloyd’s needs to get busy sharpening its competitive edge. In a blunter message Brown stressed that “the market’s 2017 results are proof, if any were needed, that business as usual is not sustainable”.

A looked at the past 15 years of underwriting results gives an indicator of current market trends since the underwriting quality control unit, called the Franchise Board, was introduced at the end of 2002 after the disastrous 1990’s for the 330-year-old institution.

click to enlarge

The trend of increasing non-CAT loss ratios after years of soft pricing coupled with declining prior year reserve releases is clear to see. That increases the pressure on the insurance sector to control expenses. To that end, Inga Beale, Lloyd’s CEO, is pushing modernisation via the London Market Target Operating Model programme hard, stating that electronic placement will be mandated, on a phased basis, “to speed up the adoption of the market’s modernisation programme, which will digitise processes, reduce unsustainable expense ratios, and make Lloyd’s more attractive to do business with”.

The need to reduce expenses in Lloyd’s is acute given its expense ratio is around 40% compared to around 30% for most of its competitors. Management at Lloyd’s promised to “make it cheaper and easier to write business at Lloyd’s, enabling profitable growth”. Although Lloyd’s has doubled its gross premium volumes over the past 15 years, the results over varying timeframes below, particularly the reducing underwriting margins, show the importance of stressing profitable growth and expense efficiencies for the future.

click to enlarge

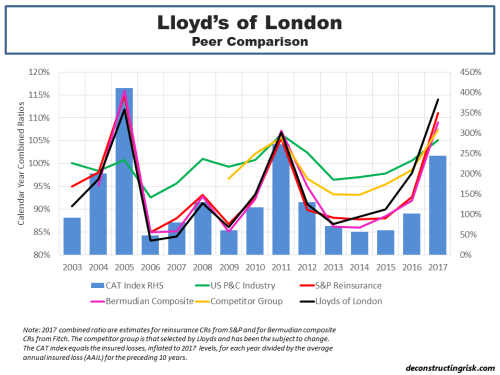
A peer comparison of Lloyd’s results over the past 15 years illustrates further the need for the market to modernise, as below. Although the 2017 combined ratio for some of the peer groupings have yet to finalised and published (I will update the graph when they do so), the comparison indicates that Lloyd’s has been doing worse than its reinsurance and Bermudian peers in recent years. It is suspicious to see, along with the big reinsurers and Bermudians, Lloyd’s included Allianz, CNA, and Zurich (and excluded Mapfe) in their competitor group from 2017. If you can’t meet your target, just change the metric behind the target!

click to enlarge

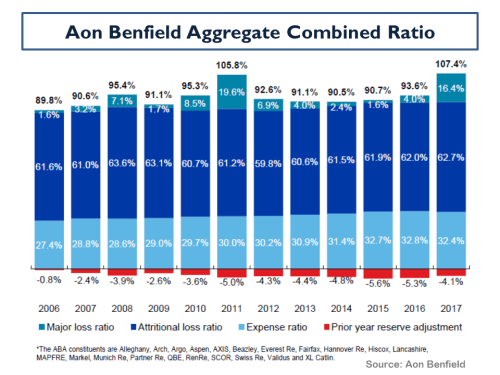
A recent report from Aon Benfield shows the breakdown of the combined ratio for their peer portfolio of specialist insurers and reinsurers from 2006 to 2017, as below.

click to enlargeAon Benfield Aggregate Combined Ratio 2006 to 2017

So, besides strong competitors, increasing loss ratios and heavy expense loads, what does Lloyd’s have to worry about? Well, in common with many, Lloyd’s must contend with structural changes across the industry as a result of, in what Willis calls in their latest report, “the oversupply of capital” from investors in insurance linked securities (ILS) with a lower cost of capital, whereby the 2017 insured losses appears to have had “no impact upon appetite”, according to Willis.

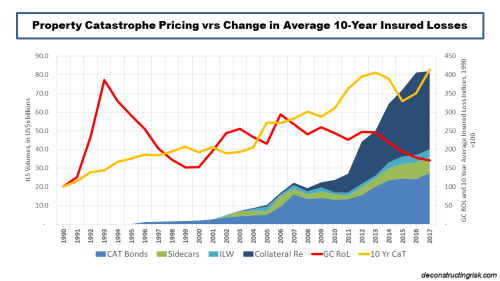
I have posted many times, most recently here, on the impact ILS has had on property catastrophe pricing. The graph of the average multiple of coupon to expected loss on deals monitored by sector expert Artemis again illustrates the pricing trend. I have come up with another angle to tell the story, as per the graph below. I compared the Guy Carpenter rate on line (ROL) index for each year against an index of the annual change in the rolling 10-year average global catastrophe insured loss (which now stands at $66 billion for 2008-2017). Although it is somewhat unfair to compare a relative measure (the GC ROL index) against an absolute measure (change in average insured loss), it makes a point about the downward trend in property catastrophe reinsurance pricing in recent years, particularly when compared to the trend in catastrophic losses. To add potentially to the unfairness, I also included the rising volumes in the ILS sector, in an unsubtle finger point.

click to enlarge

Hilary Weaver, Lloyd’s CRO, recognises the danger and recently commented that “the new UK ILS regulation will, if anything, increase the already abundant supply of insurance capital” and “this is likely to mean that prices remain low for many risks, so we need to remain vigilant to ensure that the prices charged for them are proportionate to the risk”.

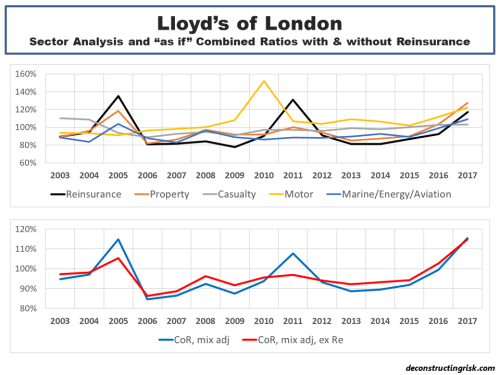
The impact extends beyond soft pricing and could impact Lloyd’s risk profile. The loss of high margin (albeit not as high as it once was) and low frequency/high severity business means that Lloyd’s will have to fish in an already crowded pond for less profitable and less volatile business. The combined ratios of Lloyd’s main business lines are shown below illustrating that all, except casualty, have had a rough 2017 amid competitive pressures and large losses.

As reinsurance business is commoditised further by ILS, in a prelude to an increase in machine/algorithm underwriting, Lloyd’s business will become less volatile and as a result less profitable. To illustrate, the lower graph below shows Lloyd’s historical weighted average combined ratio, using the 2017 business mix, versus the weighted average combined ratio excluding the reinsurance line. For 2003 to 2017, the result would be an increase in average combined ratio, from 95.8% to 96.5%, and a reduction in volatility, the standard deviation from 9.7% to 7%.

click to enlarge

To write off Lloyd’s however would be a big mistake. In my view, there remains an important role for a specialist marketplace for heterogeneous risks, where diverse underwriting expertise cannot be easily replicated by machines. Lloyd’s has shown its ability in the past to evolve and adapt, unfortunately however usually when it doesn’t have any choice. Hopefully, this legendary 330-year-old institution will get ahead of the game and dictate its own future. It will be interesting to watch.


Epilogue – Although this analogy has limitations, it occurs to me that the insurance sector is at a stage of evolution that the betting sector was at about a decade ago (my latest post on the sector is here). Traditional insurers, with over-sized expenses, operate like old traditional betting shops with paper slips and manual operations. The onset of online betting fundamentally changed the way business is transacted and, as a result, the structure of the industry. The upcoming digitalisation of the traditional insurance business will radically change the cost structure of the industry. Lloyd’s should look to the example of Betfair (see an old post on Betfair for more) as a means of digitalising the market platform and radically reducing costs.

Follow-on 28th April – Many thanks to Adam at InsuranceLinked for re-posting this post. A big welcome to new readers, I hope you will stick around and check out some other posts from this blog. I just came across this report from Oliver Wyam on the underwriter of the future that’s worth a read. They state that the “commercial and wholesale insurance marketplaces are undergoing radical change” and they “expect that today’s low-price environment will continue for the foreseeable future, continuing to put major pressure on cost“.

CAT Calls

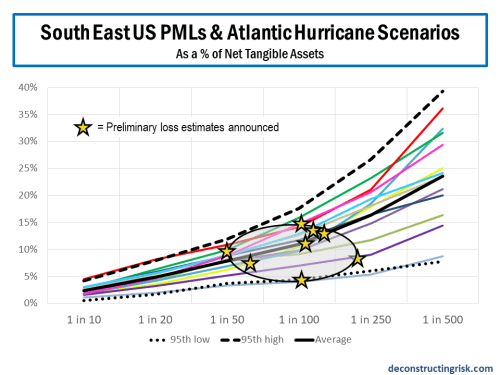
Following on from a recent post on windstorms in the US, I have taken several loss preliminary estimates recently published by firms (and these are very early estimates and therefore subject to change) and overlaid them against the South-East US probable maximum loss (PML) curves and Atlantic hurricane scenarios previously presented, as below. The range of insured losses for Harvey, Irma and Maria (now referred to as HIM) are from $70 billion to $115 billion, averaging around $90 billion.

click to enlarge

The loss estimates by firm depend heavily upon the risk profile of each. As a generalisation, it could be said that the aggregate US wind losses are averaging around the 1 in 100 loss level.

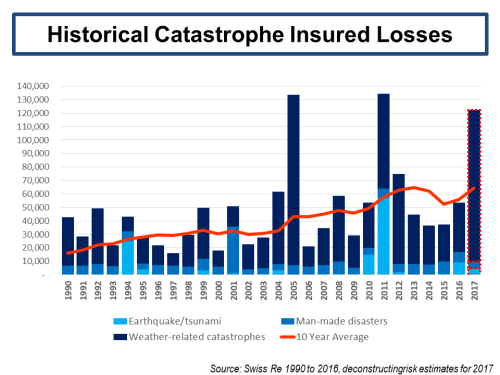
Given there was over $20 billion of insured losses from H1 and factoring in developing losses such as the Mexico earthquake, the California wildfires and the current windstorm Ophelia hitting Ireland, annual insured losses for 2017 could easily reach $120 billion. The graph below shows the 2016 estimates from Swiss Re and my $120 billion 2017 guesstimate (it goes without saying that much could still happen for the remainder of the year).

click to enlarge

At a $120 billion level of insured loss for 2017, the 10 year average increase from around $55 billion to $65 billion. In a post in early 2016, I estimated that catastrophe pricing was about 25% too low based upon annual average losses of $40 billion per year. We will see whether the 2017 losses are enough to deplete the overcapitalisation in the market and return pricing towards their technical rate. I wouldn’t hold my breath on that as although there may be material aggregate losses in the private collateralised market and other pockets of the retrocession market, the appetite of yield seeking investors will likely remain unabated in the current interest rate environment.

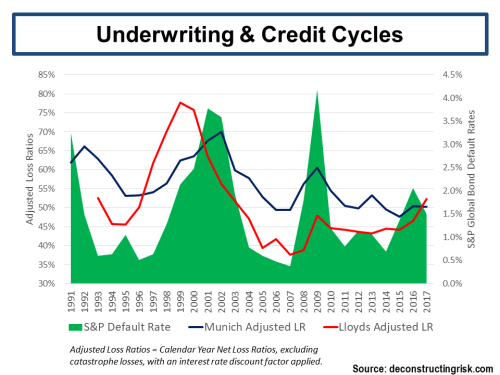
Although the comparison between calendar year ratios and credit defaults is fraught with credibility issues (developed accident year ratios to developed default rates are arguably more comparable), I updated my previous underwriting cycle analysis (here in 2014 and here in 2013). Taking the calendar year net loss ratios of Munich Re and Lloyds of London excluding catastrophe and large losses (H1 results for 2017), I then applied a crude discount measure using historical risk-free rates plus 100 basis points to reflect the time value of money, and called the resulting metric the adjusted loss ratio (adjusted LR). I compared these adjusted LRs for Munich and Lloyds to S&P global bond credit default rates (by year of origin), as per the graph below.

click to enlarge

This shows that the years of relatively benign attritional claims together with the compounding impact of soft pricing over the past years may finally be coming to an end. Time will tell. All in all, it makes for a very interesting period for the market over the next 6 to 12 months.

In the interim, let’s hope for minimal human damage from the current California wildfires and windstorm Ophelia.

The Big Wind

With four US hurricanes and one earthquake in current times, mother nature is reminding us homo-sapiens of her power and her unpredictability. As the massive Hurricane Irma is about to hit Florida, we all hope that the loss of life and damage to people’s lives will be minimal and that the coming days will prove humane. Forgive me if it comes across as insensitive to be posting now on the likely impact of such events on the insurance industry.

For the insurance sector, these events, and particularly Hurricane Irma which is now forecast to move up the west coast of Florida at strength (rather the more destruction path of up the middle of Florida given the maximum forces at the top right-hand side of a hurricane like this one), may be a test on the predictive powers of its models which are so critical to pricing, particularly in the insurance linked securities (ILS) market.

Many commentators, including me (here, here and here are recent examples), have expressed worries in recent years about current market conditions in the specialty insurance, reinsurance and ILS sectors. On Wednesday, Willis Re reported that they estimate their subset of firms analysed are only earning a 3.7% ROE if losses are normalised and reserve releases dried up. David Rule of the Prudential Regulatory Authority in the UK recently stated that London market insurers “appear to be incorporating a more benign view of future losses into their technical pricing”, terms and conditions continued to loosen, reliance on untested new coverages such as cyber insurance is increasing and that insurers “may be too sanguine about catastrophe risks, such as significant weather events”.

With the reinsurance and specialty insurance sectors struggling to meet their cost of capital and pricing terms and conditions being so weak for so long (see this post on the impact of soft pricing on risk profiles), if Hurricane Irma impacts Florida as predicted (i.e. on Saturday) it has the potential to be a capital event for the catastrophe insurance sector rather than just an earnings event. On Friday, Lex in the FT reported that the South-East US makes up 60% of the exposures of the catastrophe insurance market.

The models utilised in the sector are more variable in their output as events get bigger in their impact (e.g. the higher the return period). A 2013 post on the variation in loss estimates from a selected portfolio of standard insurance coverage by the Florida Commission on Hurricane Loss Projection Methodology (FCHLPM) illustrates the point and one of the graphs from that post is reproduced below.

click to enlarge

Based upon the most recent South-East US probable maximum losses (PML) and Atlantic hurricane scenarios from a group of 12 specialty insurers and reinsurers I selected, the graph below shows the net losses by return periods as a percentage of each firm’s net tangible assets. This graph does not consider the impact of hybrid or subordinate debt that may absorb losses before the firm’s capital. I have extrapolated many of these curves based upon industry data on US South-East exceedance curves and judgement on firm’s exposures (and for that reason I anonymised the firms).

click to enlarge

The results of my analysis confirm that specialty insurers and reinsurers, in aggregate, have reduced their South-East US exposures in recent years when I compare average figures to S&P 2014 data (by about 15% for the 1 in 100 return period). Expressed as a net loss ratio, the average for a 1 in 100  and a 1 in 250 return period respectively is 15% and 22%. These figures do look low for events with characteristics of these return periods (the average net loss ratio of the 12 firms from catastrophic events in 2005 and 2011 was 22% and 25% respectively) so it will be fascinating to see what the actual figures are, depending upon how Hurricane Irma pans out. Many firms are utilising their experience and risk management prowess to transfer risks through collaterised reinsurance and retrocession (i.e. reinsurance of reinsurers) to naïve capital market ILS investors.

If the models are correct and maximum losses are around the 1 in 100 return period estimates for Hurricane Irma, well capitalized and managed catastrophe exposed insurers should trade through recent and current events. We will see if the models pass this test. For example, demand surge (whereby labour and building costs increase following a catastrophic event due to overwhelming demand and fixed supply) is a common feature of widespread windstorm damage and is a feature in models (it is one of those inputs that underwriters can play with in soft markets!). Well here’s a thought – could Trump’s immigration policy be a factor in the level of demand surge in Florida and Texas?

The ILS sector is another matter however in my view due to the rapid growth of the private and unregulated collateralised reinsurance and retrocession markets to satisfy the demand for product supply from ILS funds and yield seeking investors. The prevalence of aggregate covers and increased expected loss attachments in the private ILS market resembles features of previous soft and overheated retrocession markets (generally before a crash) in bygone years. I have expressed my concerns on this market many times (more recently here). Hurricane Irma has the potential to really test underwriting standards across the ILS sector. The graph below from Lane Financial LLC on the historical pricing of US military insurer USAA’s senior catastrophe bonds again illustrates how the market has taken on more risk for less risk adjusted premium (exposures include retired military personnel living in Florida).

click to enlarge

The events in the coming days may tell us, to paraphrase Mr Buffet, who has been swimming naked or as Lex put it on Friday, “this weekend may be a moment when the search for uncorrelated returns bumps hard into acts of God”.

Hopefully, all parts of the catastrophe insurance sector will prove their worth by speedily indemnifying peoples’ material losses (nothing can indemnify the loss of life). After all, that’s its function and economic utility to society. Longer term, recent events may also lead to more debate and real action been taken to ensure that the insurance sector, in all its guises, can have an increased economic function and relevance in an increasingly uncertain world, in insuring perils such as floods for example (and avoiding the ridiculous political interference in risk transfer markets that has made the financial impact of flooding from Hurricane Harvey in Texas so severe).

Notwithstanding the insurance sector, our thoughts must be with the people who will suffer from nature’s recent wrath and our prayers are with all of those negatively affected now and in the future.