Tag Archives: ILS market

CAT Calls

Following on from a recent post on windstorms in the US, I have taken several loss preliminary estimates recently published by firms (and these are very early estimates and therefore subject to change) and overlaid them against the South-East US probable maximum loss (PML) curves and Atlantic hurricane scenarios previously presented, as below. The range of insured losses for Harvey, Irma and Maria (now referred to as HIM) are from $70 billion to $115 billion, averaging around $90 billion.

click to enlarge

The loss estimates by firm depend heavily upon the risk profile of each. As a generalisation, it could be said that the aggregate US wind losses are averaging around the 1 in 100 loss level.

Given there was over $20 billion of insured losses from H1 and factoring in developing losses such as the Mexico earthquake, the California wildfires and the current windstorm Ophelia hitting Ireland, annual insured losses for 2017 could easily reach $120 billion. The graph below shows the 2016 estimates from Swiss Re and my $120 billion 2017 guesstimate (it goes without saying that much could still happen for the remainder of the year).

click to enlarge

At a $120 billion level of insured loss for 2017, the 10 year average increase from around $55 billion to $65 billion. In a post in early 2016, I estimated that catastrophe pricing was about 25% too low based upon annual average losses of $40 billion per year. We will see whether the 2017 losses are enough to deplete the overcapitalisation in the market and return pricing towards their technical rate. I wouldn’t hold my breath on that as although there may be material aggregate losses in the private collateralised market and other pockets of the retrocession market, the appetite of yield seeking investors will likely remain unabated in the current interest rate environment.

Although the comparison between calendar year ratios and credit defaults is fraught with credibility issues (developed accident year ratios to developed default rates are arguably more comparable), I updated my previous underwriting cycle analysis (here in 2014 and here in 2013). Taking the calendar year net loss ratios of Munich Re and Lloyds of London excluding catastrophe and large losses (H1 results for 2017), I then applied a crude discount measure using historical risk-free rates plus 100 basis points to reflect the time value of money, and called the resulting metric the adjusted loss ratio (adjusted LR). I compared these adjusted LRs for Munich and Lloyds to S&P global bond credit default rates (by year of origin), as per the graph below.

click to enlarge

This shows that the years of relatively benign attritional claims together with the compounding impact of soft pricing over the past years may finally be coming to an end. Time will tell. All in all, it makes for a very interesting period for the market over the next 6 to 12 months.

In the interim, let’s hope for minimal human damage from the current California wildfires and windstorm Ophelia.

The Big Wind

With four US hurricanes and one earthquake in current times, mother nature is reminding us homo-sapiens of her power and her unpredictability. As the massive Hurricane Irma is about to hit Florida, we all hope that the loss of life and damage to people’s lives will be minimal and that the coming days will prove humane. Forgive me if it comes across as insensitive to be posting now on the likely impact of such events on the insurance industry.

For the insurance sector, these events, and particularly Hurricane Irma which is now forecast to move up the west coast of Florida at strength (rather the more destruction path of up the middle of Florida given the maximum forces at the top right-hand side of a hurricane like this one), may be a test on the predictive powers of its models which are so critical to pricing, particularly in the insurance linked securities (ILS) market.

Many commentators, including me (here, here and here are recent examples), have expressed worries in recent years about current market conditions in the specialty insurance, reinsurance and ILS sectors. On Wednesday, Willis Re reported that they estimate their subset of firms analysed are only earning a 3.7% ROE if losses are normalised and reserve releases dried up. David Rule of the Prudential Regulatory Authority in the UK recently stated that London market insurers “appear to be incorporating a more benign view of future losses into their technical pricing”, terms and conditions continued to loosen, reliance on untested new coverages such as cyber insurance is increasing and that insurers “may be too sanguine about catastrophe risks, such as significant weather events”.

With the reinsurance and specialty insurance sectors struggling to meet their cost of capital and pricing terms and conditions being so weak for so long (see this post on the impact of soft pricing on risk profiles), if Hurricane Irma impacts Florida as predicted (i.e. on Saturday) it has the potential to be a capital event for the catastrophe insurance sector rather than just an earnings event. On Friday, Lex in the FT reported that the South-East US makes up 60% of the exposures of the catastrophe insurance market.

The models utilised in the sector are more variable in their output as events get bigger in their impact (e.g. the higher the return period). A 2013 post on the variation in loss estimates from a selected portfolio of standard insurance coverage by the Florida Commission on Hurricane Loss Projection Methodology (FCHLPM) illustrates the point and one of the graphs from that post is reproduced below.

click to enlarge

Based upon the most recent South-East US probable maximum losses (PML) and Atlantic hurricane scenarios from a group of 12 specialty insurers and reinsurers I selected, the graph below shows the net losses by return periods as a percentage of each firm’s net tangible assets. This graph does not consider the impact of hybrid or subordinate debt that may absorb losses before the firm’s capital. I have extrapolated many of these curves based upon industry data on US South-East exceedance curves and judgement on firm’s exposures (and for that reason I anonymised the firms).

click to enlarge

The results of my analysis confirm that specialty insurers and reinsurers, in aggregate, have reduced their South-East US exposures in recent years when I compare average figures to S&P 2014 data (by about 15% for the 1 in 100 return period). Expressed as a net loss ratio, the average for a 1 in 100  and a 1 in 250 return period respectively is 15% and 22%. These figures do look low for events with characteristics of these return periods (the average net loss ratio of the 12 firms from catastrophic events in 2005 and 2011 was 22% and 25% respectively) so it will be fascinating to see what the actual figures are, depending upon how Hurricane Irma pans out. Many firms are utilising their experience and risk management prowess to transfer risks through collaterised reinsurance and retrocession (i.e. reinsurance of reinsurers) to naïve capital market ILS investors.

If the models are correct and maximum losses are around the 1 in 100 return period estimates for Hurricane Irma, well capitalized and managed catastrophe exposed insurers should trade through recent and current events. We will see if the models pass this test. For example, demand surge (whereby labour and building costs increase following a catastrophic event due to overwhelming demand and fixed supply) is a common feature of widespread windstorm damage and is a feature in models (it is one of those inputs that underwriters can play with in soft markets!). Well here’s a thought – could Trump’s immigration policy be a factor in the level of demand surge in Florida and Texas?

The ILS sector is another matter however in my view due to the rapid growth of the private and unregulated collateralised reinsurance and retrocession markets to satisfy the demand for product supply from ILS funds and yield seeking investors. The prevalence of aggregate covers and increased expected loss attachments in the private ILS market resembles features of previous soft and overheated retrocession markets (generally before a crash) in bygone years. I have expressed my concerns on this market many times (more recently here). Hurricane Irma has the potential to really test underwriting standards across the ILS sector. The graph below from Lane Financial LLC on the historical pricing of US military insurer USAA’s senior catastrophe bonds again illustrates how the market has taken on more risk for less risk adjusted premium (exposures include retired military personnel living in Florida).

click to enlarge

The events in the coming days may tell us, to paraphrase Mr Buffet, who has been swimming naked or as Lex put it on Friday, “this weekend may be a moment when the search for uncorrelated returns bumps hard into acts of God”.

Hopefully, all parts of the catastrophe insurance sector will prove their worth by speedily indemnifying peoples’ material losses (nothing can indemnify the loss of life). After all, that’s its function and economic utility to society. Longer term, recent events may also lead to more debate and real action been taken to ensure that the insurance sector, in all its guises, can have an increased economic function and relevance in an increasingly uncertain world, in insuring perils such as floods for example (and avoiding the ridiculous political interference in risk transfer markets that has made the financial impact of flooding from Hurricane Harvey in Texas so severe).

Notwithstanding the insurance sector, our thoughts must be with the people who will suffer from nature’s recent wrath and our prayers are with all of those negatively affected now and in the future.

Pimping the Peers (Part 2)

In the last post on this topic, I highlighted how new technologies, broadly under the fintech tag, had the potential to disrupt the banking sector, primarily by means of automating processes rather than any major reinventing of business models (although I did end that post with a bit of a rant about innovation and human behaviour). Blockchain is the hot topic that seems to be cropping up everywhere (I’ll leave that for another time). This post is about insurance and new technology, or in the jargon, insurtech.

The traditional business model in the insurance industry is not reacting well to a world of low or negative interest rates. For the life insurance sector, the duration mismatch between their liabilities and their assets is having a perverse impact as interest rates have fallen. Savings returns for aging populations have been sacrificed in Central Bank’s attempt to stimulate economic growth.

In addition, the traditional distribution channel for selling life insurer’s products, and the old adage is that these products are sold rather than bought, has relied too heavily on aging tied agents whose focus is on the wealthy client that can generate more fees than the middle class. The industry is generally at a loss on how to sell products in a low interest world to the mass market and to the new tech savvy generation. As a result, the industry and others are throwing money at a rash of new start-ups in insurance, as the exhibit on some of the current hyped firms focusing on life insurance below illustrates.

click to enlargelife-insurance-big-data

As the exhibit illustrates, the focus of these new start-ups is weighted towards technologies around product development, distribution, and underwriting. Some will likely succeed in trying to differentiate further the existing clientele of life insurers (e.g. real time health data). Many will be gobbled up or disappear. Differing attitudes between those aged under 34 and the older generation towards online distribution channels can be clearly seen in the survey results in the exhibit below.

click to enlargeattitudes-to-life-insurance-distribution-channels

With longevity and low interest rates the dominant challenges for life insurers today, automation of processes will assist in cutting expenses in the provision of products (mainly to the existing customer base) but will not likely meaningfully address the twin elephants in the room.  Citigroup reckons that in 20 of the largest OECD countries the unfunded government liability for pensions is around $78 trillion which compares to approximately $50 trillion in GDP for all OECD countries in 2015. I look forward to conversing with a robo-advisor in the near future on what products it recommends for that problem!

Insurance itself is hundreds of years old and although the wonderfully namely bottomry (the earliest form of marine hull insurance) or ancient burial societies are early examples, non-life insurance really took off with mass markets after the great fire of London in 1666.

The most hyped example of insurtech in the non-life sector is the impact of technologies on the motor business like drive-less cars and car telematics. This paper from Swiss Re shows that the impact over the next 20 years of such advances on motor premia could be dramatic.

Much of the focus from insurtech innovation is on reducing expenses, an item that the industry is not light on. The graph below shows examples of the level of acquisition and overhead expenses in the non-life sector across different jurisdictions.

click to enlargenonlife-expense-ratios

A recent report from Aon Benfield went further and looked at expenses across the value chain in the US P&C insurance sector, as below. Aon Benfield estimated overall expenses make up approximately half of gross risk premium, much of which represents juicy disruption targets for new technology in the insurtech world.

click to enlargeexpenses-across-the-value-chain

Insurance itself is based upon the law of large numbers and serves a socially useful function in reducing economic volatility by transferring risks from businesses and consumers. In 1906, Alfred Manes defined insurance as “an economic institution resting on the principle of mutuality, established for the purpose of supplying a fund, the need for which arises from a chance occurrence whose probability can be estimated”.

One of the issues identified with the current non-life insurance sector is the so-called protection gap. This is in effect where insurers’ risk management practises have got incredibly adapt at identifying and excluding those risks most likely to result in a claim. Although good for profits, it does bring the social usefulness of the transference of only the pristine risks into question (for everybody else). The graph below from Swiss Re illustrates the point by showing economic and insured losses from natural catastrophe events as a % of GDP.

click to enlargeinsurance-protection-gap-uninsured-vrs-insured-losses

It’s in the context of low investment returns and competitive underwriting markets (in themselves being driven by low risk premia across asset classes) that a new technology driven approach to the mutual insurance model is being used to attack expense and protection gap issues.

Mutuals represent the original business model for many insurers (back to burial schemes and the great fire of 1666) and still represent approximately a third of the sector in the US and Europe today. Peer to peer insurers are what some are calling the new technology driven mutuals. In fact, most of the successful P2P models to date, firms like Guevara, Friendsurance, and Inspeer are really intermediaries who pool consumers together for group discounts or self-financing of high deductibles.

Lemonade, which launched in New York this week, is a peer to peer platform which issues its own insurance policies and seeks to address the protection gap issue by offering broader coverage. The firm has been heavily reinsured by some big names in insurance like Berkshire Hathaway and Lloyd’s. It offers a fee based model, whereby the policyholders pay claims through mutualisation (assumingly by pools determined by pre-defined criteria). Daniel Schreiber, CEO and co-founder of Lemonade says that the firm will be ”the only insurer that doesn’t make money by denying claims”. Dan Ariely, a big deal in the world of Behavioral Economics, has been named as Chief Behavioral Officer, presumably in an effort to assist in constructing pools of well behaved policyholders.

The graphic below tries to illustrate how the business model is evolving (or should that be repeating?). Technology offers policyholders the opportunity to join with others to pool risk, hitherto a process that was confined to associations amongst professional groups or groups bound by location. Whether technology offers the same opportunity to underwrite risks profitably (or at least not at a loss) but with a larger reach remains to be seen.

click to enlargeinsurance-business-models

It does occur to me that it may be successful in addressing areas of dislocation in the industry, such as shortfalls in coverage for flood insurance, where a common risk and mitigant can be identified and addressed in the terms of the respective pool taking the risks on.

For specialty re/insurers, we have already seen a bifurcation between the capital providers/risk takers and the risk portfolio managers in the ILS arena. Newer technology driven mutual based insurers also offer the industry a separation of the management of risk pools and the risk capital provided to underwrite them. I wish them well in their attempts at updating this most ancient of businesses and I repeat what I said in part 1 of this post – don’t let the sweet scent of shiny new technology distract you from the smell of the risk…..

Historical ROEs in reinsurance & specialty insurance

I was talking to an analyst last week about the returns on equity in the traditional reinsurer/specialty insurer market versus that in the ILS market. I have posted recently on the mid single digit returns currently on offer from (unlevered) ILS funds and also on the ROEs in the “traditional” market.

We couldn’t agree on what the historical ROE from the traditional market going back 20 years was so I decided to have a look at some figures. The graph below represents a simple average of a sample of firms going back to 1995. I selected a simple average rather than a weighted average as it should be a good representation of the varying business models and used operating ROEs where possible to reflect underwriting results. The number of firms in the 1990s in the sample is relatively small compared to the 2000s as many of the current firms were not around in their current form in the 1990s.

click to enlargeHistorical Reinsurer Specialty Insurer ROEs 1995 to 2013

The interesting outcome is that since 1995 the average (of the average annual operating) ROE is 10% with the 10 year average increasing from around 8%-9% to 11%-12% more recently. The volatility is obviously a function of the underlying risk (the standard deviation is 6%) although it is interesting that the recent high losses of 2005 and 2011 were not enough to push the average ROEs into negative territory. That illustrates the importance of differing business models in the sector.

Given the depressed level of risk premia across financial markets, it’s understandable that the capital markets have been attracted by a sector with an average ROE of 10%. Of course, the influx of new capital is making the average ever more unattainable. KBW are the latest market commentator who has called the relaxation of terms and conditions in reinsurance as a result of the softening market as “dangerous”. As the old underwriting adage goes – “don’t let the smell of the premium distract you from the stink of the risk”.

A look over some bookmakers’ books

I have been doing some digging into the dynamics of betting exchanges, the largest and best known of which is BetFair. The betting and gaming sector itself has been the subject of a mountain of academic research, there is even a journal dedicated to it! Quants have moved in and are actively pitting their algorithms against human gambling behaviour on the exchanges. A recent intriguing Bloomberg article on tennis betting illustrates some strategies now common in the marketplace.

Technology has driven disruptive disintermediation across many sectors such as the travel & airline industry and more recently across the retail sector. There was a fascinating documentary on the BBC by Robert Preston late last year on the UK retail sector which concluded that the future for many clothing retail outlets would be to act like galleries for consumers to peruse items with the ultimate purchase decision being made online.

The betting and gaming sector is one undergoing structural changes due to the massive increase in online activity. Additional competitive threats from disintermediated business models such as betting exchange pose interesting questions for the sector. Such structural market changes may be useful in understanding the impact of new business models in other sectors such as financial services –  peer to peer (P2P) lending in banking or the ILS market in insurance come to mind. On the growing P2P lending sector, there was an article on the front page of Friday’s FT on how a UK developer sourced £4 million of debt through online P2P platform Lendinvest which may prove to be defining moment of change. On the impact of the ILS market, there was another interesting FT article that contended that the ILS market is resulting in structural changes in a market with “a lot of excessive overhead, ie highly paid staff, that can be eliminated”.

Before looking deeper into structural changes in the betting and gaming sector, I needed to understand the “traditional” betting market better. Besides the odd poker tournament (with real people), I am not a gambler and therefore not a user of the services provided by betting firms. I know enough that the odds are obviously in the bookies favour but I know very little about the economics of the betting industry. As such, this post details my research on the UK betting industry. A follow on post will go into the broader picture and some (likely rambling) thoughts on the impact of structural changes from betting exchanges like Betfair.

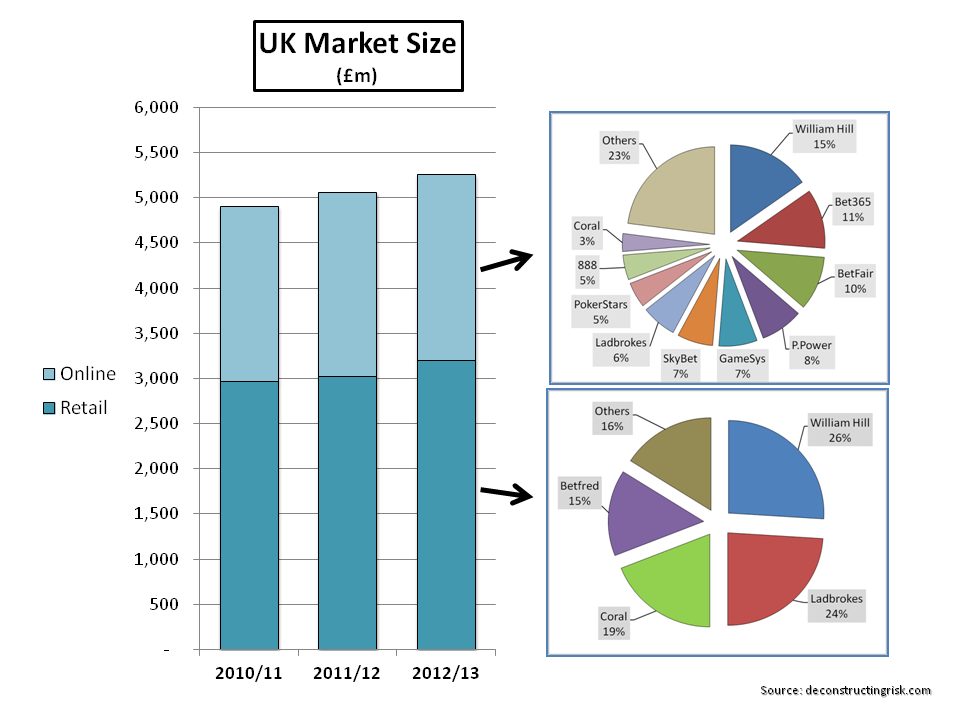
So, I concentrated on the UK market where data is freely available. The graphic below outlines the size of the UK betting and gaming market with the main providers. The market is split by revenue approx 60% retail and 40% online. The retail market is split approx 50:50 between over the counter betting at shops and gaming on machines (aka fixed odds betting terminals or FOBTs). On the online side, sports betting (commonly referred to as the Sportsbook) is approx 40% with gaming making up the remainder, led by casino (approx 30%), poker and bingo (approx 15% each).

click to enlargeUK Gambling Market Size

The main players on the retail side stress the advantages of their multi-access models and, to counter the impression that retail betting shops attach the older demographic, cite statistics that show even younger customers often use retail outlets (more and more in combination with online and mobile).

The gaming machine/FOBT sector has come under renewed focus recently. Derek Webb, a successful gambler, is one of the principles behind the Campaign for Fairer Gambling and has described the machines as “crack cocaine”. Campaigners point to the rapid rise in revenue from FOBT, which were only widely introduced in the early 2000s, the addictive nature of the machines and that users are high frequency gamblers with a concentration amongst younger men with low incomes. Bookies point to the high payouts (the margin taken by the bookmaker is generally about 3% to 4% of the amount staked whereby such margin is referred to as the gross win) and the importance of machines supporting the retail shop model (I estimate that FOBT can contribute 70% to 80% of retail operating profits). Political pressure is mounting to restrict the amount that can be bet on the machines and JP Morgan recently cut its rating on Ladbrokes and William Hill saying that the likely change “could make the bottom 20pc of Ladbrokes and William Hill shops loss-making, with a further 20pc only marginally profitable, and require significant restructuring to close shops in order to cut costs.

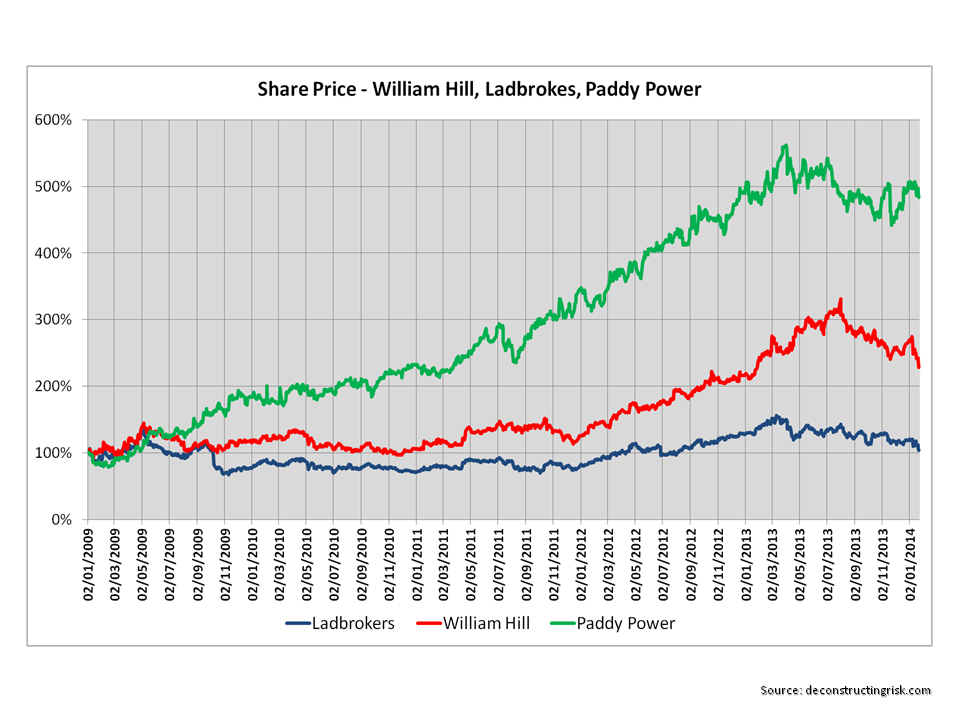
I selected Ladbrokes, William Hill and Paddy Power as firms to do some deeper analysis. William Hill and Ladbrokes are long established firms, particularly in the retail sector. William Hill is also the market leader in the online sector with a particular strength in online casino gaming. Paddy Power is the new kid on the block growing aggressively in online, particularly over the past 5 years, from its Irish base into the fourth largest in the online sector. Size wise, William Hill and Ladbrokes had revenue of £1.3 billion and £1 billion in 2012 respectively while Paddy Power had 2012 revenue of €650 million (approx £570 million). It would have been interesting to have a deeper look at the online only Bet365, which was founded in 2000 by Denise Coates and is now the number 2 in the UK online market with over £200 million in revenue, but unfortunately Bet365 is private. The graph below shows the share price moves of the selected firms since 2009.

click to enlargeShare Price William Hill Ladbrokes Paddy Power

The graph below shows the profit before tax margins of the firms since 2003. As can be seen, profit margins have been under pressure, particularly for Ladbrokes in recent years.

click to enlargePBT % William Hill Ladbrokes Paddy Power

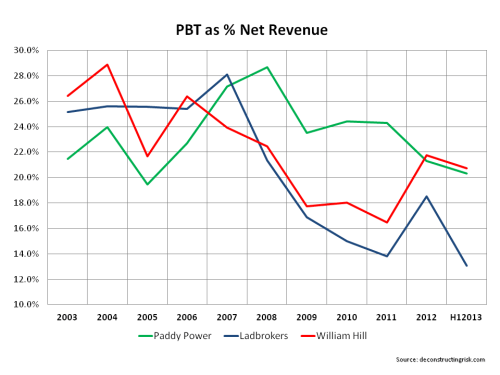
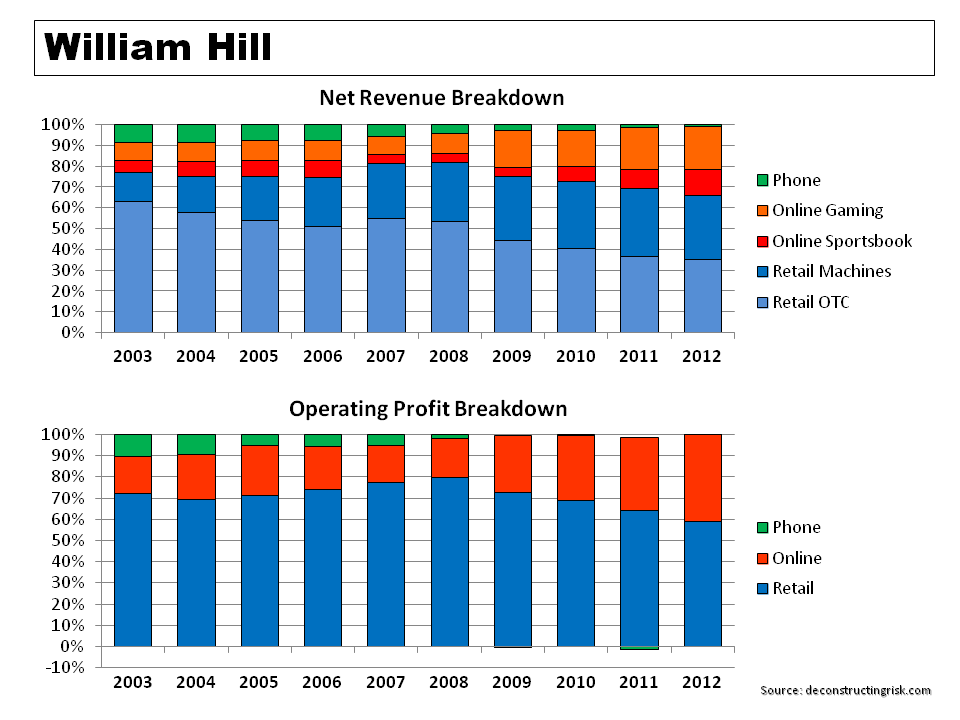
Revenue and operating profit breakdown for William Hill is below.

click to enlargeWilliam Hill Revenue & Operating Profit Breakdown

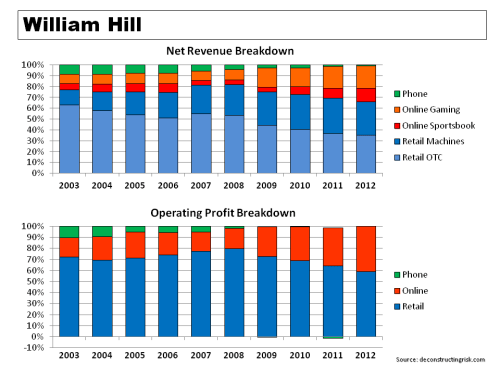
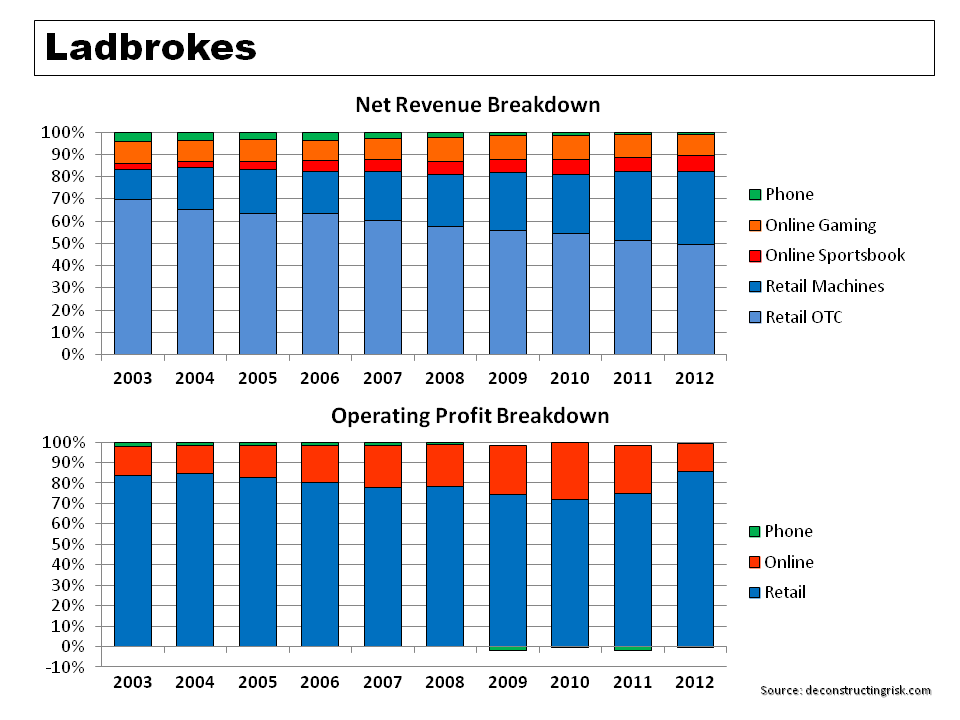
Revenue and operating profit breakdown for Ladbrokes is below.

click to enlargeLadbrokes Revenue & Operating Profit Breakdown

Revenue and operating profit breakdown for Paddy Power is below.

click to enlargePaddy Power Revenue & Operating Profit Breakdown

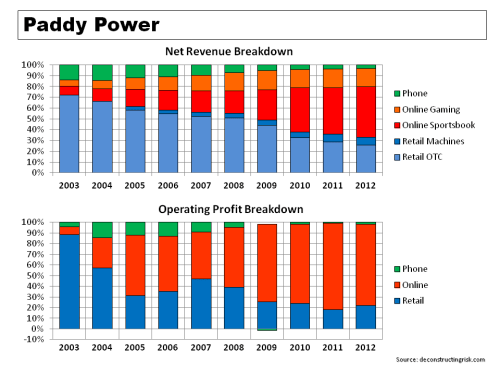
As mentioned above, the percentage that a bookmaker takes as a margin in each business is called the gross win (another commonly used term is the overround which refers to the excess above the sum of the odds). Net revenues are gross wins less VAT and fair-value adjustments for free bets, promotions and bonuses. Care needs to be taken when comparing gross win percentages (i.e. gross win divided by amounts staked) across firms as the make-up of the underlying books is important (gross wins varies by sport type such as football, horses, tennis, etc and by geography). Also items such as betting levies and charges vary and some are not deducted in the gross win to net revenue calculations but rather in operating expenses. Items such as the new UK point of consumption (POC) tax that is due to be introduced later this year also need to be understood in their potential accounting treatment. The graph below compares the reported gross win percentages amongst the firms in the retail over the counter (OTC) business and in the online Sportsbook businesses for the firms.

click to enlargeGross Win Percentage

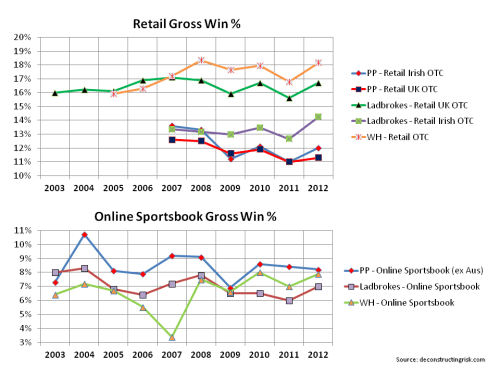
I have found it difficult to get metrics for the profitability of both the retail and the online gaming businesses. As discussed above on the FOBT business, the operating profit contribution from gaming can be significant. I suspect that online gaming also contributes significantly to the online operating profit although not as high as the 70% to 80% contribution that I estimated for the retail business

Online gaming is also a more cross border business and is the fastest growing segment of the gambling industry. H2 Gambling Capital, a leading supplier of data and market intelligence on the global gambling industry, puts the size of the global online gaming market at approx $30 billion. Large markets such as the US are seen as ultimately providing a massive opportunity for growth once regulatory issues are resolved. Although firms withdrew from the US in 2006 after the passing of the Unlawful Internet Gambling Enforcement Act (UIGEA), individual States such as Nevada and New Jersey are looking at ways that they can approve online gaming and challenge federal restrictions.

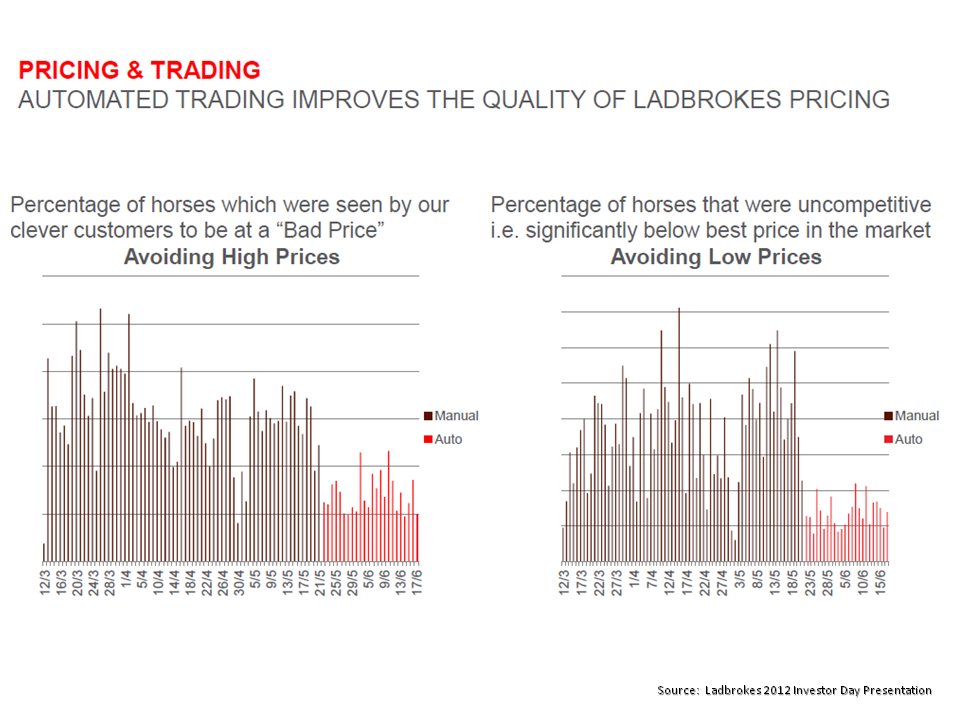
Although the established firms like William Hill and Ladbrokes are facing headwinds in their business with significant competition from online upstarts like Paddy Power, Bet365 and Betfair, they have size and powerful brands on their side. Both have made significant investments in IT infrastructure to support their business. The area of liability management is one that is particularly interesting. Ladbrokes, for example, has made significant investment in enhancing their trading abilities through the development of Morse, their own algorithmic robot. They cite the use of Morse in improving pricing which is particular important in the growing bet in play (BIP) market, as the exhibit shows.

click to enlargeLadbrokes Pricing & Trading Exhibit 2012 Investor Day

They also cite the use of such active liability management tools in improving outcomes such as the Royal Ascot results below.

click to enlargeLadbrokes Liability Management Exhibit 2012 Investor Day

Changes in the whole betting and gaming sector have been rapidly evolving over recent years. These changes and the impact of betting exchanges will be the subject of a follow on post with some further musings in the coming weeks.