Tag Archives: reinsurance market

Same old guff

Now that the US hurricane season is over without any material events, I had a quick look over a few transcripts of conference calls in the specialty insurance and reinsurance sectors to see if there was any interesting comments on where the market is going.

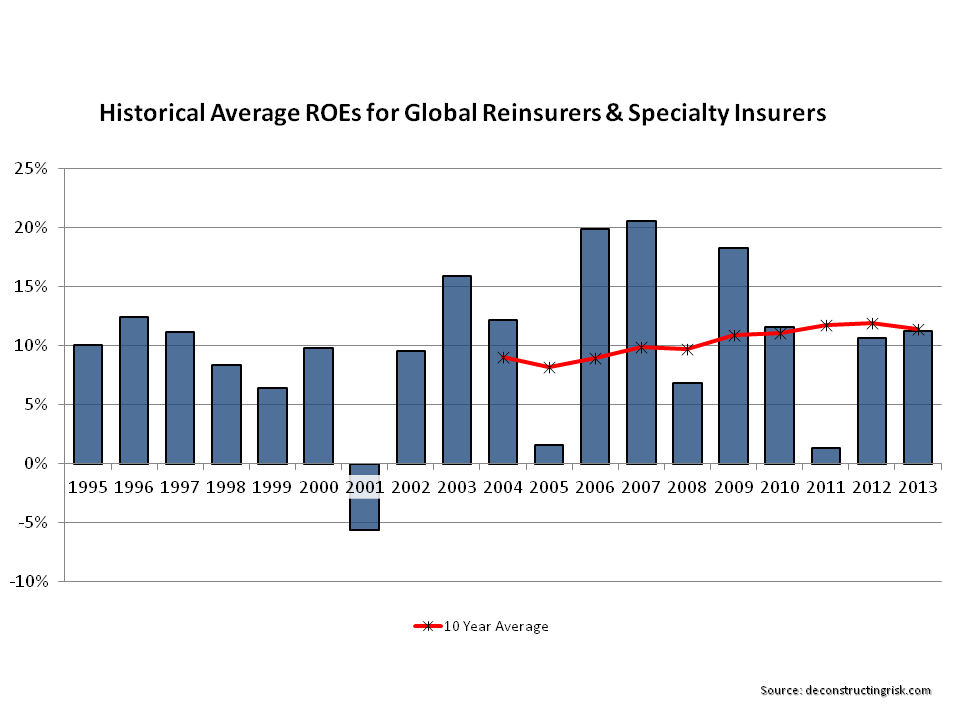
Nearly everybody claims to be mitigating the challenging market conditions by ducking & diving between business classes whilst keeping their overall underwriting discipline. The softness in the reinsurance market has spread into the insurance market, albeit not to the same extent. The reality is that results continue to be flattered by reserve releases, low loss activity and improved loss trends. Market realities are slowly being reflected in ROEs which are coming down to the low double digits.

Nearly all of the reinsurers are claiming to be the winners in the structural changes in the “tiering” of the market whereby cedants are reducing their reinsurance spend and concentrating that spend amongst a select group of reinsurers. Everybody has special relationships and the gravity defying underwriters! That same old guff was the typical response in the late 1990s.

The only interesting comment that I could find was from the ever colourful Ed Noonan of Validus who, after claiming that not everybody is as disciplined as they claim (he was talking about the large generalist reinsurers), said the following:

“It’s unfortunate because the market has had such strong discipline for the last decade. There are no magical segments that are beautifully priced, and the idea that a well-diversified portfolio poorly priced risk makes sense is an economic capital model-based fantasy.”

The last sentence reminds me of one of my favourite quotes from Jim Leitner of Falcon Management that “there is no real diversification in owning a portfolio of overvalued assets“.

My view is that few economic capital models in the insurance market which are currently being used to allocate capital to business classes are taking such arguments seriously enough and most are likely over-estimating the benefit of diversification across soft or under-priced portfolios.


Uncorrelated CaT capital “is the cheapest”

One of the reasons given by market participants for competitive pricing in the ILS markets is the lower cost of capital required by such instruments due to the uncorrelated nature of the underlying exposure with other classes. I previously posted on the lower risk return for an ILS fully collaterised portfolio against a similar portfolio written by a mono-line property catastrophe reinsurer. The ILS investor may be prepared to accept a lower return due to the uncorrelated nature of the exposure. It is nonetheless resulting in lower prices for risk which has always ended badly in the past.

Twelve Capital are a well known ILS investment manager and recently published a white paper on the impact of ILS capital on the reinsurance industry. I liked the way they described the lower cost of capital issue, as below:

“Equity is the most expensive form of capital for the (re)insurance industry. Thanks to its diversification benefits, ILS is the cheapest. The most popular form of investment for those looking to enter the reinsurance market was, prior to the birth of ILS, equity offered by traditional reinsurers. However, returns on equity are eroded by company management costs and the tendency of reinsurers to diversify into less profitable lines of business. In addition, financial market investments on the asset side of the balance sheet expose reinsurance shareholders to additional financial market risks. A listed reinsurance stock thus has the disadvantage of being highly correlated to equity markets in general.

So, what ought to be a fundamentally uncorrelated investment gets transformed into a correlated investment, and the diversification benefit is lost. The investor is also exposed to the risk that the management of reinsurance companies might not always act in the best interests of shareholders.

As insurance investors focus on those lines of business that are favourably priced and soundly modelled, reinsurance companies might end up losing their most profitable lines to the ILS market. And it is this source of profit that reinsurers have traditionally relied upon to support and cross-subsidise substantial volumes of business that generally only break even. With profitable lines taken away by more efficient investors, reinsurance companies are left with business models that cannot sustain conventional cross-subsidisation.”

The comment on reinsurer’s management is a bit below the belt! The impact of the loss of the low frequency/high severity business to the traditional market is a valid one though. However, the long histories of the largest tier 1 reinsurers with large diverse portfolios and the ability to provide products and services across most business lines and jurisdictions indicate more robust business models than the commentary suggests in my opinion.

My previous post looked at the capital return of a fully collaterised provider such as an ILS fund against a mono-line catastrophe provider such as a property cat reinsurer. To see if the commentary above on a correlated investment is reflective of actual experience, the graph below shows the S&P500 against the share prices of the property catastrophe reinsurers Renaissance Re, Validus Re, Montpelier Re and Platinum Re since late 2002. Excluding Montpelier Re, which obviously had some company specific issues after the 2005 wind losses, the R2 for the other firms is remarkably similar around 65%. This suggests investing in the equity of these firms has indeed been a correlated investment in the past.

click to enlargePropCaT Reinsurers correlated to SP500

It emphasises that the traditional reinsurance market needs to focus on reducing such correlation, whether real or wrongly perceived, to compete better for this cheap capital.

Historical ROEs in reinsurance & specialty insurance

I was talking to an analyst last week about the returns on equity in the traditional reinsurer/specialty insurer market versus that in the ILS market. I have posted recently on the mid single digit returns currently on offer from (unlevered) ILS funds and also on the ROEs in the “traditional” market.

We couldn’t agree on what the historical ROE from the traditional market going back 20 years was so I decided to have a look at some figures. The graph below represents a simple average of a sample of firms going back to 1995. I selected a simple average rather than a weighted average as it should be a good representation of the varying business models and used operating ROEs where possible to reflect underwriting results. The number of firms in the 1990s in the sample is relatively small compared to the 2000s as many of the current firms were not around in their current form in the 1990s.

click to enlargeHistorical Reinsurer Specialty Insurer ROEs 1995 to 2013

The interesting outcome is that since 1995 the average (of the average annual operating) ROE is 10% with the 10 year average increasing from around 8%-9% to 11%-12% more recently. The volatility is obviously a function of the underlying risk (the standard deviation is 6%) although it is interesting that the recent high losses of 2005 and 2011 were not enough to push the average ROEs into negative territory. That illustrates the importance of differing business models in the sector.

Given the depressed level of risk premia across financial markets, it’s understandable that the capital markets have been attracted by a sector with an average ROE of 10%. Of course, the influx of new capital is making the average ever more unattainable. KBW are the latest market commentator who has called the relaxation of terms and conditions in reinsurance as a result of the softening market as “dangerous”. As the old underwriting adage goes – “don’t let the smell of the premium distract you from the stink of the risk”.

Insurance ROEs earned the hard way

Munich kicked off the year end reporting season for insurers this week with a pre-announcement of results that beat their guidance. For non-life reinsurance, low large and catastrophe losses plus 5% of prior year releases mean that the 92% combined ratio is only 1% higher than 2012 for Munich Re despite the weak pricing market.

I am expecting to see strong non-life results across the market as it looks like attritional loss ratios for 2013 are lower than average which, with low catastrophe losses, should make for low combined ratios in 2013.

For specialty nonlife insurers and reinsurers, I would expect combined ratios to come in the mid to high eighties on average with ROEs in the low to mid teens. The relatively low investment returns are hurting ROEs which in the past would of given high teens or low twenties for such underwriting ratios.

The business models of the European composite reinsurers are not as sensitive to combined ratio with the life side providing more stable earnings. I would expect most of the large composite reinsurers to come in in the low 90s or high 80s (Munich’s figure was 92%) whilst giving ROEs similar to their non-life specialty brothers in the low to mid teens.

The graph below illustrates that todays combined ratios don’t mean the high ROEs they once did (2013 figures are as at Q3).

click to enlargeInsurance ROEs and Combined Ratios 2004 to 2013


Another look across insurance cycles

Following on from a previous post on insurance cycles and other recent posts, I have been looking over the inter-relationship between insurance cycles in the US P&C market, the Lloyds of London market and the reinsurance market. Ideally, the comparisons should be done on an accident year basis (calendar year less prior year reserve movements) with catastrophic/large losses for 2001/2005/2011 excluded but I don’t (yet) have sufficient historical data to make such meaningful comparisons.

The first graph shows calendar year combined ratios in each of the three markets. The US P&C figures contain both consumer and commercial business and as a result are less volatile with the other markets. For example, Lloyds results are from specialty business classes like energy, marine, credit & surety, A&H, specialty casualty, excess and surplus (E&S) lines and reinsurance. The reinsurance ratios are those for most reinsurers as per S&P in their annual global reports. For good measure, I have also included the US real interest rates to show the impact that reduced investment income is having on the trend in combined ratios across all markets. Overall, ratios have been on a downward trend since the early 1990s. However, if catastrophic losses and reserve releases are excluded ratios have been on an upward trend since 2006 across Lloyds and the reinsurance markets. Recent rate increases in the US such as the high single digit rate increases in commercial property & workers comp (see Aon Benfield January report for details on US primary rate trends) may mean that the US P&C market comes in with a combined ratio below 100% for the full 2013 year (from 102% and 106% in 2012 and 2011 respectively).

click to enlargeInsurance Cycle Combined RatiosAs commented on above, the US P&C ratios cover consumer and commercial exposures and don’t fully show the inter-relationship between the different business classes across that market. The graph below shows the calendar year ratios in the US across the main business classes and paint a more volatile picture than the red line above.

click to enlargeUS Commercial Business Classes Combined Ratios