Tag Archives: catastrophic losses

Multiple Temptation

I thought it was time for a quick catch up on all things reinsurance and specialty insurance since my last post a year ago. At that time, it looked like the underlying rating environment was gaining momentum and a hoped-for return to underwriting profitability looked on the cards. Of course, since then, the big game changer has been COVID-19.

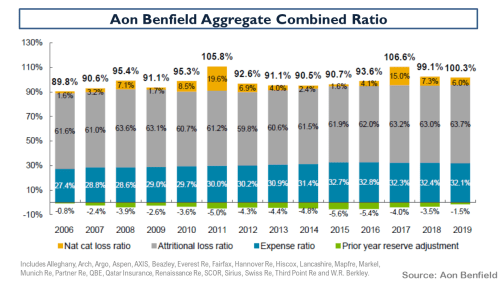
A quick catch-up on the 2019 results, as below, from the Aon Reinsurance Aggregate (ARA) results of selected firms illustrates the position as we entered this year. It is interesting to note that reserve releases have virtually dried up and the 2019 accident year excluding cats is around 96%.

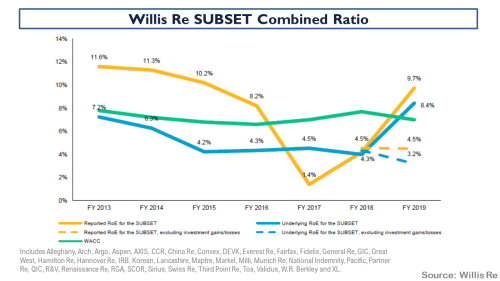
The Willis Re subset of aggregate results is broadly similar to the ARA (although it contains a few more of the lesser players and some life reinsurers and excludes firms like Beazley and Hiscox) and it shows that on an underling basis (i.e. accident year with normalised cat load), the trend is still upwards and more rate improvement is needed to improve attritional loss ratios.

The breakdown of the pre-tax results of the ARA portfolio, as below, shows that investment returns and gains saved the day in 2019.

The ROE’s of the Willis portfolio when these gains were stripped out illustrates again how underwriting performance needs to improve.

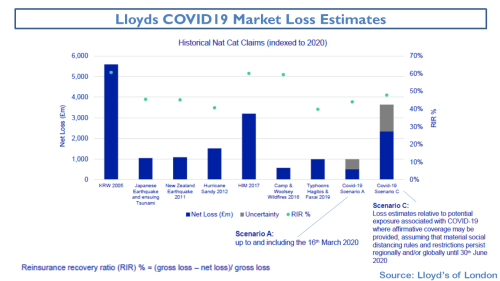
Of course, COVID-19 has impacted the sector both in terms of actual realised losses (e.g. event cancellations) and with the cloud of uncertainty over reserves for multiple exposures yet to be fully realised. There remains much uncertainty in the sector about the exact size of the potential losses with industry estimates ranging widely. Swiss Re recently put the figure at between $50-80 billion. To date, firms have established reserves of just over $20 billion. One of the key uncertainties is the potential outcome of litigation around business interruption cover. The case brought in the UK by the FCA on behalf of policyholders hopes to expedite lengthy legal cases over the main policy wordings with an outcome expected in mid-September. Lloyds industry insurance loss estimate is within the Swiss Re range and their latest June estimate is shown below against other historical events.

I think Alex Maloney of Lancashire summarised the situation well when he said that “COVID-19 is an ongoing event and a loss which will take years to mature”, adding that for “the wider industry the first-party claims picture will not be clear until 2021”. Evan Greenberg of Chubb described the pandemic as a slow rolling global catastrophe impacting virtually all countries, unlike other natural catastrophes it has no geographic or time limits and the event continues as we speak” and predicted that “together the health and consequent economic crisis will likely produce the largest loss in insurance history, particularly considering its worldwide scope and how both sides of the balance sheet are ultimately impacted”.

The immediate impact of COVID-19 has been on rates with a significant acceleration of rate hardening across most lines of business, with some specialty lines such as certain D&O covers have seen massive increases of 50%+. Many firms are reporting H1 aggregate rate increases of between 10% to 15% across their diversified portfolios. Insurance rate increases over the coming months and reinsurance rates at the January renewals, assuming no material natural cats in H2 2020, will be the key test as to whether a true hard market has arrived. Some insurers are already talking about increasing their risk retentions and their PMLs for next year in response to reinsurance rate hardening.

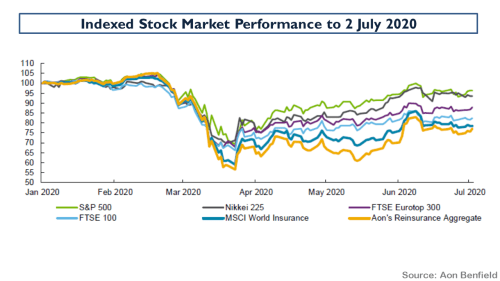
Valuations in the sector have taken a hit as the graph below from Aon on stock performance shows.

Leaving the uncertainty around COVID-19 to one side, tangible book multiples amongst several of my favourite firms since this March 2018 post, most of whom have recently raised additional capital in anticipation of a broad hard market in specialty insurance and reinsurance market, look tempting, as below.

The question is, can you leave aside the impact of COVID-19? That question is worthy of some further research, particularly on the day that Hiscox increased their COVID-19 reserves from $150 million to $230 million and indicated a range of a £10 million to £250 million hit if the UK business interruption case went against them (the top of the range estimate would reduce NTAs by 9%).

Food for thought.

Creepy Things

It has been a while since I looked at the state of the reinsurance and specialty insurance markets. Recent market commentary and insurers’ narratives at recent results have suggested market rates are finally firming up, amidst talk of reserve releases drying up and loss creep on recent events.

Just yesterday, Bronek Masojada the CEO of Hiscox commented that “the market is in a better position than it has been for some time”. The Lancashire CEO Alex Maloney said he was “encouraged by the emerging evidence that the (re)insurance market is now experiencing the long-anticipated improvements in discipline and pricing”. The Chubb CEO Evan Greenberg said that “pricing continued to tighten in the quarter while spreading to more classes and segments of business, particularly in the U.S. and London wholesale market”.

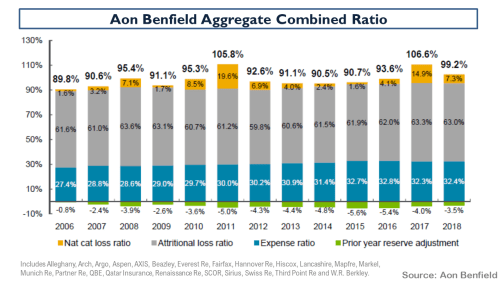
A look at the historical breakdown of combined ratios in the Aon Benfield Aggregate portfolio from April (here) and Lloyds results below illustrate the downward trend in reserve releases in the market to the end of 2018. The exhibits also indicate the expense disadvantage that Lloyds continues to operate under (and the reason behind the recently announced modernisation drive).

click to enlarge

click to enlarge

In the Willis Re mid-year report called “A Discerning Market” their CEO James Kent said “there are signs that the longstanding concern over the level of reserve redundancy in past year reserves is coming to fruition” and that in “some classes, there is a clear trend of worsening loss ratios in recent underwriting years due to a prolonged soft market and an increase in loss severity.

 In their H1 presentation, Hiscox had an exhibit that quantified some of the loss creep from recent losses, as below.

click to enlarge

The US Florida hurricane losses have been impacted by factors such as assignment of benefits (AOB) in litigated water claims and subsequently inflating repair costs. Typhoon Jebi losses have been impacted by overlapping losses and demand surge from Typhoon Trami, the Osaka earthquake and demand from Olympics construction. Arch CEO Marc Grandisson believes that the market missed the business interruption and contingent BI exposures in Jebi estimates.

The fact that catastrophic losses are unpredictable, even after the event, is no surprise to students of insurance history (this post on the history of Lloyds is a testament to unpredictability). Technology and advances in modelling techniques have unquestionably improved risk management in insurance in recent years. Notwithstanding these advances, uncertainty and the unknown should always be considered when model outputs such as probability of loss and expected loss are taken as a given in determining risk premium.

To get more insight into reserve trends, it’s worth taking a closer look at two firms that have historically shown healthy reserve releases – Partner Re and Beazley. From 2011 to 2016, Partner Re’s non-life business had an average reserve release of $675 million per year which fell to $450 million in 2017, and to $250 million in 2018. For H1 2019, that figure was $15 million of reserve strengthening. The exhibit below shows the trend with 2019 results estimated based upon being able to achieve reserve releases of $100 million for the year and assuming no major catastrophic claims in 2019. Despite the reduction in reserve releases, the firm has grown its non-life business by double digits in H1 2019 and claims it is “well-positioned to benefit from this improved margin environment”.

click to enlarge

Beazley is one of the best insurers operating from London with a long history of mixing innovation with a balanced portfolio. It has doubled its net tangible assets (NTA) per share over the past 10 years and trades today at a 2.7 multiple to NTA. Beazley is also predicting double digit growth due to an improving rating environment whilst predicting “the scale of the losses that we, in common with the broader market, have incurred over the past two years means that below average reserve releases will continue this year”.

click to enlarge

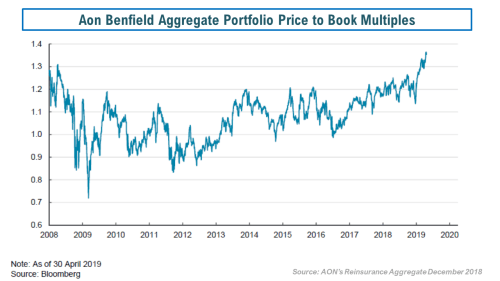
And that’s the rub. Although reserves are dwindling, rate improvements should help specialty (re)insurers to rebuild reserves and improve profitability back above its cost of capital, assuming normal catastrophe loss levels. However, market valuations, as reflected by the Aon Benfield price to book exhibit below, look like they have all that baked in already.

click to enlarge

And that’s a creepy thing.

When does one plus one equal more than two?

S&P released a thoughtful piece on Monday called “Hedge Fund Reinsurers: Are The Potential Rewards Worth The Added Risk?” I couldn’t find a direct link to the article but Artemis has a good summary here. They start by asking whether combining a reinsurer strategy with a hedge fund strategy can create higher risk adjusted returns than the two approaches could achieve separately. They conclude with the following:

“The potential crossover between hedge funds and reinsurers offers compelling possibilities. However, a commensurate focus on additional risks would have to supplement the singular focus on higher investment returns. Considering both is necessary in determining whether one plus one is truly greater than two. This depends on whether combining hedge funds and reinsurers can create additional diversification benefits that don’t occur in these two types of organisations independently, thus creating a more capital efficient vehicle. We believe it’s possible. However, in our view, closing the gap between reinsurer and hedge fund risk cultures and implementing prudent risk controls is necessary to realize these benefits.”

I have posted on this topic before. One of the hedge fund reinsurer strategies is to combine low volatility P&C business (primarily as a source of cheap “float”)with the alpha seeking asset business. My problem with this strategy is that every reinsurer is looking out for low volatility/stable return (re)insurance business (its the holy grail after all!), even more so in today’s highly efficient and competitive market. So what can clever chino wearing quants living on a tropical island offer that every other established reinsurer can’t? I suspect that the answer is to price the business with a higher discount rate based upon their higher expected return. S&P point out that this may create increased risks elsewhere such as liquidity risk in stress scenarios. Another strategy is to combine volatile property catastrophe risk with higher asset risk, essentially combining two tail risk strategies. This pushes the business model more towards the highly leveraged model as per that used by the monoline insurer, the ultimate “picking up pennies in front of a stream-roller” play.

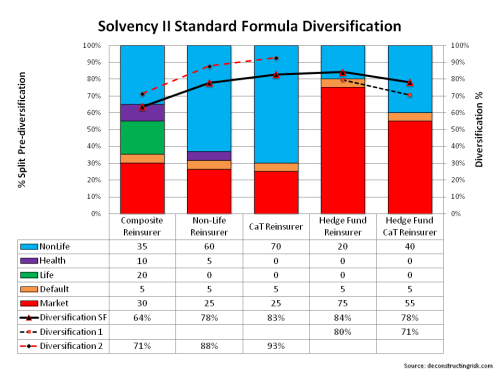
To get an idea of the theory behind the various strategies, the graph below illustrates the diversification of each using the calculation in the Solvency II standard formula, with different concentrations for market, counterparty, life, health and non-life risks (selected for illustration purposes only).

click to enlargeHedge Fund Reinsurer Diversification

The graph shows that a hedge fund reinsurer with a low volatility liability strategy shows the least amount of diversification compared to a composite, non-life or a property cat reinsurer due to the dominance of market risk. Interesting, the high risk strategy of combining a hedge fund strategy on assets with property cat on the liability side shows diversification at a similar level (i.e. 78%) to that of a non-life reinsurer where non-life risk dominates.

Hedge fund reinsurers would no doubt argue that, through their alpha creating ability, the 25% correlation between market and non-life risk is too high for them. Reducing that correlation to 0% for the hedge fund reinsurers gives the diversification above, as per “Diversification 1” above. Some may even argue that the 25% correlation in the standard formula is too low for traditional players, as this post on Munich Re’s results excluding catastrophic losses illustrates, so I have shown the diversification for an illustrative composite, non-life or a property cat reinsurer with a 75% correlation between market and non-life risks, as per “Diversification 2” above.

In my opinion, one plus one is always two and under-priced risk cannot be justified by combining risk strategies. Risk is risk and combining two risks doesn’t change the fundamentals of each. One strategy that hasn’t re-emerged as yet is what I call the hedging reinsurer whereby liabilities are specifically hedged by asset strategies. Initially, the property cat reinsurers tried to use weather derivatives to hedge their risk but an illiquid market for weather derivatives and the considerable amount of basis risk resulted in difficulties with the strategy. The strategy is commonly used on the life side of the business with investment type business, particularly business with guarantees and options. Also the appetite for longevity risk by those reinsurers with significant mortality exposure that can significantly hedge the longevity risk is a major developing market trend. I do not see why the strategy could not be used more on the non-life side for economic related exposures such as mortgage indemnity or other credit type exposures.

In the immediate term, the best strategy that I see is the arbitrage one that those who have survived a few underwriting cycles are following, as per this post. On that point, I noticed that BRIT, in their results today, stated they have “taken advantage of current market conditions in reinsurance to significantly strengthen group wide catastrophe cover. These additional protections include a property aggregate catastrophe cover and some additional variable quota share protection”. When risk is cheap, arbitrating it makes the most sense to me as a strategy, not doubling up on risks.

Lancashire…so much to answer for.

My bearishness on the reinsurance and specialty insurance sector is based upon my view of a lack of operating income upside due to the growing pricing pressures and poor investment income. I have posted many times (most recently here) on the book value multiple expansion that has driven valuations over the past few years. With operating income under pressure, further multiple expansion represents the only upside in valuations from here and that’s not a very attractive risk/reward profile in my view. So I am happy to go to the sidelines to observe from here.

So, what does this mean for my previously disclosed weak spot for Lancashire, one the richest valued names in the sector? Lancashire posted YE2013 results last week and disappointed the market on the size of its special dividend. As previously highlighted, its Cathedral acquisition marked a change in direction for Lancashire, one which has confused observers as to its future. During the conference call, in response to anxious analysts, management assured the market that M&A is behind it and that its remains a nimble lead specialist high risk/high return underwriter dedicated to maximising shareholder returns from a fixed capital base, despite the lower than expected final special dividend announced for 2013.

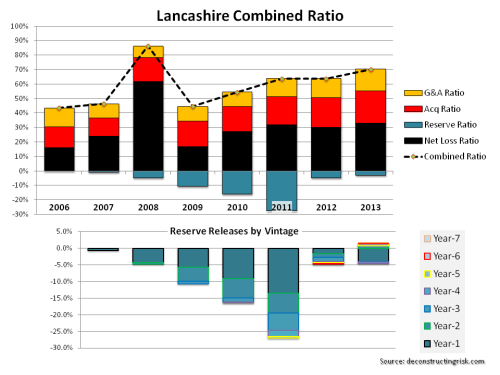
The graph below illustrates the past success of Lancashire. Writing large lead lines on property, energy, marine and aviation business has resulted in some astonishingly good underwriting returns for Lancashire in the past. The slowly increasing calendar year combined ratios for the past 5 years and the lack of meaningful reserve releases for the past two year (2013 even saw some reserve deterioration on old years) show the competitive pressures that have been building on Lancashire’s business model.

click to enlargeLancashire Combined Ratio Breakdown 2006 to 2013

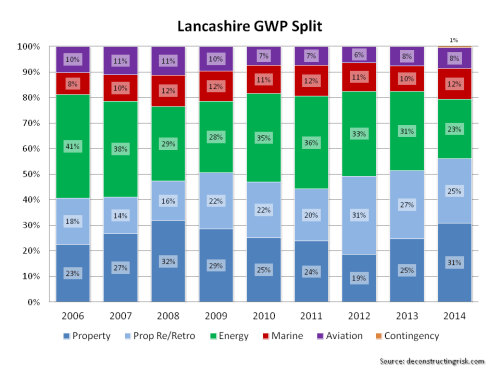
The Cathedral acquisition offers Lancashire access to another block of specialist business (which does look stickier than some of Lancashire’s business, particularly on the property side). It also offers Lancashire access to Lloyds which could have some capital arbitrage advantages if Lancashire starts to write the energy and terrorism business through the Lloyds’ platform (as indicated by CEO Richard Brindle on the call). Including the impact of drastically reducing the property retrocession book for 2014, I estimate that the Cathedral deal will add approx 25% to GWP and NEP for 2014. Based upon indications during the call, I estimate that GWP breakdown for 2014 as per the graph below.

click to enlargeLancashire GWP Split

One attractive feature of Lancashire is that it has gone from a net seller of retrocession to a net buyer. Management highlighted the purchase of an additional $100 million in aggregate protection. This is reflected in the January 1 PML figures. Although both Lancashire and Cathedral write over 40% of their business in Q1, I have taken the January 1 PML figures as a percentage of the average earned premium figures from the prior and current year in the exhibit below.

click to enlargeLancashire PMLs January 2010 to January 2014

The graphs above clearly show that Lancashire is derisking its portfolio compared to the higher risk profile of the past two years (notably in relation to Japan). This is a clever way to play the current market. Notwithstanding this de-risking, the portfolio remains a high risk one with significant natural catastrophic exposure.

It is hard to factor in the Cathedral results without more historical data than the quarterly 2013 figures provided in the recent supplement (another presentation does provide historical ultimate loss ratio figures, which have steadily decreased over time for the acquired portfolio) and lsome of the CFO comments on the call referring to attritional loss ratios & 2013 reserve releases. I estimate a 68% combined ratio in 2014, absent significant catastrophe losses, which means an increase in the 2013 underwriting profit of $170 million to $220 million. With other income, such as investment income and fee income from the sidecar, 2014 could offer a return of the higher special dividend.

So, do I make an exception for Lancashire? First, even though the share price hasn’t performed well and currently trades around Stg7.30, the stock remains highly valued around 180% tangible book.  Second, pricing pressures mean that Lancashire will find it hard to make combined ratios for the combined entities significantly lower than the 70% achieved in 2013, in my view. So overall, although Lancashire is tempting (and will be more so if it falls further towards Stg7.00), my stance remains that the upside over the medium term does not compensate for the potential downside. Sometimes it is hard to remain disciplined……

Another look across insurance cycles

Following on from a previous post on insurance cycles and other recent posts, I have been looking over the inter-relationship between insurance cycles in the US P&C market, the Lloyds of London market and the reinsurance market. Ideally, the comparisons should be done on an accident year basis (calendar year less prior year reserve movements) with catastrophic/large losses for 2001/2005/2011 excluded but I don’t (yet) have sufficient historical data to make such meaningful comparisons.

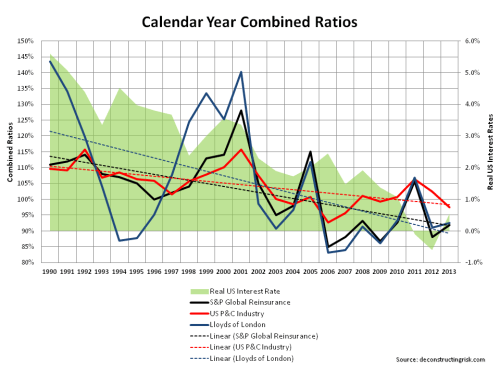
The first graph shows calendar year combined ratios in each of the three markets. The US P&C figures contain both consumer and commercial business and as a result are less volatile with the other markets. For example, Lloyds results are from specialty business classes like energy, marine, credit & surety, A&H, specialty casualty, excess and surplus (E&S) lines and reinsurance. The reinsurance ratios are those for most reinsurers as per S&P in their annual global reports. For good measure, I have also included the US real interest rates to show the impact that reduced investment income is having on the trend in combined ratios across all markets. Overall, ratios have been on a downward trend since the early 1990s. However, if catastrophic losses and reserve releases are excluded ratios have been on an upward trend since 2006 across Lloyds and the reinsurance markets. Recent rate increases in the US such as the high single digit rate increases in commercial property & workers comp (see Aon Benfield January report for details on US primary rate trends) may mean that the US P&C market comes in with a combined ratio below 100% for the full 2013 year (from 102% and 106% in 2012 and 2011 respectively).

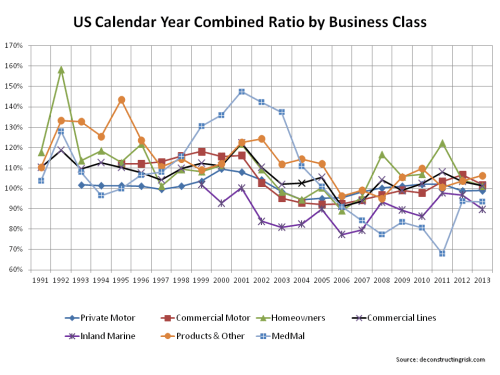
click to enlargeInsurance Cycle Combined RatiosAs commented on above, the US P&C ratios cover consumer and commercial exposures and don’t fully show the inter-relationship between the different business classes across that market. The graph below shows the calendar year ratios in the US across the main business classes and paint a more volatile picture than the red line above.

click to enlargeUS Commercial Business Classes Combined Ratios