
Sometime during early 2007 I recall having a conversation with a friend who was fretting about the dangers behind the exponential growth in the unregulated credit default swap (CDS) market. His concerns centred on the explosion in rampant speculation in the market by way of “naked” CDS trades (as opposed to covered CDS where the purchaser has an interest in the underlying instrument). The notional CDS market size was then estimated to be considerably higher than the whole of the global bond market (sovereign, municipal, corporate, mortgage and ABS). At the time, I didn’t appreciate what the growth in the CDS market meant. Obviously, the financial crisis dramatically demonstrated the impact!
More recently the London Whale episode at JP Morgan has again highlighted the thin line between the use of CDS for hedging and for speculation. Last week I tried to find a graph that illustrated what had happened to the size of the notional CDS market since the crisis and had to dig through data from the International Swaps and Derivatives Association (ISDA) to come up with the graph below.
click to enlarge
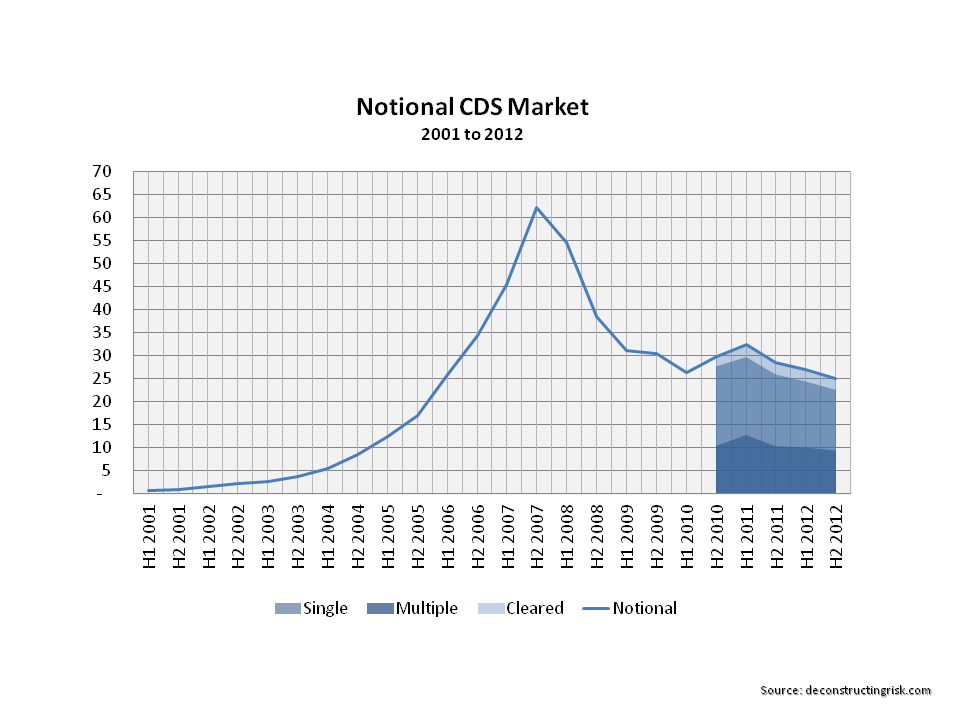
Comparing the size of the notional CDS market to the size of the bond market is a flawed metric as the notional CDS market figures are made up of buyers and sellers (in roughly equal measures) and many CDS can relate to the same underlying bond. Net CDS exposures are only estimated to be a few percent of the overall market today although that comparison ignores the not inconsiderable counterparty risk. Notwithstanding the validity of the comparison, the CDS market of $25 trillion as at the end of 2012 is still considerable compared to the approximate $100 trillion global bond market today. The dramatic changes in the size of both the CDS market (downward) and the bond market (upward) directly reflect the macroeconomic shifts as a result of the financial crisis.
The financial industry lobbied hard to ensure that CDS would not be treated as insurance under the Dodd-Frank reforms although standardized CDS are being moved to clearing houses under the regulations with approximately 10% of notional CDS being cleared in 2012 according to the ISDA. The other initiative to reduce systemic risk is portfolio compression exercises across the OTC swap market whereby existing trades are terminated and restructured in exchange for replacement trades with smaller notional sizes.
Although the industry argues that naked CDS increase the liquidity of the market and aid price discovery, there is mixed research on the topic from the academic world. In Europe, naked CDS on sovereign bonds was banned as a result of the volatility suffered by Greece during the Euro wobbles. The regulatory push of OTC markets to clearing houses does possibly raise new systemic risks associated with concentration of credit risk from clearing houses! Other unintended consequences of the Dodd Franks and Basel III regulatory changes is the futurization of swaps as outlined in Robert Litan’s fascinating article.
Anyway, before I say something silly on a subject I know little about, I just wanted to share the graph above. I had thought that the specialty insurance sector, particularly the property catastrophe reinsurers, may be suited for a variation on a capital structure arbitrage type trade, particularly when many such insurers are increasingly using sub-debt and hybrid instruments in their capital structures (with Solvency II likely to increase the trend) as a recent announcement by Twelve Capital illustrates. I wasn’t primarily focussed on a negative correlation type trade (e.g. long equity/short debt) but more as a way of hedging tail risk on particular natural catastrophe peak zones (e.g. by way of purchasing CDS on debt of a overexposed insurer to a particular zone). Unfortunately, CDS are not available on these mid sized firms (they are on the larger firms like Swiss and Munich Re) and even if they were they would not be available to a small time investor like me!

I think a few comments are in order.
The big volume of CDS traded up to 2007 was also driven by synthetic CDOs. Depending on the structure USD 1 mn of CDOs could need up to USD 10mn (or sometimes even more) single name CDS for delta hedging. So that was one driver for sure.
Besides that I dare say that the actual size was never much above USD 5 trn or so, after accounting for nettting (and probably in the vicinity of USD 2 – 3 trn now after many CDOs have been unwound). The fact that the volume declined so much is imo mainly driven be netting and people cleaning up their books (cancelling offsetting trades). This is tedious work without any profit, so nobody was in the mood for it before the regulation came.
The bond market on the other hand consists mainly of government bonds and I dare say mostly of treasuries. The currently high debt/GDP ratios have to be felt somewhere. I would be interested to hear how big the bond market was in 2007, say, but I fear that no proper figures are easily available (bonds are as intransparent as CDS although TRACE made things a little better but somehow nobody seems to complain about that !).
Banning short sales or puts usually increased volatility in the respective market instead of dampening it. There is some academic research out there although I don’t have anything at hand. Banning short sovereign CDS should have had the same effect.
The whole trend of central clearing of CDS makes me shiver ! We talk about asymmetric risk here with usually low probability and high LGD. Putting it all together in a clearing house makes the risk more remote (ie the PD lower) and increases the LGD accordingly (you net out only part of the expected loss, the rest is collatralized). We should better keep our fingers crossed that the clearing houses know what they are doing…
Capital structure arbitrage is a beast. I don’t know anyone or have heard of anyone who made real money out of this. You have a ton of factors in between your cat exposure, say, and the bond somewhere in the capital structure. It starts with bond-CDS basis and doesn’t end with bankruptcy proceedings and the fact that as a CDS holder you don’t have a seat at the table. The local bankruptcy law also plays a major role. If you are interested, Marty Whitman has a book out there about Distress Investing (and he only does bonds and tries to secure a majority in one class under US bankruptcy law).
All the best,
Eddie
Thanks Eddie for CDS input. I had a figure of $25 trillion for the bond market in 2007. As you say, creditable figures are hard to find. Could the bond market have quadrupled since 2007?
Thanks for the heads up on capital structure arbitrage, its really not an area I know much about. I do understand the mass of uncertainties that an insurer’s balance sheet can contain & I didn’t really phase the post that well. will check out Whitman book.
I had been idly thinking (and it is just idle as I don’t have access to invest in any of these instruments) that if you could get a good yield from a cat bond with say Florida wind exposure (and that’s getting more unlikely every day, even the Economist has an article the rush of capital into cat bonds this week!), how might you try and hedge the principle risk? Fully accept the point about no such thing as a perfect hedge (except in a Japanese garden!), Notwithstanding that, I was thinking if you could find a company with a large net exposure to Florida that you thought could be in trouble if a storm hit Florida, could you either use an option on the equity or a CDS on the debt. Accept the point that both can be messy and may not perform as expected if a storm hit? What do you think? As crazy an idea as a capital arbitrage trade?
M
My guts feeling says that this quadrupling is mainly driven by govies if at all. Corporate bond issuance increased, but not that much. A more detailed split would be helpful as usual.
Dsclaimer: capital structure arb and options is not what I do for a living so please take my advice with a grain of salt.
This reminds my of one insurer in the ’90s (’95 or ’96 I think). They realized that their reserves were too low a few seconds after they lost 50% of their equity. Which they filled up in turn via new stock issuance. So if I were to hedge (or bet outright) against cat risk I would attack the equity. Bonds are probably too high in the cap structure to be seriously impaired and I have no clue what happens to all those fancy hybrids. From what we saw at banks lately I would guess that good ol’ common stock is the principal form of equity.
Which in turn calls for long term out-of-the-money puts. The tenor should be as long as possible since you need time for the risks to be realized and show up in the balance sheet (I understand that it may take years to settle these types of risks). Now if pooh hits the fan the equity will probably be impaired and the insurance company will either be wound down, rendering the equity worthless, or need a capital increase which lowers the stock price. Check for anti-dilution provisions in the option contract ! The issue is probably that really long tenors (beyond 3 years, say) trade rarely if at all. I know these options exist as bespoke instruments in OTC markets but that doesn’t help you as a retail investor.
But my principal doubt is whether those cat bonds are fairly priced at all. The reason to issue those bonds is typically that it is cheaper than reinsurance, say… Bring in some investors who don’t know and screw them properly.
All the best,
Eddie