Monthly Archives: September 2013

A quick look over the latest IPCC climate change assessment

After the debacle of the last report, the spotlight is back on climate change with the release of the new (fifth) assessment by the Intergovernmental Panel on Climate Change (IPCC). The financial crisis, combined with credibility issues over the last report as a result of errors found after publication, has meant that the issue has taken a back seat in recent years. This assessment is drawn from the work of 209 authors with 50 review editors from 39 countries and more than another 600 contributors from across the global scientific community. It will hopefully dispel the nut job climate change deniers and allow for a renewed focus on concrete actions that can be taken to address climate change issues.

The latest publication from IPCC yesterday is actually a summary of headline statements and a “summary for policymakers” from the IPCC Working Group I which makes an assessment of the physical scientific aspects of the climate change. A full draft report will be published in a few days and is expected to be finalised by late 2013 or early 2014. The two other working groups, creatively named IPCC Working Group II and III, are due to publish their reports in 2014 and are charged with assessments of vulnerability to climate change and options for mitigating the effects respectively.

The language used by IPCC is important. For some reason they use a number terms for uncertainty, as follows:IPCC uncertainty

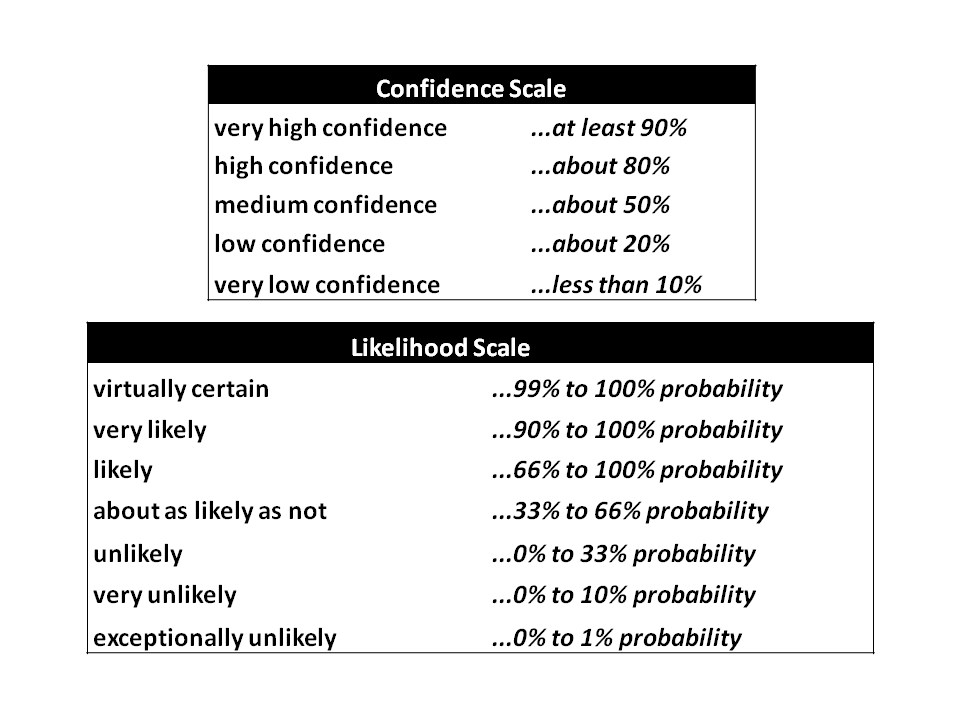
The strongest (and most obvious) statement is:

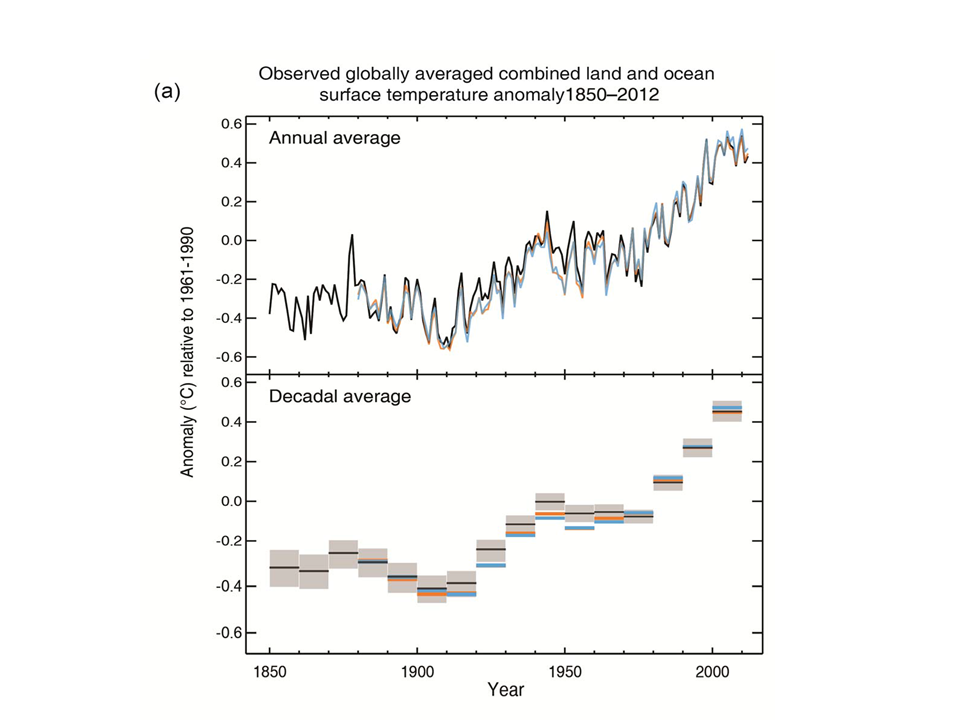
“Warming of the climate system is unequivocal, and since the 1950s, many of the observed changes are unprecedented over decades to millennia. The atmosphere and ocean have warmed, the amounts of snow and ice have diminished, sea level has risen, and the concentrations of greenhouse gases have increased.”

It does sound silly that it has taken us this many years for a statement like that to be made unequivocally but that’s the world we live in. A graph from the summary from WG I is below.

IPCC findings

A number of the headline statements that are being reported in the press are included below.

Very high confidence is assigned to the ability of climate models “to reproduce observed continental-scale surface temperature patterns and trends over many decades, including the more rapid warming since the mid-20th century and the cooling immediately following volcanic eruptions“.

High confidence is assigned to each of the following:

  • Ocean warming dominates the increase in energy stored in the climate system, accounting for more than 90% of the energy accumulated between 1971 and 2010.
  • Over the last two decades, the Greenland and Antarctic ice sheets have been losing mass, glaciers have continued to shrink almost worldwide, and Arctic sea ice and Northern Hemisphere spring snow cover have continued to decrease in extent.
  • The rate of sea level rise since the mid-19th century has been larger than the mean rate during the previous two millennia.

Medium confidence is assigned to the assertion that in “the Northern Hemisphere, 1983–2012 was likely the warmest 30-year period of the last 1400 years.

Other strong statements include the following section (by the way, I think extremely likely is yet another new term meaning over 95% probability!):

“It is extremely likely that human influence has been the dominant cause of the observed warming since the mid-20th century. Continued emissions of greenhouse gases will cause further warming and changes in all components of the climate system. Limiting climate change will require substantial and sustained reductions of greenhouse gas emissions.”

The summary documents also refer to the scenarios used, including four new scenarios, to assess impacts on items including CO2, temperature, sea levels and temperatures. The full draft assessment and next year’s WG II and III reports will likely give more detail.

There is a few intriguing assertions in the report although they are subject to final copyedit.

Medium confidence is used to describe the assessment of whether human actions have resulted in an increase in the frequency, intensity, and/or amount of heavy precipitation. For the early 21st century and the late 21st century it is assessed that increased precipitation is likely over many land areas and very likely over most of the mid-latitude land masses and over wet tropical regions respectively.

Low confidence is used to describe the assessment of whether human actions have resulted in an increase in intense tropical cyclone activity and is also used to describe the likelihood of a change in intense tropical cyclone activity in the early 21st century.

The more detailed draft report from WG I will be interesting reading.

Not all insurers’ internal models are equal

Solvency II is a worn out subject for many in the insurance industry. After over 10 years of in depth discussions and testing, the current target date of 01/01/2016 remains uncertain until the vexed issue of how long term guarantees in life business is resolved.

The aim of the proposed Solvency II framework is to ensure that (re)insurers are financially sound and can withstand adverse events in order to protect policy holders and the stability of the financial system as a whole. Somewhere along the long road to where we are now, the solvency capital requirement (SCR) in Solvency II to achieve that aim was set at an amount of economic capital corresponding to a ruin probability of 0.5% (Value at Risk or VaR of 99.5%) and a one year time horizon.

Many global reinsurers and insurers now publish outputs from their internal models in annual reports and investor presentations, most of which are set at one year 99.5% VaR or an equivalent level. Lloyds’ of London however is somewhat different. Although the whole Lloyds’ market is subject to the one year Solvency II calibration on an aggregate basis, each of the Syndicates operating in Lloyds’ have a solvency requirement based upon a 99.5% VaR on a “to ultimate” basis. In effect, Syndicates must hold additional capital to that mandated under Solvency II to take into account the variability in their results on an ultimate basis. I recently came across an interesting presentation from Lloyds’ on the difference in the SCR requirement between a one year and an ultimate basis (which requires on average a third more capital!), as the exhibit below reproducing a slide from the presentation shows.

click to enlarge

SCR one year ultimate basis

Although this aspect of Lloyds’ of London capital requirements has not been directly referenced in recent reports, their conservative approach does reflect the way the market is now run and could likely be a factor behind recent press speculation on a possible upgrade for the market to AA. Such an upgrade would be a massive competitive plus for Lloyds’.

Lessons not learnt and voices unheard

There have been some interesting articles published over the past week or so to mark the five year anniversary of the Lehman collapse.

Hank Paulson remembered the events of that chaotic time in a BusinessWeek interview. He concluded that despite having a hand in increasing the size of the US banks like JP Morgan and Bank of America (currently the 2nd and 3rd largest global banks by tier 1 capital) “too big to fail is an unacceptable phenomenon”. He also highlighted the risk of incoherence amongst the numerous US and global regulators and that “more still needs to be done with the shadow-banking markets, which I define to be the money-market funds and the so-called repo market, which supplies wholesale funding to banks”.

Another player on the regulatory side, the former chairman of the UK FSA Adair Turner, continued to develop his thoughts on what lessons need to be learnt from the crisis in the article “The Failure of Free Market Finance”, available on the Project Syndicate website. Turner has been talking about these issues in Sweden and London this week (which essentially follow on from his February paper “Debt, Money and Mephistopheles: How Do We Get Out Of This Mess?”). where he argues that there are two key issues which need to be addressed to avert future instability.

The first is how to continue to delever and reduce both private and public debt. Turner believes that “some combination of debt restructuring and permanent debt monetization (quantitative easing that is never reversed) will in some countries be unavoidable and appropriate”. He says that realistic actions need to taken such as writing off Greek debt and a restructuring of Japanese debt. The two graphs below show where we were in terms of private debt in a number of jurisdictions as at the end of 2012 and show that reducing levels of private debt in many developed countries have been offset by increases in public debt over recent years.

click to enlarge Domestic Credit to Private Sector 1960 to 2012

Public and Private Debt as % of GDP OECD US Japan Euro Zone

The second issue that Turner highlights is the need for global measures to ensure we all live in a less credit fuelled world in the future. He states that “what is required is a wide-ranging policy response that combines more powerful countercyclical capital tools than currently planned under Basel 3, the restoration of quantitative reserve requirements to advanced-country central banks’ policy toolkits, and direct borrower constraints, such as maximum loan-to-income or loan-to-value limits, in residential and commercial real-estate lending”.

Turner is arguing for powerful actions. He admits that they effectively mean “a rejection of the pre-crisis orthodoxy that free markets are as valuable in finance as they are in other economic sectors”. I do not see an appetite for such radical actions amongst the political classes nor a consensus amongst policy makers that such a rejection is required. Indeed debt provision outside of the traditional banking systems by way of new distribution channels such as peer to peer lending is an interesting development (see Economist article “Filling the Bank Shaped Hole”)

Indeed the current frothiness in the equity markets, itself a direct result of the on-going (and never ending if the market’s response to the Fed’s decisions this week is anything to go by) loose monetary policy, is showing no signs of abating. Market gurus such as Buffet and Icahn have both come out this week and said the markets are looking overvalued. My post on a possible pullback in September is looking ever more unlikely as the month develops (S&P 500 up 4% so far this month!).

Maybe, just maybe, the 5th anniversary of Lehman’s collapse will allow some of the voices on the need for fundamental structural change in the way we run our economies to be heard. Unfortunately, I doubt it.

Updated TBV multiples of specialty insurers & reinsurers

As it has been almost 6 months until my last post on the tangible book value multiples for selected reinsurers and specialty insurers I thought it was an opportune time to post an update, as per graph the below.

click to enlarge

TBV Multiples Specialty Insurers & Reinsurers September 2013I tend to focus on tangible book value as I believe it is the most appropriate metric for equity investors. Many insurers have sub-debt or hybrid instruments that is treated as equity for solvency purposes. Although these additional buffers are a comfort to regulators, they do little for equity investors in distress.

In general, I discount intangible items as I believe they are the first thing that gets written off when a business gets into trouble. The only intangible item that I included in the calculations above is the present value of future profits (PVFP) for acquired life blocks of business. Although this item is highly interest rate sensitive and may be subject to write downs if the underlying life business deteriorates, I think they do have some value. Whether its 100% of the item is something to consider. Under Solvency II, PVFP will be treated as capital (although the tiering of the item has been the subject of debate). Some firms, particularly the European composite reinsurers, have a material amount (e.g. for Swiss Re PVFP makes up 12% of shareholders equity).

CAT models and fat tails: an illustration from Florida

I have posted numerous times now (to the point of boring myself!) on the dangers of relying on a single model for estimating losses from natural catastrophes. The practise is reportedly widespread in the rapidly growing ILS fund sector. The post on assessing probable maximum losses (PMLs) outlined the sources of uncertainty from such models, especially the widely used commercial vendors models from RMS, AIR and EqeCat.

The Florida Commission on Hurricane Loss Projection Methodology (FCHLPM) was created in 1995 as an independent panel of experts to evaluate computer models used for setting rates for residential property insurance. The website of the FCHLPM contains a treasure trove of information on each of the modelling firms who provide detailed submissions in a pre-set format. These submissions include specifics on the methodology utilised in their models and the output from their models for specified portfolios.

In addition to the three vendor modellers (RMS, AIR, EqeCat), there is also details on two other models approved by FCHLPM, namely Applied Research Associates (ARA) and the Florida Public Hurricane Loss Model (FPHLM)developed by the Florida International University.

In one section of the mandated submissions, the predictions of each of the models on the number of annual landfall hurricanes for a 112 year period (1900 to 2011 is the historical reference period) are outlined. Given the issue over the wind speed classification of Super-storm Sandy as it hit land and the use of hurricane deductibles, I assume that the definition of landfall hurricanes is consistent between the FCHLPM submissions. The graph below shows the assumed frequency over 112 years of 0,1,2,3 or 4 landfall hurricanes from the five modellers.

click to enlargeLandfalling Florida Hurricanes

As one of the objectives of the FCHLPM is to ensure insurance rates are neither excessive nor inadequate, it is unsurprising that each of the models closely matches known history. It does however demonstrate that the models are, in effect, limited by that known history (100 odd years in terms of climatic experiences is limited by any stretch!). One item to note is that most of the models have a higher frequency for 1 landfall hurricane and a lower frequency for 2 landfall hurricanes when compared with the 100 year odd history. Another item of note is that only EqeCat and FPHLM have any frequency for 4 landfall hurricanes in any one year over the reference period.

Each of the modellers are also required to detail their loss exceedance estimates for two assumed risk portfolios. The first portfolio is set by FCHLPM and is limited to 3 construction types, geocodes by ZIP code centroil (always be wary of anti-selection dangers in relying on centroil data, particularly in large counties or zones with a mixture of coastal and inland exposure), and specific policy conditions. The second portfolio is the 2007 Florida Hurricane Catastrophe Fund aggregate personal and commercial residential exposure data. The graphs below show the results for the different models with the dotted lines representing the 95th percentile margin of error around the average of all 5 model outputs.

click to enlarge

Modelled Losses Florida Notional Residential PortfolioModelled Losses FHCF Commercial Residential Portfolio

As would be expected, uncertainty over losses increase as the return periods increase. The tail of outputs from catastrophe models clearly need to be treated will care and tails need to be fatten up to take into account uncertainty. Relying solely on a single point from a single model is just asking for trouble.