Tag Archives: Bank of America

Peak Uncertainty

As we face the peak weeks of the COVID19 virus in the major developed economies, one thing the current COVID19 outbreak should teach us is humility. As humans, we have become far too arrogant about our ability to shape the future. A new book by the economists John Kay and Mervyn King (a former Bank of England governor during the financial crisis) called “ Radical Uncertainty” argues that economists have forgotten the distinction between risk and uncertainty with an over-reliance on using numerical probabilities attached to possible outcomes as a substitute for admitting there are uncertainties we cannot know. How many one in a century events seem to be happening on a regular basis now? Their solution is to build more resilient systems and strategies to confront unpredictable events. Such an approach would have a profound impact on how we organise our societies and economies.

Currently, planning for events with a large impact multiplied by a small probability allows us to effectively continue as we have been after assigning the minimal amount of contingency. Imagine if sectors and industries were run based on been prepared for tail events. That would be a radical change. Very different from our just in time supply chains which minimise capital allocation and maximise return on investment. Our approach to climate change is an obvious case in point and how we have heretofore ignored the environmental externalities of our societies and economies. Given the financial costs this crisis is going to place on future generations, I would suspect that the needs of this cohort of our society will become ever more urgent in the aftermath of the COVID19 pandemic.

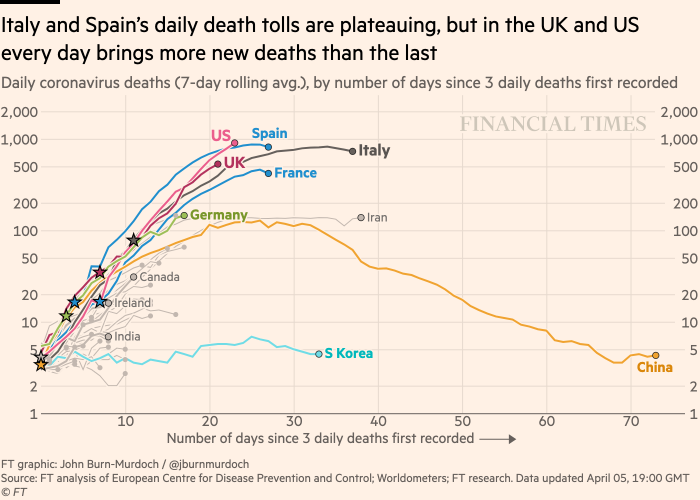
As many people grapple with the current uncertainties presented by this pandemic, we are currently at peak uncertainty in Europe and the US. We are only now getting a sense of how the outbreak is peaking in Europe given the lock down measures in place. How the virus reactions to the relaxation of current measures, how the outbreak will peak across the US and other continents, the economic impact of the outbreak, or the societal impact amongst many other issues are as yet unknown. We do know however that with time over the coming weeks some of these answers will become clearer. For example, as the graph below from the FT shows, we known the approximate path of the outbreak given the policies being pursued today.

A positive narrative could be that existing medications pass rushed COVID19 trials and prove they can blunt the impact of the virus thereby altering the shape of the curve. We can also speculate that once the first wave is contained, we will develop strategies on a combination of mitigation measures (e.g. reduced isolation methods, antibody and other testing to return sections of the population to work, immunity passports, etc) to slowly transition to the new normal. The logistics of such a phased return to normal will be complex and a nightmare to enforce, particularly if self-isolation measures are in force for lengthy periods and people believe any second wave can be well contained by battle hardened health systems. We can be confident that a vaccine will be developed, hopefully by early 2021, but it will take time to get the vaccine distributed and administered in bulk. Mid 2021 is likely the best we can realistically hope for.

At this stage, my rough guess at a base case scenario on the timing for European and US lockdown is 3 to 5 weeks with another 6 to 10 weeks to transition to a semi-new normal. That’s somewhere between mid-June and early August with Europe leading the way followed by the US. A more pessimistic case could be that discipline amongst the population gets more lax as the weeks drag on and a second wave gathers momentum with a second lockdown required over the summer followed by a more timid and gradual transition afterwards lasting until the end of the year. Obviously, these timings are pure guesses at this time and may, and hopefully will, prove way off base.

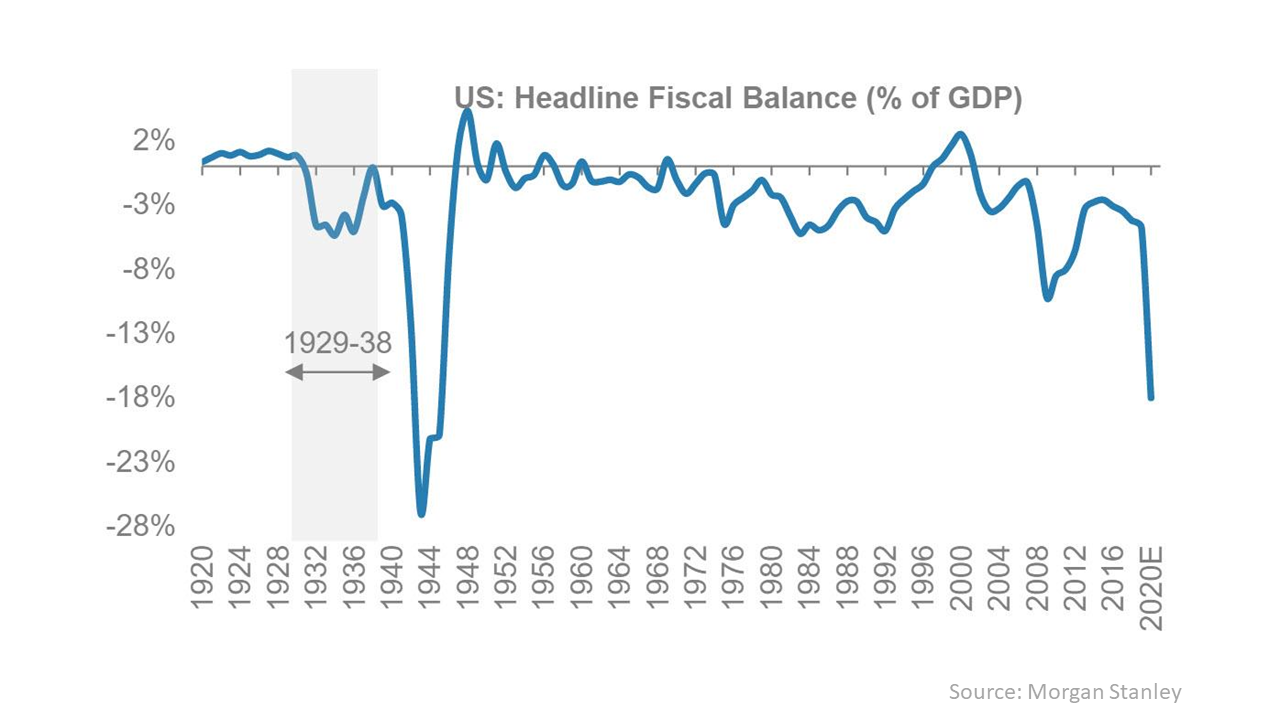
The economic impacts are highly uncertain but will become clearer as the weeks pass. For example, with just the first fiscal stimulus package passed in the US, the politicians are already listing their priorities for the second (and likely not to be the last either), Morgan Stanley expect the cyclically adjusted primary fiscal deficit to rise to 14% of GDP and the headline fiscal deficit at 18% of GDP in 2020, as per their graphic below. Given the unknown impact of the crisis on GDP numbers, these percentages could approach 15% to 20% with total debt of 110% to 120%. It’s depressing to note that prior to this crisis the IMF said the U.S. debt-to-GDP was already on an unsustainable path.

Although the euro zone comes into the crisis with less debt, last year it was 86% of GDP, Jefferies said in a ‘worse case’ outcome where nominal GDP falls 15% this year, the bloc’s budget gap would balloon to 17% of GDP from just 0.8% last year. They estimate in this scenario that the euro zone debt-GDP ratio could rise above 100% in 2021. As a percentage of GDP, Morgan Stanley estimated the G4+China cyclically adjusted primary deficit could rise to 8.5% of GDP in 2020, significantly higher than the 6.5% in 2009 immediately after the global financial crisis. Unemployment rates in the short term are projected to be mind boggling horrible at 20%+ in some countries. It seems to me that the austerity policies pursued after the financial crisis will not be as obvious an answer to repayment of this debt, not if we want western societies to survive. Addressing generational and structural income inequalities will have to be part of the solution. Hopefully, an acceleration of nationalism wouldn’t.

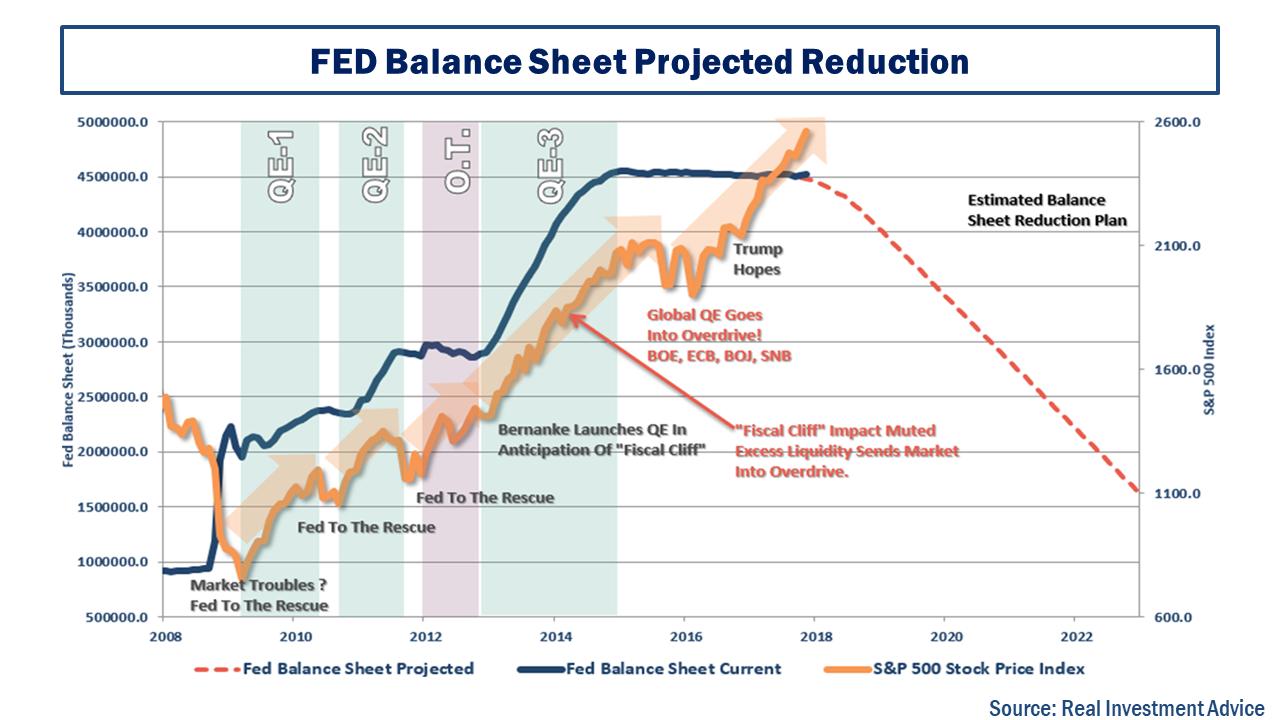
On the monetary side, the Fed’s balance sheet is now estimated to be an unprecedented $6 trillion, an increase of $1.6 trillion since the start of the Fed’s unprecedented bailout on the 13th of March. Bank of America estimates it could reach $9 trillion or 40% of GDP, as per the graphs below.

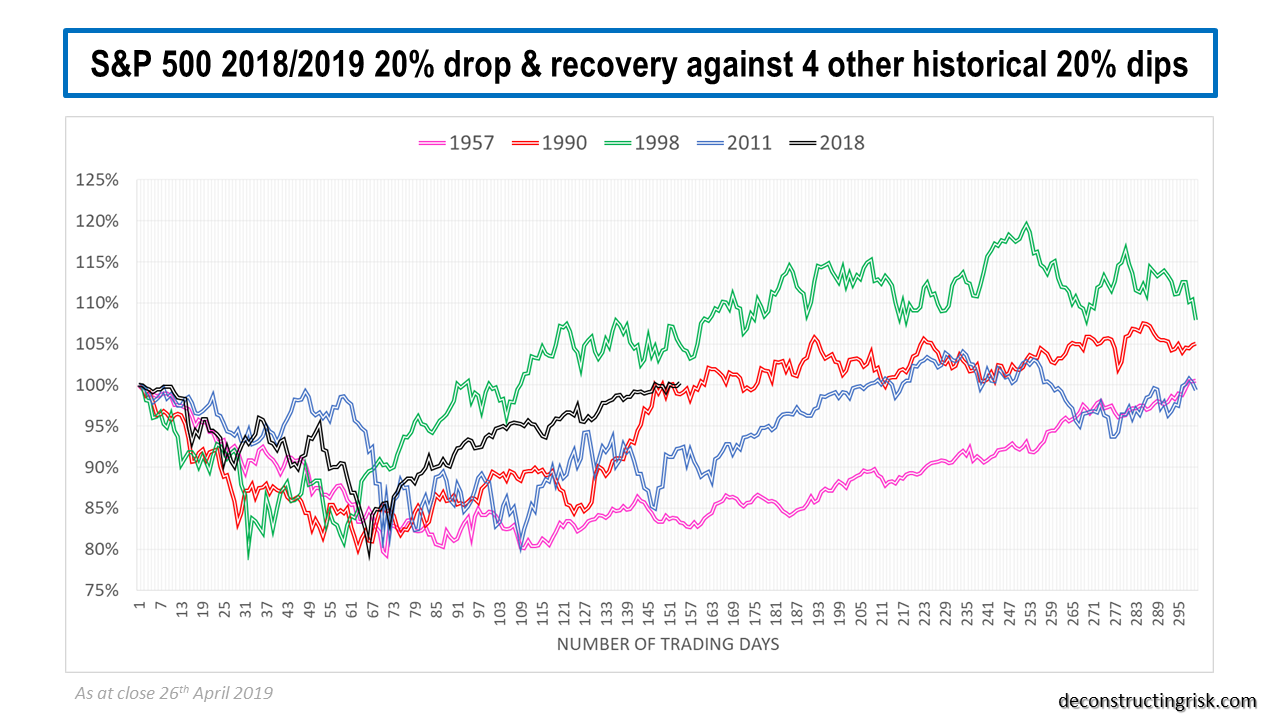
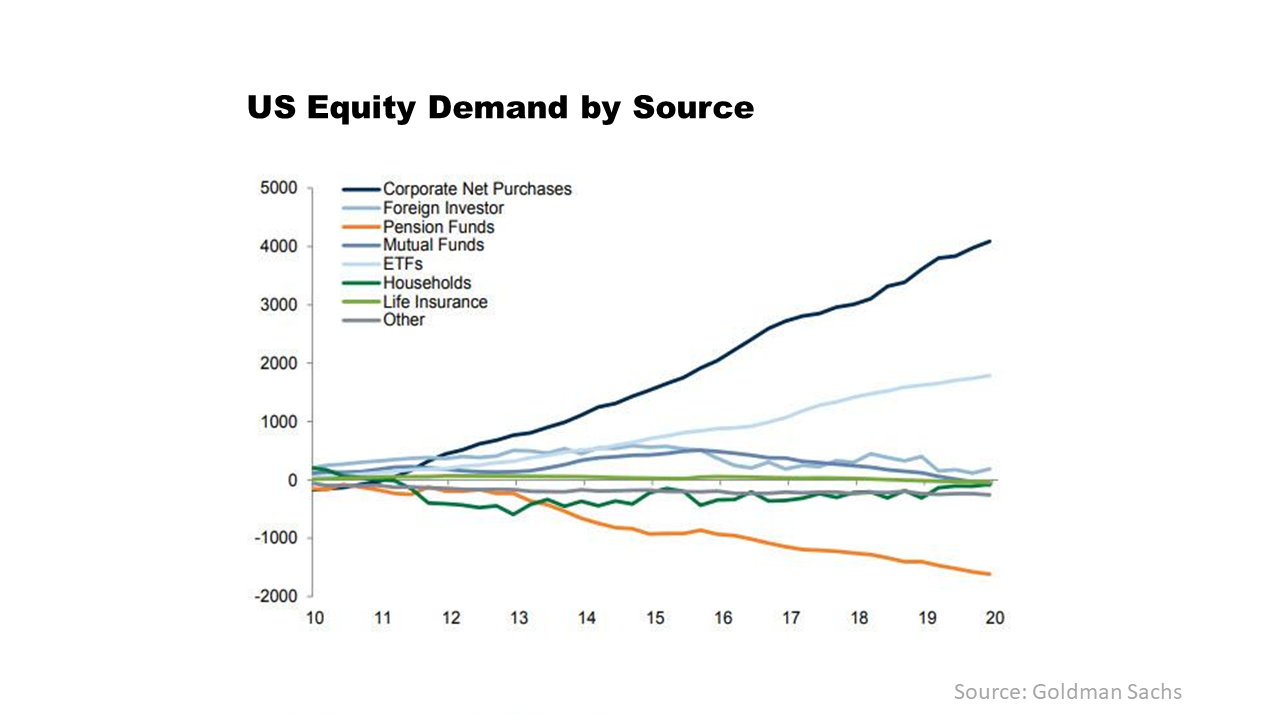
As to corporates and the stock market, dividends will undoubtably be under pressure as corporate delevering takes hold and without the crack cocaine of the bull market, share buybacks as the graph below shows, I fear there will be more pressure on valuations. The Q1 results season and forward guidance (or lack thereof), although it may have some surprises from certain firms in the communication, technology and consumer staples space, will likely only compound the negativity and uncertainty.

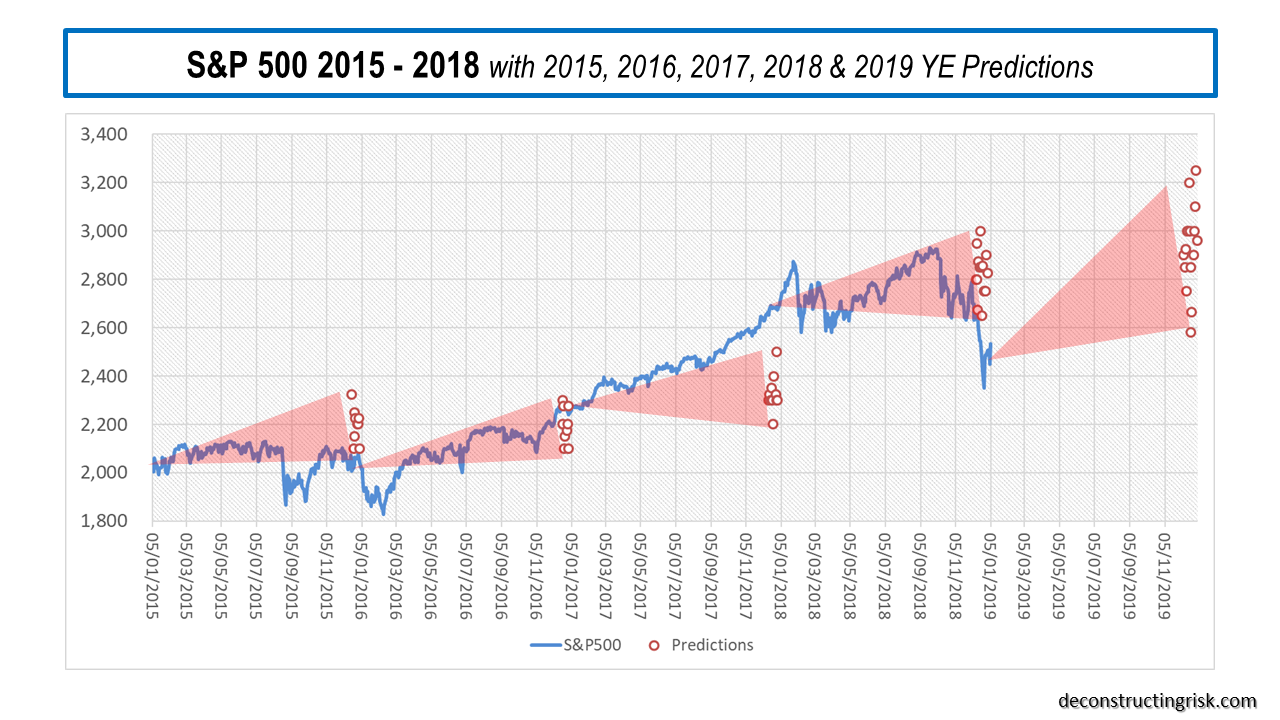
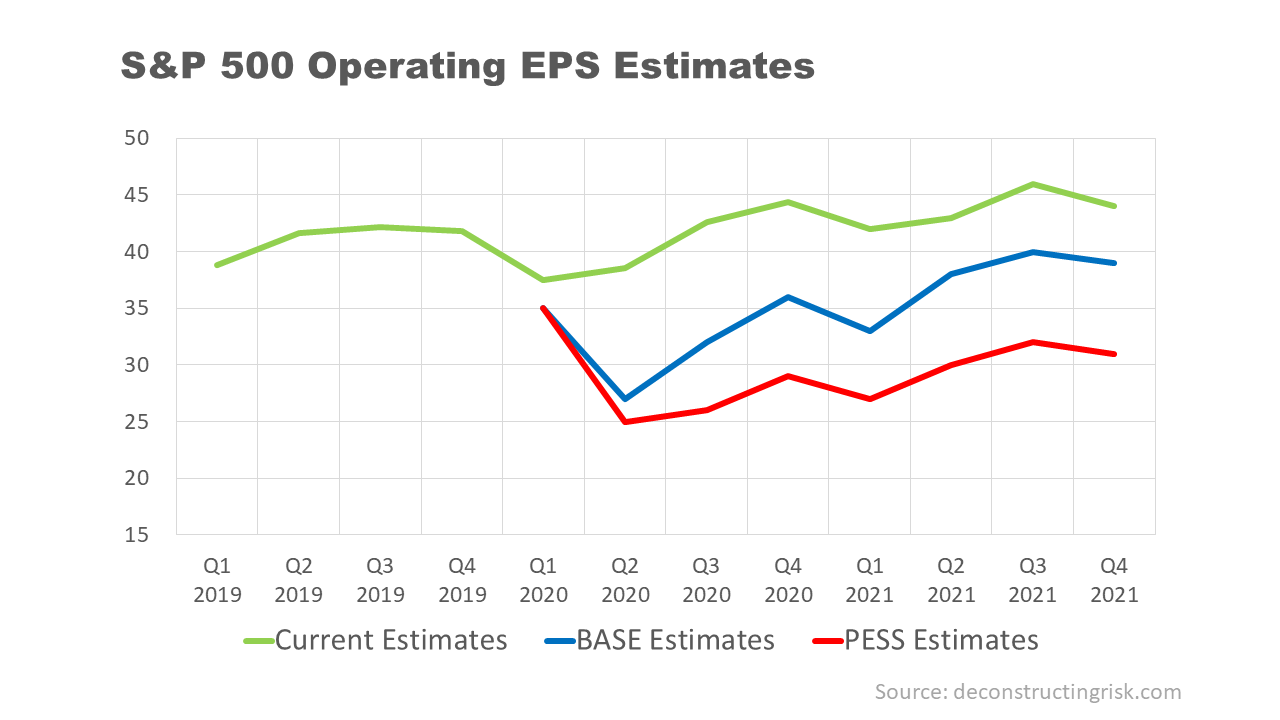
Using unscientific guesses on my part, I have estimated base and pessimistic operating EPS figures for the S&P500 as below. Based upon a forward PE (on a GAAP EPS) of 15 (approx. 12.75 on operating EPS basis), which is the level reached after the dot com bubble and the financial crisis, the resulting level for the S&P500 is 2,000 and 1,600 in the base and pessimistic scenarios respectively. That’s a further 20% and 35% drop from today’s levels respectively.

The coming weeks will likely be horrible in terms of human suffering and death across the developed world (one cannot even comprehend the potential suffering in the developing world if this insidious virus takes hold there). There is always hope and uncertainty will reduce over time. Major decisions will need to be made in the months and years ahead on the future of our societies. Learning from this pandemic to build more resilient societies and economies will be a task that lasts many years, possibility even generations. Major changes are coming after this health crisis subsides, hopefully they will be for the better.

Stay safe.

Goldilocks Lives

With the S&P500 off its September high and US 10 year yields well over 3% back in October, its crazy to think that just 6 months later the 10-year yield is currently around 2.6% and the S&P500 has just hit new highs. What was all the fuss about! A return to a steady US GDP non-inflationary growth as per the Q1 figures and with Q1 earnings coming in ahead of reduced expectations (with approx. half of the S&P500 reported), one could be tempted to think we have returned to the good old Goldilocks days. My predictions (here) of a rebound off the December lows followed by more volatility in Q1 were well wide of the mark with volatility across major asset classes eerily low as the market hits new highs. My record of been wide of the mark has at least been consistent with this post from January last year calling a premature ending to Goldilocks!

Some commentators are bullish on more upside for the market on the improved economic and earnings figures and cite comparisons to similar 20% drops and recoveries in 1998 and 2011. The graph below shows the comparisons, with 2 other 20% drops (although 1957 and 1990 were during recessions).

click to enlarge

As to what happens next, I have no idea. Some say at 17 times forward earnings; the market is not too expensive, and a wall of money will fuel this FOMO (fear of missing out) rally. Although the positive narrative from Q1 earnings will likely dictate short term trends, the market just feels like it has gotten ahead of itself to me and I feel comfortable taking some money off the table. As the graph below of monthly moves greater than +/- 3% shows, volatility is never that far away.

click to enlarge

A return to economic and earnings growth also raises the question of how long the Fed can remain ultra-accommodative. The arguments on raising rates and debts levels are all very déjà vu! For the moment however, unless the China trade talks fall apart, all looks surprisingly rosy.

There are always concerns. Bank of America recently highlighted that over the past five years, US firms have paid out $3.3 trillion in dividends and bought back $2.7 trillion of their own shares ($800 billion in 2018 alone) whilst taking on $2.5 trillion of new debt. The buybacks are responsible for 30% of earnings growth according to Bank of America (20% in 2018). The need to pay down this debt was a focus for many firms in the stock market rout. Bank of America predict further upside in equities to the summer before a pullback in Q3. The ever-excellent John Authers (ex-FT columnist now with Bloomberg) had an insightful article on corporate debt in March.

According to a recent report from Euler Hermes, the non-bank leveraged loan market is flattering the overall US corporate debt profile and corporate spreads are likely under estimating risk. This report from Moodys suggests that high leverage is offset by ample coverage of net interest expense. In this report, S&P estimate that “the proportion of companies having aggressive or highly leveraged financial risk has risen slightly to 61% (compared to 2009)”. Regulators also remain concerned about debt levels, particularly leveraged loans as per this recent report. The size of the leveraged loan market globally is estimated around $1.5 trillion, with the Bank of England estimates shown below.

click to enlarge

According to Ron Temple of Lazard Asset Management the “deterioration in underwriting standards for leveraged loans is increasingly worrisome” and the graph below shows the increased leverage in the market which combined with lax terms (approx. 80% are covenant lite loans) are a red flag in the event of any downturn.

click to enlarge

The buoyant private equity market is a testament to the joys of leverage, with recent PE raisings hitting records and an estimated $1.3 trillion of undeployed capital as of March. In this recent FT article, Jonathan Lavine of Bain Capital warned that private equity groups are taking on too much debt in the competition to win deals (the Bain 2019 market report is well worth a read).

Still, these are all things to worry about in times of stress. As of now, let’s enjoy Goldilocks return and keep dancing. Carefully mind you, it is late and we don’t want to wake those bears.

A naughty or nice 2019?

They say if you keep making the same prediction, at some stage it will come true. Well, my 2018 post a year ago on the return of volatility eventually proved prescient (I made the same prediction for 2017!). Besides the equity markets (multiple posts with the latest one here), the non-company specific topics covered in this blog in 2018 ranged from the telecom sector (here), insurance (here, here, and here), climate change (here and here), to my own favourite posts on artificial intelligence (here, here and here).

The most popular post (by far thanks to a repost by InsuranceLinked)) this year was on the Lloyds’ of London market (here) and I again undertake to try to post more on insurance specific topics in 2019. My company specific posts in 2018 centered on CenturyLink (CTL), Apple (AAPL), PaddyPowerBetfair (PPB.L), and Nvidia (NVDA). Given that I am now on the side-lines on all these names, except CTL, until their operating results justify my estimate of fair value and the market direction is clearer, I hope to widen the range of firms I will post on in 2019, time permitting. Although this blog is primarily a means of trying to clarify my own thoughts on various topics by means of a public diary of sorts, it is gratifying to see that I got the highest number of views and visitors in 2018. I am most grateful to you, dear reader, for that.

In terms of predictions for the 2019 equity markets, the graph below shows the latest targets from market analysts. Given the volatility in Q4 2018, it is unsurprising that the range of estimates for 2019 is wider than previously. At the beginning of 2018, the consensus EPS estimate for the S&P500 was $146.00 with an average multiple just below 20. Current 2018 estimates of $157.00 resulted in a multiple of 16 for the year end S&P500 number. The drop from 20 to 16 illustrates the level of uncertainty in the current market

click to enlarge

For 2019, the consensus EPS estimate is (currently) $171.00 with an average 2019 year-end target of 2,900 implying a 17 multiple. Given that this EPS estimate of 9% growth includes sectors such as energy with an assumed healthy 10% EPS growth projection despite the oil price drop, it’s probable that this EPS estimate will come down during the upcoming earnings season as firms err on the conservative side for their 2019 projections.

The bears point to building pressures on top-line growth and on record profit margins. The golden boy of the moment, Michael Wilson of Morgan Stanley, calls the current 2019 EPS estimates “lofty”. The bulls point to the newly established (as of last Friday) Powell Put and the likely resolution of the US-China trade spat (because both sides need it). I am still dubious on a significant or timely relaxation of global quantitative tightening and don’t feel particularly inclined to bet money on the Orange One’s negotiating prowess with China. My guess is the Chinese will give enough for a fudge but not enough to satisfy Trump’s narcissistic need (and political need?) for a visible outright victory. The NAFTA negotiations and his stance on the Wall show outcomes bear little relation to the rhetoric of the man. These issues will be the story of 2019. Plus Brexit of course (or as I suspect the lack thereof).

Until we get further insight from the Q4 earnings calls, my current base assumption of 4% EPS growth to $164 with a multiple of 15 to 16 implies the S&P500 will be range bound around current levels of 2,400 – 2,600. Hopefully with less big moves up or down!

Historically, a non-recessionary bear market lasts on average 7 months according to Ed Clissold of Ned Davis Research (see their 2019 report here). According to Bank of America, since 1950 the S&P 500 has endured 11 retreats of 12% or more in prolonged bull markets with these corrections lasting 8 months on average. The exhibit below suggests that such corrections only take 5 months to recover peak to trough.

click to enlarge

To get a feel for the possible direction of the S&P500 over 2019, I looked at the historical path of the index over 300 trading days after a peak for 4 non-recessionary and 4 recessionary periods (remember recessions are usually declared after they have begun), as below.

Note: These graphs have been subsequently updated for the S&P500 close to the 18th January 2019. 

click to enlarges&p500 q42018 drop compared to 4 nonrecession drops in 1962 1987 1998 & 2015 updated


click to enlarges&p500 q42018 drop compared to 4 recession drops in 1957 1974 1990 & 2000 updated


I will leave it to you, dear reader, to decide which path represents the most likely one for 2019. It is interesting that the 1957 track most closely matches the moves to date  (Ed: as per the date of the post, obviously not after that date!) but history rarely exactly rhymes. I have no idea whether 2019 will be naughty or nice for equity investors. I can predict with 100% certainty that it will not be dull….

Given that Brightwater’s pure Alpha fund has reportingly returned an impressive 14.6% for 2018 net of fees, I will leave the last word to Ray Dalio, who has featured regularly in this blog in 2018, as per his recent article (which I highly recommend):

Typically at this phase of the short-term debt cycle (which is where we are now), the prices of the hottest stocks and other equity-like assets that do well when growth is strong (e.g., private equity and real estate) decline and corporate credit spreads and credit risks start to rise. Typically, that happens in the areas that have had the biggest debt growth, especially if that happens in the largely unregulated shadow banking system (i.e., the non-bank lending system). In the last cycle, it was in the mortgage debt market. In this cycle, it has been in corporate and government debt markets.

When the cracks start to appear, both those problems that one can anticipate and those that one can’t start to appear, so it is especially important to identify them quickly and stay one step ahead of them.

So, it appears to me that we are in the late stages of both the short-term and long-term debt cycles. In other words, a) we are in the late-cycle phase of the short-term debt cycle when profit and earnings growth are still strong and the tightening of credit is causing asset prices to decline, and b) we are in the late-cycle phase of the long-term debt cycle when asset prices and economies are sensitive to tightenings and when central banks don’t have much power to ease credit.

A very happy and healthy 2019 to all.

A frazzled Goldilocks?

Whatever measure you look at, equities in the US are overvalued, arguably in bubble territory. Investors poured record amounts into equity funds in recent weeks as the market melt-up takes hold. One of the intriguing features of the bull market over the past 18 months has been the extraordinary low volatility. Hamish Preston of S&P Dow Jones Indices estimated that the average observed 1-month volatility in the S&P 500 in 2017 is “lower than in any other year since 1970”. To illustrate the point, the graph below shows the monthly change in the S&P500 over recent years.

click to enlarge

The lack of any action below 0% since November 2016 and any pullback greater than 2% since January 2016 is striking. “Don’t confuse lack of volatility with stability, ever” is a quote from Nassim Nicolas Taleb that’s seems particularly apt today.

Andrew Lapthorne of SocGen highlighted that low risk markets tend to have a big knock on effect with a “positive feedback mechanism embedded in many risk models”. In other words, the less risk is observed in the market and used as the basis for model inputs, the more risk the quant models allow investors to take! [The impact of quant models and shadow risks from passive investing and machine learning are areas I hope to explore further in a future post.]

One risk that has the potential to spoil the party in 2018 is the planned phased normalisation of monetary policy around the world after the great experimentations of recent years. The market is currently assuming that Central Banks will guarantee that Goldilocks will remain unfrazzled as they deftly steer the ship back to normality. A global “Goldilocks put” if I could plagiarize “the Greenspan put”! Or a steady move away from the existing policy that no greater an economic brain than Donald Trump summarized as being: “they’re keeping the rates down so that everything else doesn’t go down”.

The problem for Central Banks is that if inflation stays muted in the short-term and monetary policy remains loose than the asset bubbles will reach unsustainable levels and require pricking. Or alternatively, any attempt at monetary policy normalization may dramatically show how Central Banks have become the primary providers of liquidity in capital markets and that even modest tightening could result in dangerously imbalances within the now structurally dependent system.

Many analysts (and the number is surprising large) have been warning for some time about the impact of QE flows tightening in 2018. These warnings have been totally ignored by the market, as the lack of volatility illustrates. For example, in June 2017, Citi’s Matt King projected future Central Bank liquidity flows and warned that a “significant unbalancing is coming“. In November 2017, Deutsche Bank’s Alan Ruskin commented that “2018 will see the world’s most important Central Bank balance sheets shift from a 12 month expansion of more than $2 trillion, to a broadly flat position by the end of 2018, assuming the Fed and ECB act according to expectations”. The projections Deutsche Bank produced are below.

click to enlarge

Andrew Norelli of JP Morgan Asset Management in a piece called “Stock, Flow or Impulse?” stated that “It’s still central bank balance sheets, and specifically the flow of global quantitative easing (QE) that is maintaining the buoyancy in financial asset prices”. JP Morgan’s projections of the top 4 developed countries are below.

click to enlarge

Lance Roberts of RealInvestmentAdvice.com produced an interesting graph specifically relating to the Fed’s balance sheet, as below. Caution should be taken with any upward trending metric when compared to the S&P500 in recent years!

click to enlarge

Of course, we have been at pre-taper junctions many times before and every previous jitter has been met with soothing words from Central Banks and more liquidity creation. This time though it feels different. It has to be different. Or Central Bankers risk been viewed as emperors without cloths.

The views of commentators differ widely on this topic. Most of the business media talking heads are wildly positive (as they always are) on the Goldilocks status quo. John Mauldin of MauldinEconomics.com believes the number one risk factor in the US is Fed overreach and too much tightening. Bank of America Merrill Lynch chief investment strategist Michael Hartnett, fears a 1987/1994/1998-style flash crash within the next three months caused by a withdrawal of central bank support as interest rates rise.

Christopher Cole of Artemis Capital Management, in a wonderful report called “Volatility and the Alchemy of Risk”, pulls no punches about the impact of global central banks having pumped $15 trillion in cheap money stimulus into capital markets since 2009. Cole comments that “amid this mania for investment, the stock market has begun self-cannibalizing” and draws upon the image of the ouroboros, an ancient Greek symbol of a snake eating its own tail. Cole estimates that 40% of EPS growth and 30% of US equity gains since 2009 have been as a direct result of the financial engineering use of stock buy backs. Higher interest rates, according to Cole, will be needed to combat the higher inflation that will result from this liquidity bonanza and will cut off the supply for the annual $800 billion of share buybacks. Cole also points to the impact on the high yield corporate debt market and the overall impact on corporate defaults.

Another interesting report, from a specific investment strategy perspective, is Fasanara Capital’s Francesco Filia and the cheerfully entitled “Fragile Markets On The Edge of Chaos”. As economies transition from peak QE to quantitative tightening, Filia “expect markets to face their first real crash test in 10 years” and that “only then will we know what is real and what is not in today’s markets, only then will we be able to assess how sustainable is the global synchronized GDP growth spurred by global synchronized monetary printing”. I like the graphic below from the report.

click to enlarge

I found the reaction to the Trump’s administration misstep on dollar strength interesting this week. Aditya Bhave and Ethan Harris, economists at Bank of America, said of the episode that “the Fed will see the weak dollar as a sign of easy financial conditions and a green light to keep tightening monetary policy”. ECB President Mario Draghi was not happy about the weak dollar statement as that would complicate Europe’s quantitative tightening plans. It was also interesting to hear Benoit Coeure, a hawkish member ECB executive board, saying this week that “it’s happening at different paces across the region, but we are moving to the point where we see wages going up”.

I think many of the Central Banks in developed countries are running out of wriggle room and the markets have yet to fully digest that reality. I fear that Goldilocks is about to get frazzled.

Lessons not learnt and voices unheard

There have been some interesting articles published over the past week or so to mark the five year anniversary of the Lehman collapse.

Hank Paulson remembered the events of that chaotic time in a BusinessWeek interview. He concluded that despite having a hand in increasing the size of the US banks like JP Morgan and Bank of America (currently the 2nd and 3rd largest global banks by tier 1 capital) “too big to fail is an unacceptable phenomenon”. He also highlighted the risk of incoherence amongst the numerous US and global regulators and that “more still needs to be done with the shadow-banking markets, which I define to be the money-market funds and the so-called repo market, which supplies wholesale funding to banks”.

Another player on the regulatory side, the former chairman of the UK FSA Adair Turner, continued to develop his thoughts on what lessons need to be learnt from the crisis in the article “The Failure of Free Market Finance”, available on the Project Syndicate website. Turner has been talking about these issues in Sweden and London this week (which essentially follow on from his February paper “Debt, Money and Mephistopheles: How Do We Get Out Of This Mess?”). where he argues that there are two key issues which need to be addressed to avert future instability.

The first is how to continue to delever and reduce both private and public debt. Turner believes that “some combination of debt restructuring and permanent debt monetization (quantitative easing that is never reversed) will in some countries be unavoidable and appropriate”. He says that realistic actions need to taken such as writing off Greek debt and a restructuring of Japanese debt. The two graphs below show where we were in terms of private debt in a number of jurisdictions as at the end of 2012 and show that reducing levels of private debt in many developed countries have been offset by increases in public debt over recent years.

click to enlarge Domestic Credit to Private Sector 1960 to 2012

Public and Private Debt as % of GDP OECD US Japan Euro Zone

The second issue that Turner highlights is the need for global measures to ensure we all live in a less credit fuelled world in the future. He states that “what is required is a wide-ranging policy response that combines more powerful countercyclical capital tools than currently planned under Basel 3, the restoration of quantitative reserve requirements to advanced-country central banks’ policy toolkits, and direct borrower constraints, such as maximum loan-to-income or loan-to-value limits, in residential and commercial real-estate lending”.

Turner is arguing for powerful actions. He admits that they effectively mean “a rejection of the pre-crisis orthodoxy that free markets are as valuable in finance as they are in other economic sectors”. I do not see an appetite for such radical actions amongst the political classes nor a consensus amongst policy makers that such a rejection is required. Indeed debt provision outside of the traditional banking systems by way of new distribution channels such as peer to peer lending is an interesting development (see Economist article “Filling the Bank Shaped Hole”)

Indeed the current frothiness in the equity markets, itself a direct result of the on-going (and never ending if the market’s response to the Fed’s decisions this week is anything to go by) loose monetary policy, is showing no signs of abating. Market gurus such as Buffet and Icahn have both come out this week and said the markets are looking overvalued. My post on a possible pullback in September is looking ever more unlikely as the month develops (S&P 500 up 4% so far this month!).

Maybe, just maybe, the 5th anniversary of Lehman’s collapse will allow some of the voices on the need for fundamental structural change in the way we run our economies to be heard. Unfortunately, I doubt it.