This week it’s Syria and Russia, last week it was China. Serious in their own right as these issues are, Donald Trump’s erratic approach to off the cuff policy development is exhausting markets. In the last 60 trading days, the S&P500 has had 9 days over 1% and 12 days below -1%. For above 0.5% and more than -0.5%, the number of days is 21 and 15 respectively! According to an off the record White House insider, “a decision or statement is made by the president, and then the principals come in and tell him we can’t do it” and “when that fails, we reverse engineer a policy process to match whatever the president said”. We live in some messed up world!
As per this post, the mounting QE withdrawals by Central Banks is having its impact on increased volatility. Credit Suisse’s CEO, Tidjane Thiam, this week said, “the tensions are showing and it’s very hard to imagine where you can get out of a scenario of prolonged extraordinary measures without some kind of, I always use the word ‘trauma’”.
Fortune had an insightful article on the US debt issue last month where they concluded that something has to give. According to an Institute of International Finance report, global debt reached a record $237 trillion in 2017, more than 317% of global GDP with the developed world higher around 380%. According to the Monthly Treasury Statement just released, the US fiscal deficit is on track for the fiscal years (Q4 to Q3 of calendar year) 2018 and 2019 to be $833 billion and $984 billion compared to $666 billion in 2017.
This week also marks the publication of the Congressional Budget Office’s fiscal projections for the US after considering the impact of the Trump tax cuts. The graphs below from the report illustrate the impact they estimate, with the fiscal deficits higher by $1.5 trillion over 10 years. It’s important to note that these estimates assume a relatively benign economic environment over the next 10 years. No recession, for example, over the next 10 years, as assumed by the CBO, would mean a period of nearly 20 years without one! That’s not likely!
The first graph below shows some of the macro-economic assumptions in the CBO report, the second showing the aging profile in the US which determines participation rates in the economy and limits its potential, with the following graphs showing the fiscal estimates.
click to enlarge 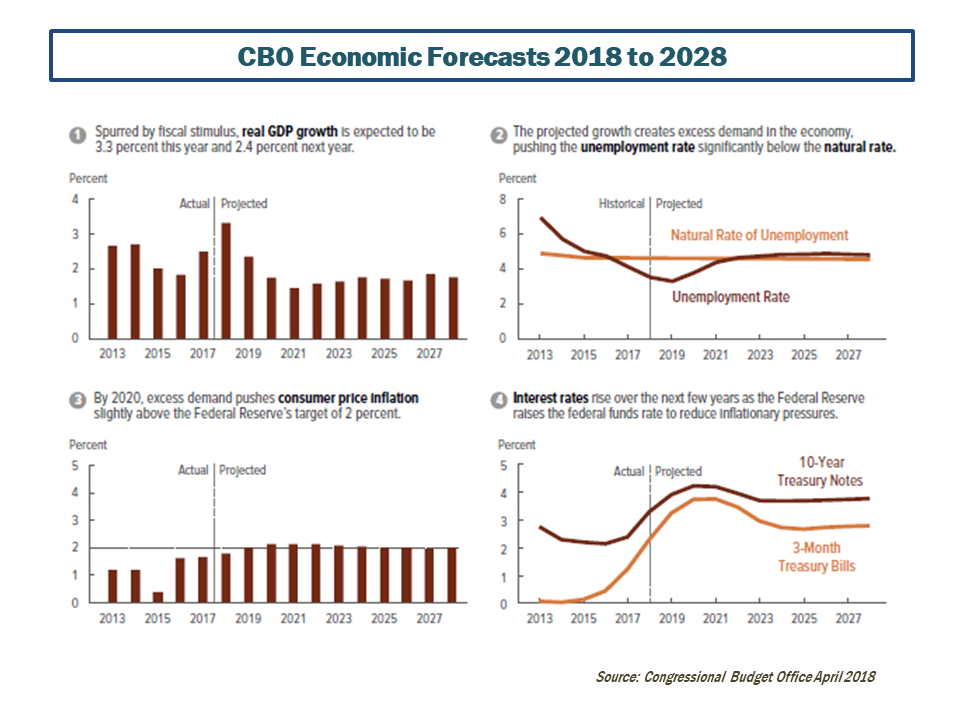 click to enlarge
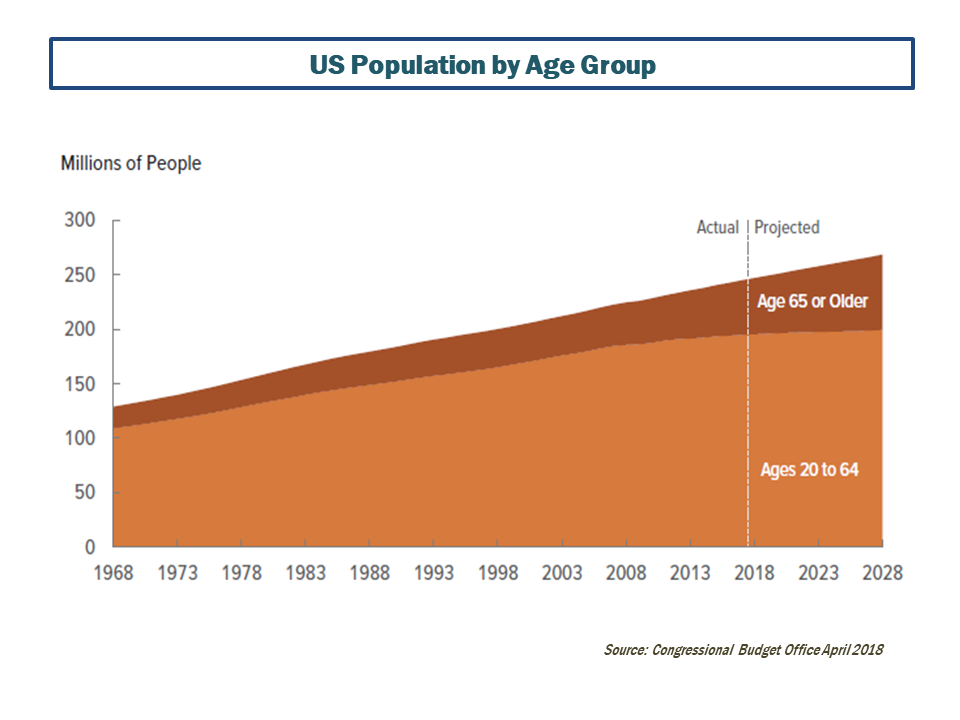
click to enlarge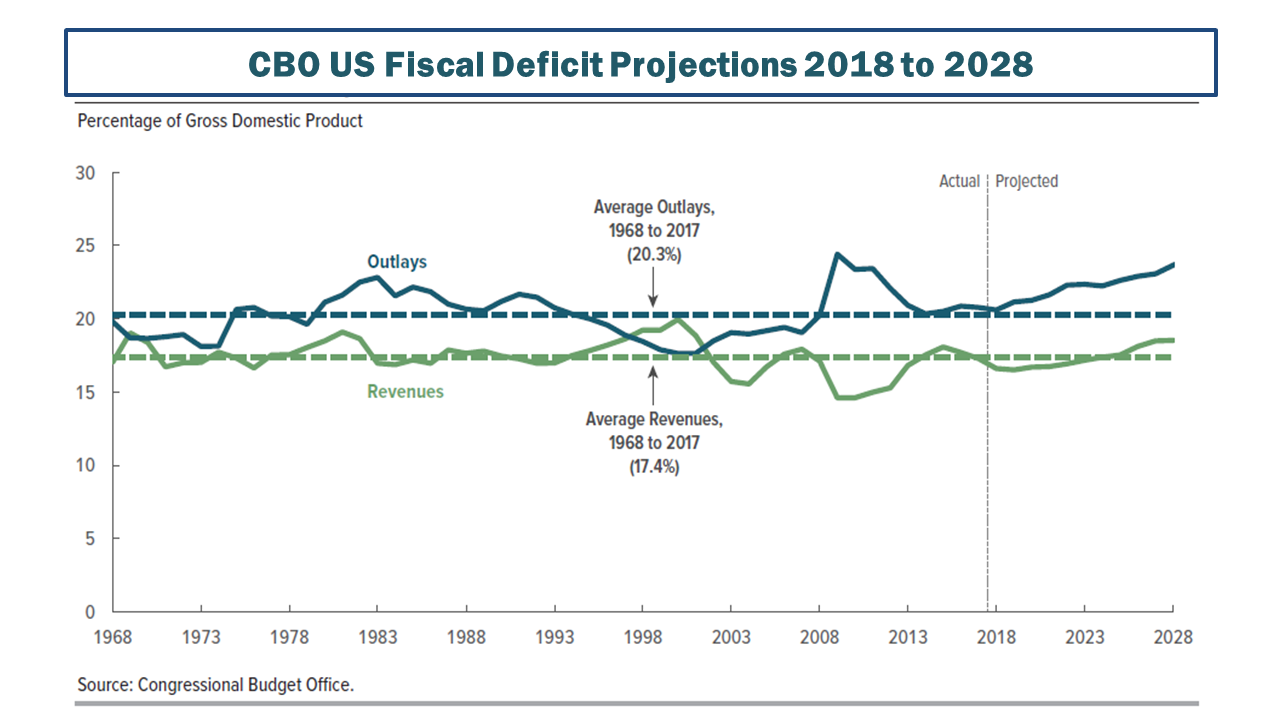
click to enlarge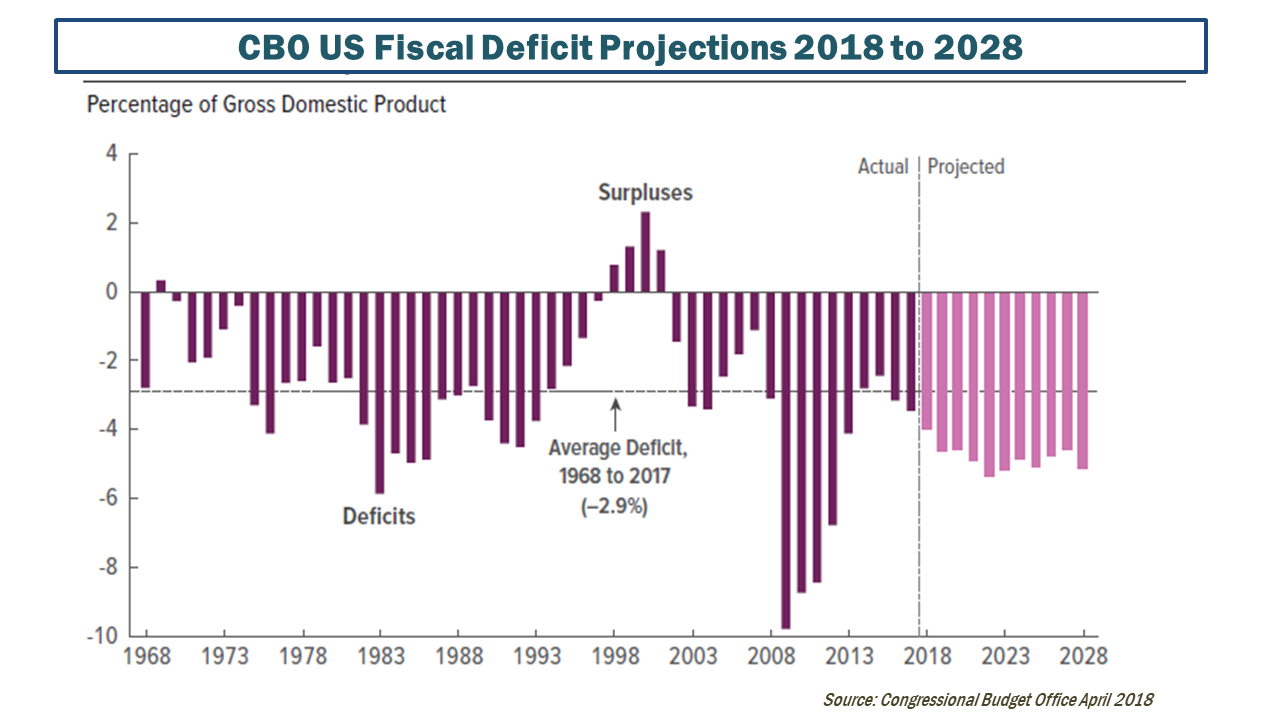
click to enlarge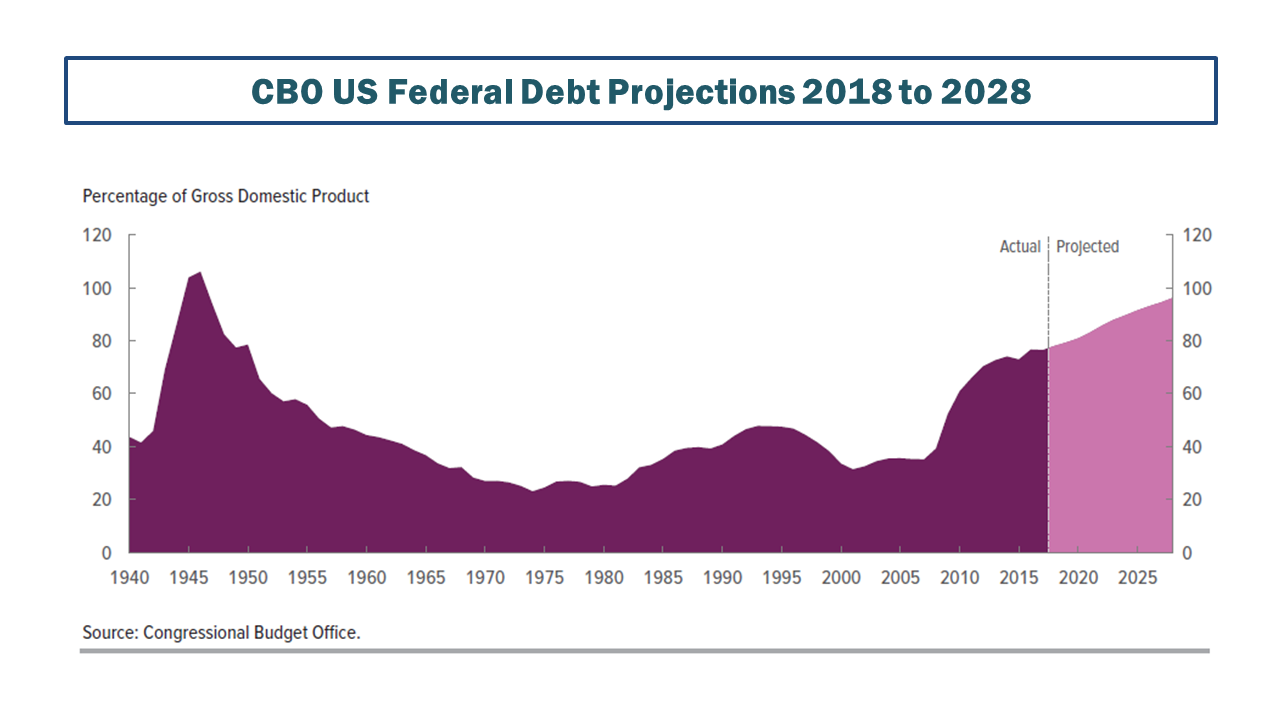
The respected author Satyajit Das highlighted in this article how swelling levels of debt will amplify the effect of any rate rises, with higher rates having the following impacts:
- Increase credit risk. LIBOR has already risen, as per this post, and large sways of corporate debt is driven by LIBOR. This post shows some of debt levels in S&P500 firms, as per the IMF Global Financial Stability report from last April and the graph below tells its own tale.
- Generate large mark-to-market losses on existing debt holdings. A 1% increase is estimated to impact US government debt by $2 trillion globally.
- Drive investors away from risky assets such as equity, decimating the now quaint so-called TINA trade (“there is no alternative”).
- Divert cash to servicing debt, further dampening economic activity and business investment.
- Restrict the ability of governments to deploy fiscal stimulus.
click to enlarge
Back in the land of Nero, or Trump in our story, his new talking head in chief, Larry Kudlow, recently said the White House would propose a “rescission bill” to strip out $120 billion from nondefense discretionary spending. Getting that one past either the Senate or the House ahead of the November midterm elections is fanciful and just not probable after the elections. So that’s what the Nero of our time is planning in response to our hypothetical Rome burning exasperated by his reckless fiscal policies (and hopefully there wouldn’t be any unjustified actual burning as a result of his ill thought out foreign policies over the coming days and weeks).